
Key Insights
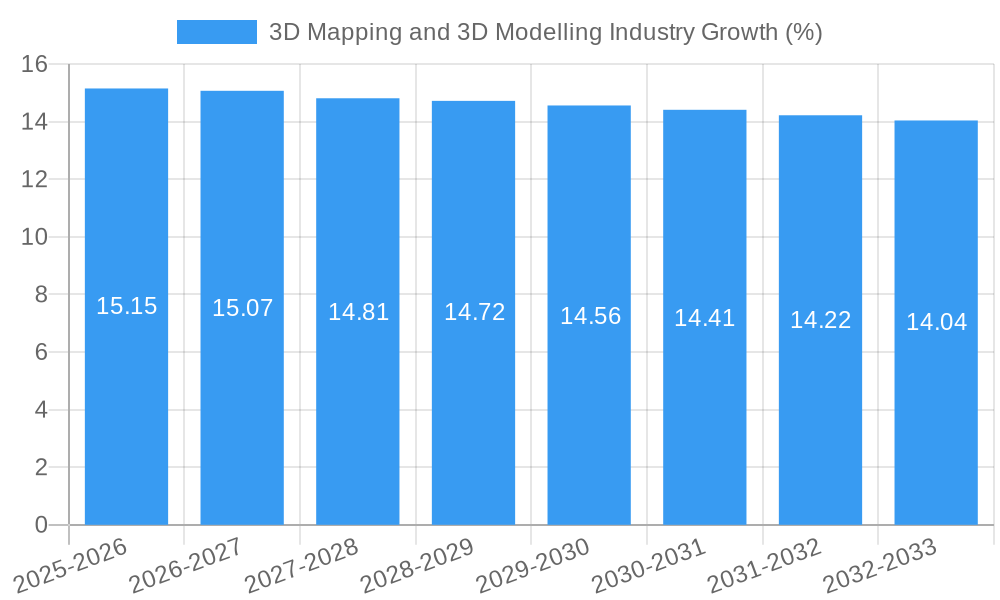
The global 3D Mapping and 3D Modeling market is experiencing robust expansion, currently valued at approximately $7.48 billion. This growth is propelled by a compelling Compound Annual Growth Rate (CAGR) of 14.67%, indicating a dynamic and evolving industry poised for significant future development. The surge in demand is fueled by a confluence of factors, notably the increasing adoption of 3D technologies across diverse sectors. Advancements in computing power, sensor technology, and sophisticated software solutions have made high-fidelity 3D data capture and manipulation more accessible and cost-effective. Key drivers include the expanding applications in entertainment and media for immersive visual experiences, the critical role in autonomous vehicle development for precise environmental understanding, and the growing use in healthcare for surgical planning and anatomical visualization. Furthermore, the construction industry is leveraging 3D modeling for efficient design, simulation, and progress monitoring, while defense applications utilize it for enhanced situational awareness and training. The market segments of 3D Mapping and 3D Modeling themselves are seeing increased sophistication, with sub-applications like projection mapping and texture mapping becoming integral to visual design and marketing.
The forecast period from 2025 to 2033 anticipates sustained, high-level growth, driven by ongoing innovation and deeper integration of 3D technologies into mainstream workflows. Emerging trends point towards greater real-time data processing capabilities, the integration of AI and machine learning for automated feature extraction and analysis, and the expansion of augmented reality (AR) and virtual reality (VR) applications that rely heavily on accurate 3D representations of the real world. While the market is characterized by strong growth, certain restraints might emerge, such as the initial investment costs for advanced hardware and software, the need for specialized expertise, and evolving data privacy concerns related to the collection of detailed spatial information. However, the overwhelming benefits in terms of efficiency, accuracy, and enhanced user experience across industries like automotive, healthcare, building and construction, defense, and transportation are expected to outweigh these challenges, solidifying the market's upward trajectory. Leading companies are actively investing in research and development to capture a significant share of this expanding market.
Here's the SEO-optimized, detailed report description for the 3D Mapping and 3D Modelling Industry, crafted without placeholders and ready for immediate use.
Report Title: 3D Mapping and 3D Modelling Market: Global Industry Analysis, Size, Share, Growth, Trends, and Forecast 2025–2033
Report Description:
Delve into the dynamic and rapidly evolving 3D mapping and 3D modelling industry with this comprehensive market analysis. This report provides an in-depth exploration of the global market landscape, examining key growth drivers, emerging trends, dominant segments, and strategic outlooks. With meticulous research spanning the historical period 2019–2024, the base year 2025, and a robust forecast period of 2025–2033, this report offers invaluable insights for stakeholders seeking to capitalize on the burgeoning opportunities in spatial data solutions, digital twins, virtual reality (VR), and augmented reality (AR) applications.
The 3D mapping and 3D modelling market is witnessing unprecedented growth fueled by advancements in surveying technology, AI-powered data processing, and the increasing demand for high-fidelity digital representations across diverse sectors. This report dissects the market by segment, including 3D mapping and 3D modelling, and analyzes its application in critical areas such as projection mapping, texture mapping, maps and navigation, and other innovative uses. Furthermore, it identifies the leading end-user verticals, including Entertainment and Media, Automotive, Healthcare, Building and Construction, Defense, and Transportation, to pinpoint high-growth opportunities.
Gain a competitive edge by understanding the market structure, competitive dynamics, product innovations, and strategic initiatives of industry leaders such as Airbus Defense and Space, Cybercity 3D Inc, ESRI Inc, Golden Software LLC, Intermap Technologies, The Foundry Visionmongers Ltd, Autodesk Inc, Topcon Positioning Systems Inc, Trimble Inc, Bentley Systems Inc, Saab AB, and others. This report is an essential resource for businesses, investors, and researchers aiming to navigate and thrive in the global 3D technology market.
3D Mapping and 3D Modelling Industry Market Structure & Competitive Dynamics
The global 3D mapping and 3D modelling industry exhibits a moderately concentrated market structure, characterized by the presence of established technology giants and innovative specialized firms. Leading players like Autodesk Inc. and ESRI Inc. command significant market share due to their comprehensive software suites and extensive R&D investments, often exceeding 200 Million in annual R&D expenditure. The innovation ecosystem is robust, driven by continuous advancements in laser scanning, photogrammetry, AI-driven point cloud processing, and real-time rendering technologies. Regulatory frameworks, particularly concerning data privacy and intellectual property for digital assets, are evolving but generally support industry growth. Product substitutes, such as traditional 2D mapping and manual 3D design processes, are increasingly being displaced by the efficiency and accuracy of 3D solutions. End-user trends highlight a growing demand for photorealistic visualizations, accurate geospatial data for urban planning, and immersive experiences in entertainment and simulation. Mergers and acquisitions (M&A) are active, with significant deal values frequently reaching hundreds of Millions, indicating strategic consolidation and the acquisition of specialized technologies. For instance, major acquisitions in the past decade have involved deal values ranging from 50 Million to over 500 Million, reshaping the competitive landscape. Key M&A activities aim to expand technological capabilities and market reach.
3D Mapping and 3D Modelling Industry Industry Trends & Insights
The 3D mapping and 3D modelling industry is poised for substantial growth, projected to achieve a Compound Annual Growth Rate (CAGR) of approximately 18.5% over the forecast period. This expansion is primarily driven by the accelerating adoption of digital twins across industries, creating highly accurate virtual replicas of physical assets, processes, and systems. The increasing demand for sophisticated geospatial data solutions for urban planning, infrastructure development, and environmental monitoring is a significant growth catalyst. Furthermore, the proliferation of virtual reality (VR) and augmented reality (AR) technologies, particularly in the Entertainment and Media and Automotive sectors, is fueling the need for high-fidelity 3D models and immersive mapping experiences. Advancements in drone technology and LiDAR scanning are democratizing access to precise 3D data acquisition, reducing costs and improving efficiency. The integration of Artificial Intelligence (AI) and Machine Learning (ML) algorithms is revolutionizing data processing, enabling automated feature extraction, semantic segmentation, and predictive analytics within 3D environments. Consumer preferences are shifting towards interactive and engaging visual content, which 3D mapping and modelling readily provides. The Defense sector's continuous need for detailed reconnaissance and simulation capabilities, along with the Transportation industry's focus on intelligent infrastructure and autonomous vehicle development, further bolsters market penetration. The Healthcare sector is also exploring 3D modelling for medical imaging, surgical planning, and pharmaceutical research, opening up new avenues for market growth. The competitive dynamics are intensifying, with companies investing heavily in R&D to offer innovative solutions that address the unique challenges and opportunities within each end-user vertical. Market penetration is expected to reach over 70% in key verticals by the end of the forecast period, underscoring the transformative impact of these technologies. The overall market size is projected to grow from an estimated 50 Billion in the base year 2025 to over 150 Billion by 2033.
Dominant Markets & Segments in 3D Mapping and 3D Modelling Industry
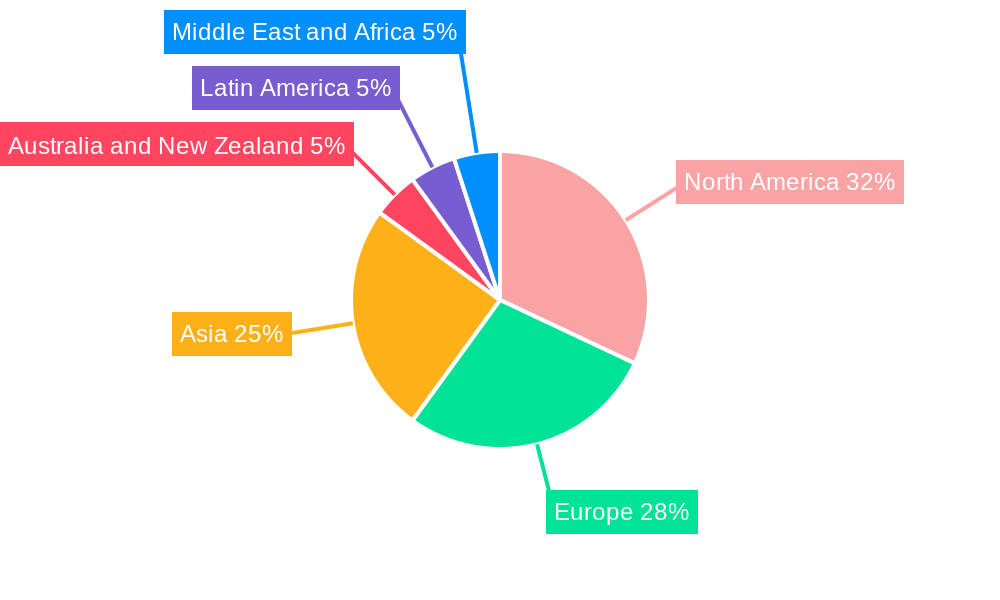
The 3D Mapping and 3D Modelling Industry exhibits distinct regional dominance and segment leadership. Geographically, North America, with an estimated market share of 30% in 2025, currently leads due to early adoption of advanced technologies, strong government initiatives in smart city development, and a robust presence of key industry players. Western Europe follows closely, driven by significant investments in infrastructure modernization and a mature market for advanced visualization. Asia Pacific is emerging as a rapidly growing market, propelled by rapid urbanization, government investments in smart infrastructure projects, and the burgeoning digital economy.
Within the Type segmentation:
- 3D Mapping is expected to hold the larger market share, projected at 65 Billion by 2025, due to its widespread application in geospatial analysis, navigation, urban planning, and surveying. Key drivers include the increasing use of aerial and terrestrial LiDAR, satellite imagery, and drone-based mapping solutions for creating accurate digital representations of the Earth's surface. Economic policies supporting infrastructure development and environmental monitoring are critical factors.
- 3D Modelling, valued at approximately 45 Billion in 2025, is driven by its applications in content creation, product design, architecture, and entertainment. Technological advancements in CGI and real-time rendering are key growth accelerators.
In terms of Application:
- Maps and Navigation is a dominant segment, accounting for an estimated 40 Billion in 2025. The increasing reliance on GPS, autonomous vehicles, and location-based services fuels its growth. Infrastructure improvements and consumer demand for precise navigation are paramount.
- Projection Mapping and Texture Mapping, while smaller, are experiencing significant growth, particularly within the Entertainment and Media and Automotive sectors, with combined market potential of over 30 Billion by 2025. Advancements in display technologies and immersive experiences are key drivers.
- Other Applications, including digital twins, industrial design, and scientific visualization, collectively represent a rapidly expanding segment, expected to reach over 30 Billion by 2025.
The End-user Vertical landscape reveals:
- Building and Construction is a leading vertical, with a market size estimated at 25 Billion in 2025. BIM (Building Information Modelling) integration and the demand for virtual walkthroughs and as-built documentation are major drivers. Government regulations promoting digital construction are crucial.
- Defense is a significant consumer of 3D mapping and modelling for intelligence, surveillance, reconnaissance (ISR), and training simulations, with a market size of approximately 20 Billion in 2025. National security investments and advanced military technology procurement are key drivers.
- Transportation, particularly with the advent of autonomous vehicles and smart city initiatives, is projected to reach 18 Billion by 2025. Infrastructure development and safety improvements are paramount.
- Entertainment and Media is a high-growth vertical, with its market size estimated at 15 Billion in 2025, driven by the demand for realistic visual effects, gaming environments, and immersive experiences. Consumer engagement and technological innovation in content creation are key.
- Automotive is rapidly adopting 3D technologies for vehicle design, simulation, and driver assistance systems, with a market size of 12 Billion in 2025. Advancements in autonomous driving technology are a primary driver.
- Healthcare, though nascent, is showing strong potential, projected to reach 10 Billion by 2025, with applications in medical imaging, surgical planning, and pharmaceutical development. Technological innovation in medical devices and research funding are key factors.
3D Mapping and 3D Modelling Industry Product Innovations
Recent product innovations in the 3D mapping and 3D modelling industry are focused on enhancing data acquisition speed, accuracy, and analytical capabilities. Advancements include AI-powered automated feature extraction from point clouds, real-time 3D reconstruction for dynamic environments, and the development of lightweight, high-resolution 3D scanners. Software innovations are emphasizing cloud-based collaboration platforms, user-friendly interfaces for complex modelling tasks, and seamless integration with existing digital workflows, such as BIM and GIS. These innovations are driven by the need for creating highly accurate digital twins, enabling more realistic projection mapping, and improving the fidelity of maps and navigation systems. Competitive advantages are being gained through solutions that offer faster processing times, lower operational costs, and specialized functionalities for niche applications within sectors like Defense and Healthcare.
Report Segmentation & Scope
This report meticulously segments the 3D mapping and 3D modelling industry to provide a granular analysis of market dynamics. The segmentation covers:
Type:
- 3D Mapping: This segment encompasses technologies and services for creating digital representations of physical spaces, including LiDAR scanning, photogrammetry, and aerial surveys. The market is projected to reach 65 Billion in 2025, driven by infrastructure and defense applications.
- 3D Modelling: This segment focuses on the creation and manipulation of 3D digital objects and environments, crucial for design, entertainment, and simulation. This segment is estimated at 45 Billion in 2025, with growth fueled by media and automotive sectors.
Application:
- Projection Mapping: This involves projecting digital images onto physical surfaces to create immersive visual experiences. The market is valued at over 15 Billion by 2025.
- Texture Mapping: This refers to the process of applying surface details and patterns to 3D models. This segment is projected to reach 15 Billion in 2025, driven by gaming and media.
- Maps and Navigation: This segment includes the creation and utilization of 3D maps for navigation, urban planning, and location-based services, estimated at 40 Billion in 2025.
- Other Applications: This broad category includes digital twins, industrial design, scientific visualization, and AR/VR content creation, with a combined market size exceeding 30 Billion by 2025.
End-user Vertical:
- Entertainment and Media: Market size of 15 Billion by 2025.
- Automotive: Market size of 12 Billion by 2025.
- Healthcare: Market size of 10 Billion by 2025.
- Building and Construction: Market size of 25 Billion by 2025.
- Defense: Market size of 20 Billion by 2025.
- Transportation: Market size of 18 Billion by 2025.
- Other End-user Verticals: This includes sectors like retail, manufacturing, and energy, projected to contribute over 15 Billion by 2025.
Key Drivers of 3D Mapping and 3D Modelling Industry Growth
The 3D mapping and 3D modelling industry is experiencing robust growth driven by several key factors. Technologically, the rapid advancements in LiDAR, drone technology, photogrammetry, and AI-powered processing are making 3D data acquisition more accessible, efficient, and accurate. Economically, the increasing demand for digital twins and precise geospatial data for infrastructure development, urban planning, and resource management is creating substantial market opportunities. The burgeoning augmented reality (AR) and virtual reality (VR) markets are also significant drivers, necessitating high-fidelity 3D content. Regulatory frameworks encouraging smart city initiatives and the digitalization of industries further bolster growth. Furthermore, the decreasing cost of 3D hardware and software is democratizing access, allowing a wider range of businesses to leverage these powerful tools.
Challenges in the 3D Mapping and 3D Modelling Industry Sector
Despite its strong growth trajectory, the 3D mapping and 3D modelling industry faces several challenges. Data processing and management remain significant hurdles, as 3D datasets can be extremely large and require substantial computational power and specialized expertise. The high initial investment cost for advanced hardware, such as high-resolution scanners and powerful workstations, can be a barrier for smaller enterprises. Ensuring data accuracy and integrity across diverse data sources and environments is also critical. Furthermore, the industry is subject to evolving data privacy regulations and cybersecurity concerns, which can impact the sharing and utilization of sensitive geospatial and 3D model data. The need for a skilled workforce proficient in 3D modelling software and data interpretation presents a continuous challenge for widespread adoption.
Leading Players in the 3D Mapping and 3D Modelling Industry Market
- Airbus Defense and Space
- Cybercity 3D Inc
- ESRI Inc
- Golden Software LLC
- Intermap Technologies
- The Foundry Visionmongers Ltd
- Autodesk Inc
- Topcon Positioning Systems Inc
- Trimble Inc
- Bentley Systems Inc
- Saab AB
Key Developments in 3D Mapping and 3D Modelling Industry Sector
- 2023/2024: Increased integration of AI and machine learning for automated 3D model generation and semantic segmentation from point cloud data.
- 2023: Major advancements in drone-based LiDAR technology leading to higher resolution and faster data acquisition for urban mapping.
- 2022: Significant growth in the adoption of digital twin technology across manufacturing, construction, and smart city initiatives.
- 2022: Enhanced cloud-based collaboration platforms for 3D modeling and geospatial data sharing, improving workflow efficiency.
- 2021: Emergence of real-time 3D reconstruction capabilities for dynamic environments, impacting AR/VR and robotics.
- 2020: Increased investment in 3D mapping for infrastructure inspection and maintenance, particularly in transportation and energy sectors.
- 2019: Further development of photogrammetry software offering improved accuracy and reduced processing times.
Strategic 3D Mapping and 3D Modelling Industry Market Outlook
The strategic outlook for the 3D mapping and 3D modelling industry is exceptionally positive, characterized by sustained innovation and expanding applications. Future growth accelerators include the continued development and integration of AI for intelligent data analysis and automated content creation, leading to greater efficiency and deeper insights. The proliferation of the metaverse and immersive digital experiences will drive demand for highly detailed and interactive 3D environments. The ongoing push for smart cities and sustainable infrastructure will further cement the importance of accurate 3D geospatial data. Strategic opportunities lie in developing integrated solutions that bridge the gap between data acquisition, modelling, analysis, and visualization, offering end-to-end capabilities to diverse industries. Companies that can effectively leverage cloud computing, edge AI, and advanced sensor technologies will be well-positioned to capture significant market share.
3D Mapping and 3D Modelling Industry Segmentation
-
1. Type
- 1.1. 3D Mapping
- 1.2. 3D Modeling
-
2. Application
- 2.1. Projection Mapping
- 2.2. Texture Mapping
- 2.3. Maps and Navigation
- 2.4. Other Applications
-
3. End-user Vertical
- 3.1. Entertainment and Media
- 3.2. Automotive
- 3.3. Healthcare
- 3.4. Building and Construction
- 3.5. Defense
- 3.6. Transportation
- 3.7. Other End-user Verticals
3D Mapping and 3D Modelling Industry Segmentation By Geography
- 1. North America
- 2. Europe
- 3. Asia
- 4. Australia and New Zealand
- 5. Latin America
- 6. Middle East and Africa
3D Mapping and 3D Modelling Industry REPORT HIGHLIGHTS
| Aspects | Details |
|---|---|
| Study Period | 2019-2033 |
| Base Year | 2024 |
| Estimated Year | 2025 |
| Forecast Period | 2025-2033 |
| Historical Period | 2019-2024 |
| Growth Rate | CAGR of 14.67% from 2019-2033 |
| Segmentation |
|
Table of Contents
- 1. Introduction
- 1.1. Research Scope
- 1.2. Market Segmentation
- 1.3. Research Methodology
- 1.4. Definitions and Assumptions
- 2. Executive Summary
- 2.1. Introduction
- 3. Market Dynamics
- 3.1. Introduction
- 3.2. Market Drivers
- 3.2.1 Advent of 3D-enabled Display Devices; Advancement of 3D Scanners
- 3.2.2 3D Sensors
- 3.2.3 and Other Acquisition Devices
- 3.3. Market Restrains
- 3.3.1. High Initial Investments
- 3.4. Market Trends
- 3.4.1. Entertainment and Media Segment would Contribute Significantly to the Market Growth
- 4. Market Factor Analysis
- 4.1. Porters Five Forces
- 4.2. Supply/Value Chain
- 4.3. PESTEL analysis
- 4.4. Market Entropy
- 4.5. Patent/Trademark Analysis
- 5. Global 3D Mapping and 3D Modelling Industry Analysis, Insights and Forecast, 2019-2031
- 5.1. Market Analysis, Insights and Forecast - by Type
- 5.1.1. 3D Mapping
- 5.1.2. 3D Modeling
- 5.2. Market Analysis, Insights and Forecast - by Application
- 5.2.1. Projection Mapping
- 5.2.2. Texture Mapping
- 5.2.3. Maps and Navigation
- 5.2.4. Other Applications
- 5.3. Market Analysis, Insights and Forecast - by End-user Vertical
- 5.3.1. Entertainment and Media
- 5.3.2. Automotive
- 5.3.3. Healthcare
- 5.3.4. Building and Construction
- 5.3.5. Defense
- 5.3.6. Transportation
- 5.3.7. Other End-user Verticals
- 5.4. Market Analysis, Insights and Forecast - by Region
- 5.4.1. North America
- 5.4.2. Europe
- 5.4.3. Asia
- 5.4.4. Australia and New Zealand
- 5.4.5. Latin America
- 5.4.6. Middle East and Africa
- 5.1. Market Analysis, Insights and Forecast - by Type
- 6. North America 3D Mapping and 3D Modelling Industry Analysis, Insights and Forecast, 2019-2031
- 6.1. Market Analysis, Insights and Forecast - by Type
- 6.1.1. 3D Mapping
- 6.1.2. 3D Modeling
- 6.2. Market Analysis, Insights and Forecast - by Application
- 6.2.1. Projection Mapping
- 6.2.2. Texture Mapping
- 6.2.3. Maps and Navigation
- 6.2.4. Other Applications
- 6.3. Market Analysis, Insights and Forecast - by End-user Vertical
- 6.3.1. Entertainment and Media
- 6.3.2. Automotive
- 6.3.3. Healthcare
- 6.3.4. Building and Construction
- 6.3.5. Defense
- 6.3.6. Transportation
- 6.3.7. Other End-user Verticals
- 6.1. Market Analysis, Insights and Forecast - by Type
- 7. Europe 3D Mapping and 3D Modelling Industry Analysis, Insights and Forecast, 2019-2031
- 7.1. Market Analysis, Insights and Forecast - by Type
- 7.1.1. 3D Mapping
- 7.1.2. 3D Modeling
- 7.2. Market Analysis, Insights and Forecast - by Application
- 7.2.1. Projection Mapping
- 7.2.2. Texture Mapping
- 7.2.3. Maps and Navigation
- 7.2.4. Other Applications
- 7.3. Market Analysis, Insights and Forecast - by End-user Vertical
- 7.3.1. Entertainment and Media
- 7.3.2. Automotive
- 7.3.3. Healthcare
- 7.3.4. Building and Construction
- 7.3.5. Defense
- 7.3.6. Transportation
- 7.3.7. Other End-user Verticals
- 7.1. Market Analysis, Insights and Forecast - by Type
- 8. Asia 3D Mapping and 3D Modelling Industry Analysis, Insights and Forecast, 2019-2031
- 8.1. Market Analysis, Insights and Forecast - by Type
- 8.1.1. 3D Mapping
- 8.1.2. 3D Modeling
- 8.2. Market Analysis, Insights and Forecast - by Application
- 8.2.1. Projection Mapping
- 8.2.2. Texture Mapping
- 8.2.3. Maps and Navigation
- 8.2.4. Other Applications
- 8.3. Market Analysis, Insights and Forecast - by End-user Vertical
- 8.3.1. Entertainment and Media
- 8.3.2. Automotive
- 8.3.3. Healthcare
- 8.3.4. Building and Construction
- 8.3.5. Defense
- 8.3.6. Transportation
- 8.3.7. Other End-user Verticals
- 8.1. Market Analysis, Insights and Forecast - by Type
- 9. Australia and New Zealand 3D Mapping and 3D Modelling Industry Analysis, Insights and Forecast, 2019-2031
- 9.1. Market Analysis, Insights and Forecast - by Type
- 9.1.1. 3D Mapping
- 9.1.2. 3D Modeling
- 9.2. Market Analysis, Insights and Forecast - by Application
- 9.2.1. Projection Mapping
- 9.2.2. Texture Mapping
- 9.2.3. Maps and Navigation
- 9.2.4. Other Applications
- 9.3. Market Analysis, Insights and Forecast - by End-user Vertical
- 9.3.1. Entertainment and Media
- 9.3.2. Automotive
- 9.3.3. Healthcare
- 9.3.4. Building and Construction
- 9.3.5. Defense
- 9.3.6. Transportation
- 9.3.7. Other End-user Verticals
- 9.1. Market Analysis, Insights and Forecast - by Type
- 10. Latin America 3D Mapping and 3D Modelling Industry Analysis, Insights and Forecast, 2019-2031
- 10.1. Market Analysis, Insights and Forecast - by Type
- 10.1.1. 3D Mapping
- 10.1.2. 3D Modeling
- 10.2. Market Analysis, Insights and Forecast - by Application
- 10.2.1. Projection Mapping
- 10.2.2. Texture Mapping
- 10.2.3. Maps and Navigation
- 10.2.4. Other Applications
- 10.3. Market Analysis, Insights and Forecast - by End-user Vertical
- 10.3.1. Entertainment and Media
- 10.3.2. Automotive
- 10.3.3. Healthcare
- 10.3.4. Building and Construction
- 10.3.5. Defense
- 10.3.6. Transportation
- 10.3.7. Other End-user Verticals
- 10.1. Market Analysis, Insights and Forecast - by Type
- 11. Middle East and Africa 3D Mapping and 3D Modelling Industry Analysis, Insights and Forecast, 2019-2031
- 11.1. Market Analysis, Insights and Forecast - by Type
- 11.1.1. 3D Mapping
- 11.1.2. 3D Modeling
- 11.2. Market Analysis, Insights and Forecast - by Application
- 11.2.1. Projection Mapping
- 11.2.2. Texture Mapping
- 11.2.3. Maps and Navigation
- 11.2.4. Other Applications
- 11.3. Market Analysis, Insights and Forecast - by End-user Vertical
- 11.3.1. Entertainment and Media
- 11.3.2. Automotive
- 11.3.3. Healthcare
- 11.3.4. Building and Construction
- 11.3.5. Defense
- 11.3.6. Transportation
- 11.3.7. Other End-user Verticals
- 11.1. Market Analysis, Insights and Forecast - by Type
- 12. North America 3D Mapping and 3D Modelling Industry Analysis, Insights and Forecast, 2019-2031
- 12.1. Market Analysis, Insights and Forecast - By Country/Sub-region
- 12.1.1 United States
- 12.1.2 Canada
- 12.1.3 Mexico
- 13. Europe 3D Mapping and 3D Modelling Industry Analysis, Insights and Forecast, 2019-2031
- 13.1. Market Analysis, Insights and Forecast - By Country/Sub-region
- 13.1.1 Germany
- 13.1.2 United Kingdom
- 13.1.3 France
- 13.1.4 Spain
- 13.1.5 Italy
- 13.1.6 Spain
- 13.1.7 Belgium
- 13.1.8 Netherland
- 13.1.9 Nordics
- 13.1.10 Rest of Europe
- 14. Asia Pacific 3D Mapping and 3D Modelling Industry Analysis, Insights and Forecast, 2019-2031
- 14.1. Market Analysis, Insights and Forecast - By Country/Sub-region
- 14.1.1 China
- 14.1.2 Japan
- 14.1.3 India
- 14.1.4 South Korea
- 14.1.5 Southeast Asia
- 14.1.6 Australia
- 14.1.7 Indonesia
- 14.1.8 Phillipes
- 14.1.9 Singapore
- 14.1.10 Thailandc
- 14.1.11 Rest of Asia Pacific
- 15. South America 3D Mapping and 3D Modelling Industry Analysis, Insights and Forecast, 2019-2031
- 15.1. Market Analysis, Insights and Forecast - By Country/Sub-region
- 15.1.1 Brazil
- 15.1.2 Argentina
- 15.1.3 Peru
- 15.1.4 Chile
- 15.1.5 Colombia
- 15.1.6 Ecuador
- 15.1.7 Venezuela
- 15.1.8 Rest of South America
- 16. North America 3D Mapping and 3D Modelling Industry Analysis, Insights and Forecast, 2019-2031
- 16.1. Market Analysis, Insights and Forecast - By Country/Sub-region
- 16.1.1 United States
- 16.1.2 Canada
- 16.1.3 Mexico
- 17. MEA 3D Mapping and 3D Modelling Industry Analysis, Insights and Forecast, 2019-2031
- 17.1. Market Analysis, Insights and Forecast - By Country/Sub-region
- 17.1.1 United Arab Emirates
- 17.1.2 Saudi Arabia
- 17.1.3 South Africa
- 17.1.4 Rest of Middle East and Africa
- 18. Competitive Analysis
- 18.1. Global Market Share Analysis 2024
- 18.2. Company Profiles
- 18.2.1 Airbus Defense and Space
- 18.2.1.1. Overview
- 18.2.1.2. Products
- 18.2.1.3. SWOT Analysis
- 18.2.1.4. Recent Developments
- 18.2.1.5. Financials (Based on Availability)
- 18.2.2 Cybercity 3D Inc
- 18.2.2.1. Overview
- 18.2.2.2. Products
- 18.2.2.3. SWOT Analysis
- 18.2.2.4. Recent Developments
- 18.2.2.5. Financials (Based on Availability)
- 18.2.3 ESRI Inc
- 18.2.3.1. Overview
- 18.2.3.2. Products
- 18.2.3.3. SWOT Analysis
- 18.2.3.4. Recent Developments
- 18.2.3.5. Financials (Based on Availability)
- 18.2.4 Golden Software LLC
- 18.2.4.1. Overview
- 18.2.4.2. Products
- 18.2.4.3. SWOT Analysis
- 18.2.4.4. Recent Developments
- 18.2.4.5. Financials (Based on Availability)
- 18.2.5 Intermap Technologies
- 18.2.5.1. Overview
- 18.2.5.2. Products
- 18.2.5.3. SWOT Analysis
- 18.2.5.4. Recent Developments
- 18.2.5.5. Financials (Based on Availability)
- 18.2.6 The Foundry Visionmongers Ltd
- 18.2.6.1. Overview
- 18.2.6.2. Products
- 18.2.6.3. SWOT Analysis
- 18.2.6.4. Recent Developments
- 18.2.6.5. Financials (Based on Availability)
- 18.2.7 Autodesk Inc
- 18.2.7.1. Overview
- 18.2.7.2. Products
- 18.2.7.3. SWOT Analysis
- 18.2.7.4. Recent Developments
- 18.2.7.5. Financials (Based on Availability)
- 18.2.8 Topcon Positioning Systems Inc
- 18.2.8.1. Overview
- 18.2.8.2. Products
- 18.2.8.3. SWOT Analysis
- 18.2.8.4. Recent Developments
- 18.2.8.5. Financials (Based on Availability)
- 18.2.9 Trimble Inc
- 18.2.9.1. Overview
- 18.2.9.2. Products
- 18.2.9.3. SWOT Analysis
- 18.2.9.4. Recent Developments
- 18.2.9.5. Financials (Based on Availability)
- 18.2.10 Bentley Systems Inc
- 18.2.10.1. Overview
- 18.2.10.2. Products
- 18.2.10.3. SWOT Analysis
- 18.2.10.4. Recent Developments
- 18.2.10.5. Financials (Based on Availability)
- 18.2.11 Saab AB
- 18.2.11.1. Overview
- 18.2.11.2. Products
- 18.2.11.3. SWOT Analysis
- 18.2.11.4. Recent Developments
- 18.2.11.5. Financials (Based on Availability)
- 18.2.1 Airbus Defense and Space
List of Figures
- Figure 1: Global 3D Mapping and 3D Modelling Industry Revenue Breakdown (Million, %) by Region 2024 & 2032
- Figure 2: Global 3D Mapping and 3D Modelling Industry Volume Breakdown (K Unit, %) by Region 2024 & 2032
- Figure 3: North America 3D Mapping and 3D Modelling Industry Revenue (Million), by Country 2024 & 2032
- Figure 4: North America 3D Mapping and 3D Modelling Industry Volume (K Unit), by Country 2024 & 2032
- Figure 5: North America 3D Mapping and 3D Modelling Industry Revenue Share (%), by Country 2024 & 2032
- Figure 6: North America 3D Mapping and 3D Modelling Industry Volume Share (%), by Country 2024 & 2032
- Figure 7: Europe 3D Mapping and 3D Modelling Industry Revenue (Million), by Country 2024 & 2032
- Figure 8: Europe 3D Mapping and 3D Modelling Industry Volume (K Unit), by Country 2024 & 2032
- Figure 9: Europe 3D Mapping and 3D Modelling Industry Revenue Share (%), by Country 2024 & 2032
- Figure 10: Europe 3D Mapping and 3D Modelling Industry Volume Share (%), by Country 2024 & 2032
- Figure 11: Asia Pacific 3D Mapping and 3D Modelling Industry Revenue (Million), by Country 2024 & 2032
- Figure 12: Asia Pacific 3D Mapping and 3D Modelling Industry Volume (K Unit), by Country 2024 & 2032
- Figure 13: Asia Pacific 3D Mapping and 3D Modelling Industry Revenue Share (%), by Country 2024 & 2032
- Figure 14: Asia Pacific 3D Mapping and 3D Modelling Industry Volume Share (%), by Country 2024 & 2032
- Figure 15: South America 3D Mapping and 3D Modelling Industry Revenue (Million), by Country 2024 & 2032
- Figure 16: South America 3D Mapping and 3D Modelling Industry Volume (K Unit), by Country 2024 & 2032
- Figure 17: South America 3D Mapping and 3D Modelling Industry Revenue Share (%), by Country 2024 & 2032
- Figure 18: South America 3D Mapping and 3D Modelling Industry Volume Share (%), by Country 2024 & 2032
- Figure 19: North America 3D Mapping and 3D Modelling Industry Revenue (Million), by Country 2024 & 2032
- Figure 20: North America 3D Mapping and 3D Modelling Industry Volume (K Unit), by Country 2024 & 2032
- Figure 21: North America 3D Mapping and 3D Modelling Industry Revenue Share (%), by Country 2024 & 2032
- Figure 22: North America 3D Mapping and 3D Modelling Industry Volume Share (%), by Country 2024 & 2032
- Figure 23: MEA 3D Mapping and 3D Modelling Industry Revenue (Million), by Country 2024 & 2032
- Figure 24: MEA 3D Mapping and 3D Modelling Industry Volume (K Unit), by Country 2024 & 2032
- Figure 25: MEA 3D Mapping and 3D Modelling Industry Revenue Share (%), by Country 2024 & 2032
- Figure 26: MEA 3D Mapping and 3D Modelling Industry Volume Share (%), by Country 2024 & 2032
- Figure 27: North America 3D Mapping and 3D Modelling Industry Revenue (Million), by Type 2024 & 2032
- Figure 28: North America 3D Mapping and 3D Modelling Industry Volume (K Unit), by Type 2024 & 2032
- Figure 29: North America 3D Mapping and 3D Modelling Industry Revenue Share (%), by Type 2024 & 2032
- Figure 30: North America 3D Mapping and 3D Modelling Industry Volume Share (%), by Type 2024 & 2032
- Figure 31: North America 3D Mapping and 3D Modelling Industry Revenue (Million), by Application 2024 & 2032
- Figure 32: North America 3D Mapping and 3D Modelling Industry Volume (K Unit), by Application 2024 & 2032
- Figure 33: North America 3D Mapping and 3D Modelling Industry Revenue Share (%), by Application 2024 & 2032
- Figure 34: North America 3D Mapping and 3D Modelling Industry Volume Share (%), by Application 2024 & 2032
- Figure 35: North America 3D Mapping and 3D Modelling Industry Revenue (Million), by End-user Vertical 2024 & 2032
- Figure 36: North America 3D Mapping and 3D Modelling Industry Volume (K Unit), by End-user Vertical 2024 & 2032
- Figure 37: North America 3D Mapping and 3D Modelling Industry Revenue Share (%), by End-user Vertical 2024 & 2032
- Figure 38: North America 3D Mapping and 3D Modelling Industry Volume Share (%), by End-user Vertical 2024 & 2032
- Figure 39: North America 3D Mapping and 3D Modelling Industry Revenue (Million), by Country 2024 & 2032
- Figure 40: North America 3D Mapping and 3D Modelling Industry Volume (K Unit), by Country 2024 & 2032
- Figure 41: North America 3D Mapping and 3D Modelling Industry Revenue Share (%), by Country 2024 & 2032
- Figure 42: North America 3D Mapping and 3D Modelling Industry Volume Share (%), by Country 2024 & 2032
- Figure 43: Europe 3D Mapping and 3D Modelling Industry Revenue (Million), by Type 2024 & 2032
- Figure 44: Europe 3D Mapping and 3D Modelling Industry Volume (K Unit), by Type 2024 & 2032
- Figure 45: Europe 3D Mapping and 3D Modelling Industry Revenue Share (%), by Type 2024 & 2032
- Figure 46: Europe 3D Mapping and 3D Modelling Industry Volume Share (%), by Type 2024 & 2032
- Figure 47: Europe 3D Mapping and 3D Modelling Industry Revenue (Million), by Application 2024 & 2032
- Figure 48: Europe 3D Mapping and 3D Modelling Industry Volume (K Unit), by Application 2024 & 2032
- Figure 49: Europe 3D Mapping and 3D Modelling Industry Revenue Share (%), by Application 2024 & 2032
- Figure 50: Europe 3D Mapping and 3D Modelling Industry Volume Share (%), by Application 2024 & 2032
- Figure 51: Europe 3D Mapping and 3D Modelling Industry Revenue (Million), by End-user Vertical 2024 & 2032
- Figure 52: Europe 3D Mapping and 3D Modelling Industry Volume (K Unit), by End-user Vertical 2024 & 2032
- Figure 53: Europe 3D Mapping and 3D Modelling Industry Revenue Share (%), by End-user Vertical 2024 & 2032
- Figure 54: Europe 3D Mapping and 3D Modelling Industry Volume Share (%), by End-user Vertical 2024 & 2032
- Figure 55: Europe 3D Mapping and 3D Modelling Industry Revenue (Million), by Country 2024 & 2032
- Figure 56: Europe 3D Mapping and 3D Modelling Industry Volume (K Unit), by Country 2024 & 2032
- Figure 57: Europe 3D Mapping and 3D Modelling Industry Revenue Share (%), by Country 2024 & 2032
- Figure 58: Europe 3D Mapping and 3D Modelling Industry Volume Share (%), by Country 2024 & 2032
- Figure 59: Asia 3D Mapping and 3D Modelling Industry Revenue (Million), by Type 2024 & 2032
- Figure 60: Asia 3D Mapping and 3D Modelling Industry Volume (K Unit), by Type 2024 & 2032
- Figure 61: Asia 3D Mapping and 3D Modelling Industry Revenue Share (%), by Type 2024 & 2032
- Figure 62: Asia 3D Mapping and 3D Modelling Industry Volume Share (%), by Type 2024 & 2032
- Figure 63: Asia 3D Mapping and 3D Modelling Industry Revenue (Million), by Application 2024 & 2032
- Figure 64: Asia 3D Mapping and 3D Modelling Industry Volume (K Unit), by Application 2024 & 2032
- Figure 65: Asia 3D Mapping and 3D Modelling Industry Revenue Share (%), by Application 2024 & 2032
- Figure 66: Asia 3D Mapping and 3D Modelling Industry Volume Share (%), by Application 2024 & 2032
- Figure 67: Asia 3D Mapping and 3D Modelling Industry Revenue (Million), by End-user Vertical 2024 & 2032
- Figure 68: Asia 3D Mapping and 3D Modelling Industry Volume (K Unit), by End-user Vertical 2024 & 2032
- Figure 69: Asia 3D Mapping and 3D Modelling Industry Revenue Share (%), by End-user Vertical 2024 & 2032
- Figure 70: Asia 3D Mapping and 3D Modelling Industry Volume Share (%), by End-user Vertical 2024 & 2032
- Figure 71: Asia 3D Mapping and 3D Modelling Industry Revenue (Million), by Country 2024 & 2032
- Figure 72: Asia 3D Mapping and 3D Modelling Industry Volume (K Unit), by Country 2024 & 2032
- Figure 73: Asia 3D Mapping and 3D Modelling Industry Revenue Share (%), by Country 2024 & 2032
- Figure 74: Asia 3D Mapping and 3D Modelling Industry Volume Share (%), by Country 2024 & 2032
- Figure 75: Australia and New Zealand 3D Mapping and 3D Modelling Industry Revenue (Million), by Type 2024 & 2032
- Figure 76: Australia and New Zealand 3D Mapping and 3D Modelling Industry Volume (K Unit), by Type 2024 & 2032
- Figure 77: Australia and New Zealand 3D Mapping and 3D Modelling Industry Revenue Share (%), by Type 2024 & 2032
- Figure 78: Australia and New Zealand 3D Mapping and 3D Modelling Industry Volume Share (%), by Type 2024 & 2032
- Figure 79: Australia and New Zealand 3D Mapping and 3D Modelling Industry Revenue (Million), by Application 2024 & 2032
- Figure 80: Australia and New Zealand 3D Mapping and 3D Modelling Industry Volume (K Unit), by Application 2024 & 2032
- Figure 81: Australia and New Zealand 3D Mapping and 3D Modelling Industry Revenue Share (%), by Application 2024 & 2032
- Figure 82: Australia and New Zealand 3D Mapping and 3D Modelling Industry Volume Share (%), by Application 2024 & 2032
- Figure 83: Australia and New Zealand 3D Mapping and 3D Modelling Industry Revenue (Million), by End-user Vertical 2024 & 2032
- Figure 84: Australia and New Zealand 3D Mapping and 3D Modelling Industry Volume (K Unit), by End-user Vertical 2024 & 2032
- Figure 85: Australia and New Zealand 3D Mapping and 3D Modelling Industry Revenue Share (%), by End-user Vertical 2024 & 2032
- Figure 86: Australia and New Zealand 3D Mapping and 3D Modelling Industry Volume Share (%), by End-user Vertical 2024 & 2032
- Figure 87: Australia and New Zealand 3D Mapping and 3D Modelling Industry Revenue (Million), by Country 2024 & 2032
- Figure 88: Australia and New Zealand 3D Mapping and 3D Modelling Industry Volume (K Unit), by Country 2024 & 2032
- Figure 89: Australia and New Zealand 3D Mapping and 3D Modelling Industry Revenue Share (%), by Country 2024 & 2032
- Figure 90: Australia and New Zealand 3D Mapping and 3D Modelling Industry Volume Share (%), by Country 2024 & 2032
- Figure 91: Latin America 3D Mapping and 3D Modelling Industry Revenue (Million), by Type 2024 & 2032
- Figure 92: Latin America 3D Mapping and 3D Modelling Industry Volume (K Unit), by Type 2024 & 2032
- Figure 93: Latin America 3D Mapping and 3D Modelling Industry Revenue Share (%), by Type 2024 & 2032
- Figure 94: Latin America 3D Mapping and 3D Modelling Industry Volume Share (%), by Type 2024 & 2032
- Figure 95: Latin America 3D Mapping and 3D Modelling Industry Revenue (Million), by Application 2024 & 2032
- Figure 96: Latin America 3D Mapping and 3D Modelling Industry Volume (K Unit), by Application 2024 & 2032
- Figure 97: Latin America 3D Mapping and 3D Modelling Industry Revenue Share (%), by Application 2024 & 2032
- Figure 98: Latin America 3D Mapping and 3D Modelling Industry Volume Share (%), by Application 2024 & 2032
- Figure 99: Latin America 3D Mapping and 3D Modelling Industry Revenue (Million), by End-user Vertical 2024 & 2032
- Figure 100: Latin America 3D Mapping and 3D Modelling Industry Volume (K Unit), by End-user Vertical 2024 & 2032
- Figure 101: Latin America 3D Mapping and 3D Modelling Industry Revenue Share (%), by End-user Vertical 2024 & 2032
- Figure 102: Latin America 3D Mapping and 3D Modelling Industry Volume Share (%), by End-user Vertical 2024 & 2032
- Figure 103: Latin America 3D Mapping and 3D Modelling Industry Revenue (Million), by Country 2024 & 2032
- Figure 104: Latin America 3D Mapping and 3D Modelling Industry Volume (K Unit), by Country 2024 & 2032
- Figure 105: Latin America 3D Mapping and 3D Modelling Industry Revenue Share (%), by Country 2024 & 2032
- Figure 106: Latin America 3D Mapping and 3D Modelling Industry Volume Share (%), by Country 2024 & 2032
- Figure 107: Middle East and Africa 3D Mapping and 3D Modelling Industry Revenue (Million), by Type 2024 & 2032
- Figure 108: Middle East and Africa 3D Mapping and 3D Modelling Industry Volume (K Unit), by Type 2024 & 2032
- Figure 109: Middle East and Africa 3D Mapping and 3D Modelling Industry Revenue Share (%), by Type 2024 & 2032
- Figure 110: Middle East and Africa 3D Mapping and 3D Modelling Industry Volume Share (%), by Type 2024 & 2032
- Figure 111: Middle East and Africa 3D Mapping and 3D Modelling Industry Revenue (Million), by Application 2024 & 2032
- Figure 112: Middle East and Africa 3D Mapping and 3D Modelling Industry Volume (K Unit), by Application 2024 & 2032
- Figure 113: Middle East and Africa 3D Mapping and 3D Modelling Industry Revenue Share (%), by Application 2024 & 2032
- Figure 114: Middle East and Africa 3D Mapping and 3D Modelling Industry Volume Share (%), by Application 2024 & 2032
- Figure 115: Middle East and Africa 3D Mapping and 3D Modelling Industry Revenue (Million), by End-user Vertical 2024 & 2032
- Figure 116: Middle East and Africa 3D Mapping and 3D Modelling Industry Volume (K Unit), by End-user Vertical 2024 & 2032
- Figure 117: Middle East and Africa 3D Mapping and 3D Modelling Industry Revenue Share (%), by End-user Vertical 2024 & 2032
- Figure 118: Middle East and Africa 3D Mapping and 3D Modelling Industry Volume Share (%), by End-user Vertical 2024 & 2032
- Figure 119: Middle East and Africa 3D Mapping and 3D Modelling Industry Revenue (Million), by Country 2024 & 2032
- Figure 120: Middle East and Africa 3D Mapping and 3D Modelling Industry Volume (K Unit), by Country 2024 & 2032
- Figure 121: Middle East and Africa 3D Mapping and 3D Modelling Industry Revenue Share (%), by Country 2024 & 2032
- Figure 122: Middle East and Africa 3D Mapping and 3D Modelling Industry Volume Share (%), by Country 2024 & 2032
List of Tables
- Table 1: Global 3D Mapping and 3D Modelling Industry Revenue Million Forecast, by Region 2019 & 2032
- Table 2: Global 3D Mapping and 3D Modelling Industry Volume K Unit Forecast, by Region 2019 & 2032
- Table 3: Global 3D Mapping and 3D Modelling Industry Revenue Million Forecast, by Type 2019 & 2032
- Table 4: Global 3D Mapping and 3D Modelling Industry Volume K Unit Forecast, by Type 2019 & 2032
- Table 5: Global 3D Mapping and 3D Modelling Industry Revenue Million Forecast, by Application 2019 & 2032
- Table 6: Global 3D Mapping and 3D Modelling Industry Volume K Unit Forecast, by Application 2019 & 2032
- Table 7: Global 3D Mapping and 3D Modelling Industry Revenue Million Forecast, by End-user Vertical 2019 & 2032
- Table 8: Global 3D Mapping and 3D Modelling Industry Volume K Unit Forecast, by End-user Vertical 2019 & 2032
- Table 9: Global 3D Mapping and 3D Modelling Industry Revenue Million Forecast, by Region 2019 & 2032
- Table 10: Global 3D Mapping and 3D Modelling Industry Volume K Unit Forecast, by Region 2019 & 2032
- Table 11: Global 3D Mapping and 3D Modelling Industry Revenue Million Forecast, by Country 2019 & 2032
- Table 12: Global 3D Mapping and 3D Modelling Industry Volume K Unit Forecast, by Country 2019 & 2032
- Table 13: United States 3D Mapping and 3D Modelling Industry Revenue (Million) Forecast, by Application 2019 & 2032
- Table 14: United States 3D Mapping and 3D Modelling Industry Volume (K Unit) Forecast, by Application 2019 & 2032
- Table 15: Canada 3D Mapping and 3D Modelling Industry Revenue (Million) Forecast, by Application 2019 & 2032
- Table 16: Canada 3D Mapping and 3D Modelling Industry Volume (K Unit) Forecast, by Application 2019 & 2032
- Table 17: Mexico 3D Mapping and 3D Modelling Industry Revenue (Million) Forecast, by Application 2019 & 2032
- Table 18: Mexico 3D Mapping and 3D Modelling Industry Volume (K Unit) Forecast, by Application 2019 & 2032
- Table 19: Global 3D Mapping and 3D Modelling Industry Revenue Million Forecast, by Country 2019 & 2032
- Table 20: Global 3D Mapping and 3D Modelling Industry Volume K Unit Forecast, by Country 2019 & 2032
- Table 21: Germany 3D Mapping and 3D Modelling Industry Revenue (Million) Forecast, by Application 2019 & 2032
- Table 22: Germany 3D Mapping and 3D Modelling Industry Volume (K Unit) Forecast, by Application 2019 & 2032
- Table 23: United Kingdom 3D Mapping and 3D Modelling Industry Revenue (Million) Forecast, by Application 2019 & 2032
- Table 24: United Kingdom 3D Mapping and 3D Modelling Industry Volume (K Unit) Forecast, by Application 2019 & 2032
- Table 25: France 3D Mapping and 3D Modelling Industry Revenue (Million) Forecast, by Application 2019 & 2032
- Table 26: France 3D Mapping and 3D Modelling Industry Volume (K Unit) Forecast, by Application 2019 & 2032
- Table 27: Spain 3D Mapping and 3D Modelling Industry Revenue (Million) Forecast, by Application 2019 & 2032
- Table 28: Spain 3D Mapping and 3D Modelling Industry Volume (K Unit) Forecast, by Application 2019 & 2032
- Table 29: Italy 3D Mapping and 3D Modelling Industry Revenue (Million) Forecast, by Application 2019 & 2032
- Table 30: Italy 3D Mapping and 3D Modelling Industry Volume (K Unit) Forecast, by Application 2019 & 2032
- Table 31: Spain 3D Mapping and 3D Modelling Industry Revenue (Million) Forecast, by Application 2019 & 2032
- Table 32: Spain 3D Mapping and 3D Modelling Industry Volume (K Unit) Forecast, by Application 2019 & 2032
- Table 33: Belgium 3D Mapping and 3D Modelling Industry Revenue (Million) Forecast, by Application 2019 & 2032
- Table 34: Belgium 3D Mapping and 3D Modelling Industry Volume (K Unit) Forecast, by Application 2019 & 2032
- Table 35: Netherland 3D Mapping and 3D Modelling Industry Revenue (Million) Forecast, by Application 2019 & 2032
- Table 36: Netherland 3D Mapping and 3D Modelling Industry Volume (K Unit) Forecast, by Application 2019 & 2032
- Table 37: Nordics 3D Mapping and 3D Modelling Industry Revenue (Million) Forecast, by Application 2019 & 2032
- Table 38: Nordics 3D Mapping and 3D Modelling Industry Volume (K Unit) Forecast, by Application 2019 & 2032
- Table 39: Rest of Europe 3D Mapping and 3D Modelling Industry Revenue (Million) Forecast, by Application 2019 & 2032
- Table 40: Rest of Europe 3D Mapping and 3D Modelling Industry Volume (K Unit) Forecast, by Application 2019 & 2032
- Table 41: Global 3D Mapping and 3D Modelling Industry Revenue Million Forecast, by Country 2019 & 2032
- Table 42: Global 3D Mapping and 3D Modelling Industry Volume K Unit Forecast, by Country 2019 & 2032
- Table 43: China 3D Mapping and 3D Modelling Industry Revenue (Million) Forecast, by Application 2019 & 2032
- Table 44: China 3D Mapping and 3D Modelling Industry Volume (K Unit) Forecast, by Application 2019 & 2032
- Table 45: Japan 3D Mapping and 3D Modelling Industry Revenue (Million) Forecast, by Application 2019 & 2032
- Table 46: Japan 3D Mapping and 3D Modelling Industry Volume (K Unit) Forecast, by Application 2019 & 2032
- Table 47: India 3D Mapping and 3D Modelling Industry Revenue (Million) Forecast, by Application 2019 & 2032
- Table 48: India 3D Mapping and 3D Modelling Industry Volume (K Unit) Forecast, by Application 2019 & 2032
- Table 49: South Korea 3D Mapping and 3D Modelling Industry Revenue (Million) Forecast, by Application 2019 & 2032
- Table 50: South Korea 3D Mapping and 3D Modelling Industry Volume (K Unit) Forecast, by Application 2019 & 2032
- Table 51: Southeast Asia 3D Mapping and 3D Modelling Industry Revenue (Million) Forecast, by Application 2019 & 2032
- Table 52: Southeast Asia 3D Mapping and 3D Modelling Industry Volume (K Unit) Forecast, by Application 2019 & 2032
- Table 53: Australia 3D Mapping and 3D Modelling Industry Revenue (Million) Forecast, by Application 2019 & 2032
- Table 54: Australia 3D Mapping and 3D Modelling Industry Volume (K Unit) Forecast, by Application 2019 & 2032
- Table 55: Indonesia 3D Mapping and 3D Modelling Industry Revenue (Million) Forecast, by Application 2019 & 2032
- Table 56: Indonesia 3D Mapping and 3D Modelling Industry Volume (K Unit) Forecast, by Application 2019 & 2032
- Table 57: Phillipes 3D Mapping and 3D Modelling Industry Revenue (Million) Forecast, by Application 2019 & 2032
- Table 58: Phillipes 3D Mapping and 3D Modelling Industry Volume (K Unit) Forecast, by Application 2019 & 2032
- Table 59: Singapore 3D Mapping and 3D Modelling Industry Revenue (Million) Forecast, by Application 2019 & 2032
- Table 60: Singapore 3D Mapping and 3D Modelling Industry Volume (K Unit) Forecast, by Application 2019 & 2032
- Table 61: Thailandc 3D Mapping and 3D Modelling Industry Revenue (Million) Forecast, by Application 2019 & 2032
- Table 62: Thailandc 3D Mapping and 3D Modelling Industry Volume (K Unit) Forecast, by Application 2019 & 2032
- Table 63: Rest of Asia Pacific 3D Mapping and 3D Modelling Industry Revenue (Million) Forecast, by Application 2019 & 2032
- Table 64: Rest of Asia Pacific 3D Mapping and 3D Modelling Industry Volume (K Unit) Forecast, by Application 2019 & 2032
- Table 65: Global 3D Mapping and 3D Modelling Industry Revenue Million Forecast, by Country 2019 & 2032
- Table 66: Global 3D Mapping and 3D Modelling Industry Volume K Unit Forecast, by Country 2019 & 2032
- Table 67: Brazil 3D Mapping and 3D Modelling Industry Revenue (Million) Forecast, by Application 2019 & 2032
- Table 68: Brazil 3D Mapping and 3D Modelling Industry Volume (K Unit) Forecast, by Application 2019 & 2032
- Table 69: Argentina 3D Mapping and 3D Modelling Industry Revenue (Million) Forecast, by Application 2019 & 2032
- Table 70: Argentina 3D Mapping and 3D Modelling Industry Volume (K Unit) Forecast, by Application 2019 & 2032
- Table 71: Peru 3D Mapping and 3D Modelling Industry Revenue (Million) Forecast, by Application 2019 & 2032
- Table 72: Peru 3D Mapping and 3D Modelling Industry Volume (K Unit) Forecast, by Application 2019 & 2032
- Table 73: Chile 3D Mapping and 3D Modelling Industry Revenue (Million) Forecast, by Application 2019 & 2032
- Table 74: Chile 3D Mapping and 3D Modelling Industry Volume (K Unit) Forecast, by Application 2019 & 2032
- Table 75: Colombia 3D Mapping and 3D Modelling Industry Revenue (Million) Forecast, by Application 2019 & 2032
- Table 76: Colombia 3D Mapping and 3D Modelling Industry Volume (K Unit) Forecast, by Application 2019 & 2032
- Table 77: Ecuador 3D Mapping and 3D Modelling Industry Revenue (Million) Forecast, by Application 2019 & 2032
- Table 78: Ecuador 3D Mapping and 3D Modelling Industry Volume (K Unit) Forecast, by Application 2019 & 2032
- Table 79: Venezuela 3D Mapping and 3D Modelling Industry Revenue (Million) Forecast, by Application 2019 & 2032
- Table 80: Venezuela 3D Mapping and 3D Modelling Industry Volume (K Unit) Forecast, by Application 2019 & 2032
- Table 81: Rest of South America 3D Mapping and 3D Modelling Industry Revenue (Million) Forecast, by Application 2019 & 2032
- Table 82: Rest of South America 3D Mapping and 3D Modelling Industry Volume (K Unit) Forecast, by Application 2019 & 2032
- Table 83: Global 3D Mapping and 3D Modelling Industry Revenue Million Forecast, by Country 2019 & 2032
- Table 84: Global 3D Mapping and 3D Modelling Industry Volume K Unit Forecast, by Country 2019 & 2032
- Table 85: United States 3D Mapping and 3D Modelling Industry Revenue (Million) Forecast, by Application 2019 & 2032
- Table 86: United States 3D Mapping and 3D Modelling Industry Volume (K Unit) Forecast, by Application 2019 & 2032
- Table 87: Canada 3D Mapping and 3D Modelling Industry Revenue (Million) Forecast, by Application 2019 & 2032
- Table 88: Canada 3D Mapping and 3D Modelling Industry Volume (K Unit) Forecast, by Application 2019 & 2032
- Table 89: Mexico 3D Mapping and 3D Modelling Industry Revenue (Million) Forecast, by Application 2019 & 2032
- Table 90: Mexico 3D Mapping and 3D Modelling Industry Volume (K Unit) Forecast, by Application 2019 & 2032
- Table 91: Global 3D Mapping and 3D Modelling Industry Revenue Million Forecast, by Country 2019 & 2032
- Table 92: Global 3D Mapping and 3D Modelling Industry Volume K Unit Forecast, by Country 2019 & 2032
- Table 93: United Arab Emirates 3D Mapping and 3D Modelling Industry Revenue (Million) Forecast, by Application 2019 & 2032
- Table 94: United Arab Emirates 3D Mapping and 3D Modelling Industry Volume (K Unit) Forecast, by Application 2019 & 2032
- Table 95: Saudi Arabia 3D Mapping and 3D Modelling Industry Revenue (Million) Forecast, by Application 2019 & 2032
- Table 96: Saudi Arabia 3D Mapping and 3D Modelling Industry Volume (K Unit) Forecast, by Application 2019 & 2032
- Table 97: South Africa 3D Mapping and 3D Modelling Industry Revenue (Million) Forecast, by Application 2019 & 2032
- Table 98: South Africa 3D Mapping and 3D Modelling Industry Volume (K Unit) Forecast, by Application 2019 & 2032
- Table 99: Rest of Middle East and Africa 3D Mapping and 3D Modelling Industry Revenue (Million) Forecast, by Application 2019 & 2032
- Table 100: Rest of Middle East and Africa 3D Mapping and 3D Modelling Industry Volume (K Unit) Forecast, by Application 2019 & 2032
- Table 101: Global 3D Mapping and 3D Modelling Industry Revenue Million Forecast, by Type 2019 & 2032
- Table 102: Global 3D Mapping and 3D Modelling Industry Volume K Unit Forecast, by Type 2019 & 2032
- Table 103: Global 3D Mapping and 3D Modelling Industry Revenue Million Forecast, by Application 2019 & 2032
- Table 104: Global 3D Mapping and 3D Modelling Industry Volume K Unit Forecast, by Application 2019 & 2032
- Table 105: Global 3D Mapping and 3D Modelling Industry Revenue Million Forecast, by End-user Vertical 2019 & 2032
- Table 106: Global 3D Mapping and 3D Modelling Industry Volume K Unit Forecast, by End-user Vertical 2019 & 2032
- Table 107: Global 3D Mapping and 3D Modelling Industry Revenue Million Forecast, by Country 2019 & 2032
- Table 108: Global 3D Mapping and 3D Modelling Industry Volume K Unit Forecast, by Country 2019 & 2032
- Table 109: Global 3D Mapping and 3D Modelling Industry Revenue Million Forecast, by Type 2019 & 2032
- Table 110: Global 3D Mapping and 3D Modelling Industry Volume K Unit Forecast, by Type 2019 & 2032
- Table 111: Global 3D Mapping and 3D Modelling Industry Revenue Million Forecast, by Application 2019 & 2032
- Table 112: Global 3D Mapping and 3D Modelling Industry Volume K Unit Forecast, by Application 2019 & 2032
- Table 113: Global 3D Mapping and 3D Modelling Industry Revenue Million Forecast, by End-user Vertical 2019 & 2032
- Table 114: Global 3D Mapping and 3D Modelling Industry Volume K Unit Forecast, by End-user Vertical 2019 & 2032
- Table 115: Global 3D Mapping and 3D Modelling Industry Revenue Million Forecast, by Country 2019 & 2032
- Table 116: Global 3D Mapping and 3D Modelling Industry Volume K Unit Forecast, by Country 2019 & 2032
- Table 117: Global 3D Mapping and 3D Modelling Industry Revenue Million Forecast, by Type 2019 & 2032
- Table 118: Global 3D Mapping and 3D Modelling Industry Volume K Unit Forecast, by Type 2019 & 2032
- Table 119: Global 3D Mapping and 3D Modelling Industry Revenue Million Forecast, by Application 2019 & 2032
- Table 120: Global 3D Mapping and 3D Modelling Industry Volume K Unit Forecast, by Application 2019 & 2032
- Table 121: Global 3D Mapping and 3D Modelling Industry Revenue Million Forecast, by End-user Vertical 2019 & 2032
- Table 122: Global 3D Mapping and 3D Modelling Industry Volume K Unit Forecast, by End-user Vertical 2019 & 2032
- Table 123: Global 3D Mapping and 3D Modelling Industry Revenue Million Forecast, by Country 2019 & 2032
- Table 124: Global 3D Mapping and 3D Modelling Industry Volume K Unit Forecast, by Country 2019 & 2032
- Table 125: Global 3D Mapping and 3D Modelling Industry Revenue Million Forecast, by Type 2019 & 2032
- Table 126: Global 3D Mapping and 3D Modelling Industry Volume K Unit Forecast, by Type 2019 & 2032
- Table 127: Global 3D Mapping and 3D Modelling Industry Revenue Million Forecast, by Application 2019 & 2032
- Table 128: Global 3D Mapping and 3D Modelling Industry Volume K Unit Forecast, by Application 2019 & 2032
- Table 129: Global 3D Mapping and 3D Modelling Industry Revenue Million Forecast, by End-user Vertical 2019 & 2032
- Table 130: Global 3D Mapping and 3D Modelling Industry Volume K Unit Forecast, by End-user Vertical 2019 & 2032
- Table 131: Global 3D Mapping and 3D Modelling Industry Revenue Million Forecast, by Country 2019 & 2032
- Table 132: Global 3D Mapping and 3D Modelling Industry Volume K Unit Forecast, by Country 2019 & 2032
- Table 133: Global 3D Mapping and 3D Modelling Industry Revenue Million Forecast, by Type 2019 & 2032
- Table 134: Global 3D Mapping and 3D Modelling Industry Volume K Unit Forecast, by Type 2019 & 2032
- Table 135: Global 3D Mapping and 3D Modelling Industry Revenue Million Forecast, by Application 2019 & 2032
- Table 136: Global 3D Mapping and 3D Modelling Industry Volume K Unit Forecast, by Application 2019 & 2032
- Table 137: Global 3D Mapping and 3D Modelling Industry Revenue Million Forecast, by End-user Vertical 2019 & 2032
- Table 138: Global 3D Mapping and 3D Modelling Industry Volume K Unit Forecast, by End-user Vertical 2019 & 2032
- Table 139: Global 3D Mapping and 3D Modelling Industry Revenue Million Forecast, by Country 2019 & 2032
- Table 140: Global 3D Mapping and 3D Modelling Industry Volume K Unit Forecast, by Country 2019 & 2032
- Table 141: Global 3D Mapping and 3D Modelling Industry Revenue Million Forecast, by Type 2019 & 2032
- Table 142: Global 3D Mapping and 3D Modelling Industry Volume K Unit Forecast, by Type 2019 & 2032
- Table 143: Global 3D Mapping and 3D Modelling Industry Revenue Million Forecast, by Application 2019 & 2032
- Table 144: Global 3D Mapping and 3D Modelling Industry Volume K Unit Forecast, by Application 2019 & 2032
- Table 145: Global 3D Mapping and 3D Modelling Industry Revenue Million Forecast, by End-user Vertical 2019 & 2032
- Table 146: Global 3D Mapping and 3D Modelling Industry Volume K Unit Forecast, by End-user Vertical 2019 & 2032
- Table 147: Global 3D Mapping and 3D Modelling Industry Revenue Million Forecast, by Country 2019 & 2032
- Table 148: Global 3D Mapping and 3D Modelling Industry Volume K Unit Forecast, by Country 2019 & 2032
Frequently Asked Questions
1. What is the projected Compound Annual Growth Rate (CAGR) of the 3D Mapping and 3D Modelling Industry?
The projected CAGR is approximately 14.67%.
2. Which companies are prominent players in the 3D Mapping and 3D Modelling Industry?
Key companies in the market include Airbus Defense and Space, Cybercity 3D Inc, ESRI Inc , Golden Software LLC, Intermap Technologies, The Foundry Visionmongers Ltd, Autodesk Inc, Topcon Positioning Systems Inc, Trimble Inc, Bentley Systems Inc, Saab AB.
3. What are the main segments of the 3D Mapping and 3D Modelling Industry?
The market segments include Type, Application, End-user Vertical.
4. Can you provide details about the market size?
The market size is estimated to be USD 7.48 Million as of 2022.
5. What are some drivers contributing to market growth?
Advent of 3D-enabled Display Devices; Advancement of 3D Scanners. 3D Sensors. and Other Acquisition Devices.
6. What are the notable trends driving market growth?
Entertainment and Media Segment would Contribute Significantly to the Market Growth.
7. Are there any restraints impacting market growth?
High Initial Investments.
8. Can you provide examples of recent developments in the market?
N/A
9. What pricing options are available for accessing the report?
Pricing options include single-user, multi-user, and enterprise licenses priced at USD 4750, USD 5250, and USD 8750 respectively.
10. Is the market size provided in terms of value or volume?
The market size is provided in terms of value, measured in Million and volume, measured in K Unit.
11. Are there any specific market keywords associated with the report?
Yes, the market keyword associated with the report is "3D Mapping and 3D Modelling Industry," which aids in identifying and referencing the specific market segment covered.
12. How do I determine which pricing option suits my needs best?
The pricing options vary based on user requirements and access needs. Individual users may opt for single-user licenses, while businesses requiring broader access may choose multi-user or enterprise licenses for cost-effective access to the report.
13. Are there any additional resources or data provided in the 3D Mapping and 3D Modelling Industry report?
While the report offers comprehensive insights, it's advisable to review the specific contents or supplementary materials provided to ascertain if additional resources or data are available.
14. How can I stay updated on further developments or reports in the 3D Mapping and 3D Modelling Industry?
To stay informed about further developments, trends, and reports in the 3D Mapping and 3D Modelling Industry, consider subscribing to industry newsletters, following relevant companies and organizations, or regularly checking reputable industry news sources and publications.
Methodology
Step 1 - Identification of Relevant Samples Size from Population Database


Step 2 - Approaches for Defining Global Market Size (Value, Volume* & Price*)

Note*: In applicable scenarios
Step 3 - Data Sources
Primary Research
- Web Analytics
- Survey Reports
- Research Institute
- Latest Research Reports
- Opinion Leaders
Secondary Research
- Annual Reports
- White Paper
- Latest Press Release
- Industry Association
- Paid Database
- Investor Presentations

Step 4 - Data Triangulation
Involves using different sources of information in order to increase the validity of a study
These sources are likely to be stakeholders in a program - participants, other researchers, program staff, other community members, and so on.
Then we put all data in single framework & apply various statistical tools to find out the dynamic on the market.
During the analysis stage, feedback from the stakeholder groups would be compared to determine areas of agreement as well as areas of divergence


