
Key Insights
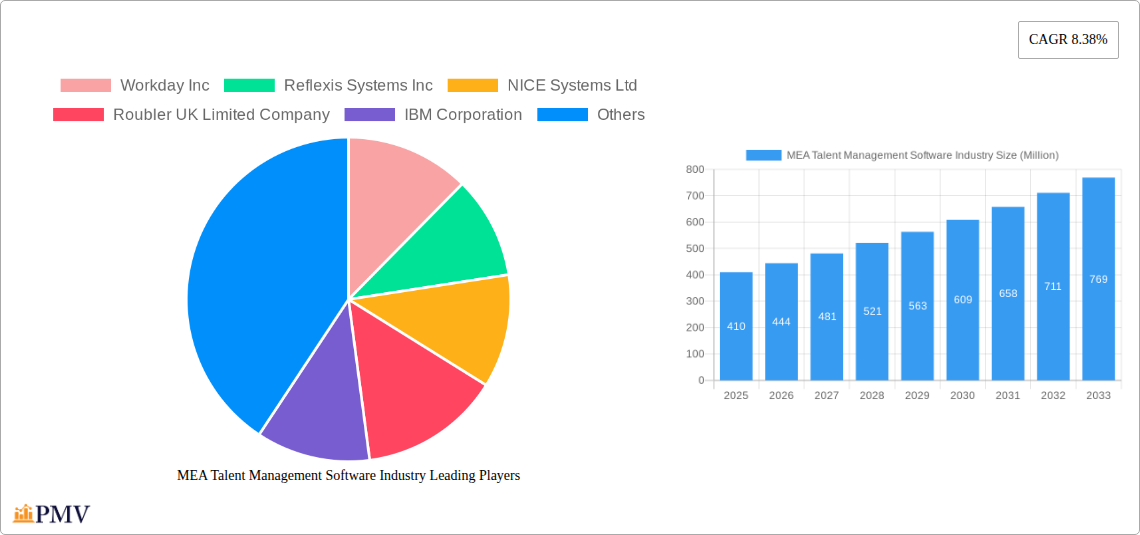
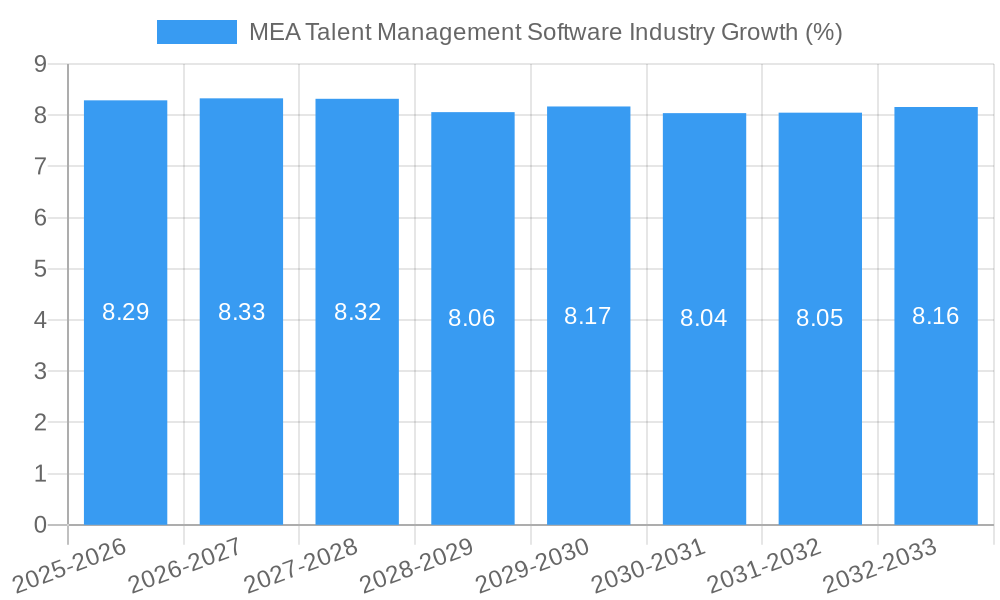
The Middle East and Africa (MEA) Talent Management Software market is poised for significant expansion, projected to grow from an estimated USD 0.41 billion in 2025 at a robust Compound Annual Growth Rate (CAGR) of 8.38%. This upward trajectory is fueled by several key drivers, including the increasing need for organizations to attract, develop, and retain top talent in a competitive global landscape. Businesses across the MEA region are recognizing the critical role of strategic workforce planning and analytics in achieving organizational objectives. The growing adoption of cloud-based solutions is further accelerating this growth, offering scalability, flexibility, and cost-effectiveness to businesses of all sizes. Furthermore, the rising emphasis on employee performance, goal alignment, and efficient absence and leave management is driving demand for integrated talent management suites.
The MEA Talent Management Software market is witnessing a dynamic evolution with distinct segment growth. The Workforce Scheduling and Workforce Analytics segment is expected to lead, reflecting the imperative for data-driven decision-making in workforce optimization. Time and Attendance Management and Performance and Goal Management also represent substantial growth areas as organizations strive to enhance productivity and employee engagement. The shift towards cloud deployment modes is a dominant trend, enabling smaller enterprises to access sophisticated talent management capabilities without significant upfront investments. While the on-premise model retains a presence, cloud solutions are increasingly favored for their agility. Key end-user verticals such as BFSI, Consumer Goods and Retail, and Healthcare are at the forefront of adoption, recognizing the immediate impact of effective talent management on their operations and bottom line. Emerging economies within the MEA region are expected to contribute significantly to this market expansion, driven by increasing foreign investment and a growing focus on human capital development.
This detailed report offers an in-depth analysis of the Middle East and Africa (MEA) Talent Management Software industry. Covering the historical period from 2019 to 2024, with a base year of 2025 and a forecast period extending to 2033, this report provides actionable insights for stakeholders seeking to understand market dynamics, identify growth opportunities, and navigate competitive landscapes. The MEA region is experiencing rapid digital transformation, driving significant demand for sophisticated talent management solutions that enhance employee engagement, optimize workforce performance, and streamline HR processes. This report leverages extensive market research, expert opinions, and proprietary data to deliver a definitive guide to this burgeoning market.
MEA Talent Management Software Industry Market Structure & Competitive Dynamics
The MEA Talent Management Software market exhibits a moderately concentrated structure, with a blend of global enterprise players and emerging regional specialists. Innovation is a key differentiator, driven by the increasing adoption of AI, machine learning, and advanced analytics for personalized employee experiences and data-driven decision-making. Regulatory frameworks, while evolving, are generally supportive of digital transformation initiatives across various sectors. Product substitutes, such as standalone HR modules or manual processes, are diminishing as organizations recognize the integrated benefits of comprehensive talent management suites. End-user trends are heavily influenced by the pursuit of enhanced employee productivity, reduced operational costs, and improved talent acquisition and retention strategies. Mergers and acquisitions (M&A) are becoming more prevalent as larger players seek to expand their geographic reach and product portfolios within the MEA region. For instance, the acquisition of smaller, niche HR tech companies by larger HRIS providers is a recurring theme. Market share is largely dominated by established global vendors, but regional players are gaining traction by offering localized solutions and competitive pricing. M&A deal values are projected to see a steady increase as strategic partnerships and consolidations become more common, aiming to consolidate market leadership and expand service offerings. The competitive landscape is characterized by a focus on cloud-based solutions, superior user experience, and robust integration capabilities.
MEA Talent Management Software Industry Industry Trends & Insights
The MEA Talent Management Software industry is poised for substantial growth, driven by several interconnected trends. A primary growth driver is the accelerating digital transformation across the MEA region, fueled by government initiatives promoting technological adoption and economic diversification. Organizations are increasingly recognizing the strategic importance of optimizing their human capital to achieve business objectives. This has led to a heightened demand for Workforce Scheduling and Workforce Analytics solutions, enabling businesses to forecast staffing needs, monitor employee performance, and identify skill gaps more effectively. The burgeoning BFSI, Consumer Goods and Retail, and Healthcare sectors are leading this adoption, seeking to improve operational efficiency and enhance customer service through better workforce management.
Technological disruptions are profoundly reshaping the talent management landscape. The integration of Artificial Intelligence (AI) and Machine Learning (ML) is enabling more personalized employee development plans, predictive analytics for talent retention, and automated HR processes. Cloud deployment models continue to dominate, offering scalability, flexibility, and cost-effectiveness, especially for Small and Medium-sized Enterprises (SMEs) across the region. The Consumer Goods and Retail sector, with its inherently dynamic workforce, is a significant adopter of Time and Attendance Management and Workforce Scheduling software, aiming to optimize shift planning and minimize labor costs.
Consumer preferences are shifting towards employee-centric solutions that foster engagement and professional growth. Platforms offering intuitive user interfaces, mobile accessibility, and features like Performance and Goal Management are gaining popularity. The need for robust Absence and Leave Management systems is also critical, particularly in industries with diverse labor laws and employee benefits packages. The competitive dynamics are characterized by a fierce race among vendors to offer comprehensive, integrated suites that address the unique challenges of the MEA market, including diverse regulatory environments and varying levels of digital maturity. As the market penetration of advanced talent management software increases, companies are investing heavily in R&D to offer innovative features, predictive analytics, and seamless integration with existing enterprise systems. The projected Compound Annual Growth Rate (CAGR) for the MEA Talent Management Software market is estimated to be around 12-15% over the forecast period, indicating a robust expansion trajectory. This growth is underpinned by the increasing realization of the ROI associated with effective talent management, including improved employee productivity, reduced turnover, and enhanced overall organizational performance.
Dominant Markets & Segments in MEA Talent Management Software Industry
The MEA Talent Management Software industry is characterized by a dynamic interplay of dominant markets and segments, each contributing to the overall growth trajectory.
Leading Regions and Countries:
- United Arab Emirates (UAE): As a regional hub for innovation and business, the UAE leads in the adoption of advanced talent management solutions. Its robust economic policies, significant foreign direct investment, and progressive approach to technology adoption create a fertile ground for sophisticated HR software. The presence of multinational corporations and a diverse workforce necessitate efficient and integrated talent management systems.
- Saudi Arabia: Driven by Vision 2030 initiatives, Saudi Arabia is heavily investing in digital transformation, including HR technology. The focus on developing a skilled local workforce and attracting global talent further propels the demand for comprehensive talent management platforms.
- South Africa: As one of the most developed economies in Africa, South Africa exhibits a strong demand for talent management software, particularly within sectors like Financial Services and Mining, which require advanced workforce planning and compliance solutions.
Dominant Segments by Type:
- Workforce Scheduling and Workforce Analytics: This segment is experiencing significant growth due to the increasing need for optimized staffing, labor cost control, and data-driven insights into workforce productivity. Sectors like Consumer Goods and Retail, and Healthcare are major drivers of this segment's dominance, demanding precise scheduling to manage fluctuating customer demands and patient needs.
- Time and Attendance Management: Essential for accurate payroll processing and compliance, this segment remains a foundational element for most organizations. Its widespread adoption across all end-user verticals underscores its critical role in operational efficiency.
- Performance and Goal Management: With a growing emphasis on employee development and performance-driven cultures, this segment is gaining prominence. Companies are leveraging these tools to align individual goals with organizational objectives, fostering employee engagement and skill enhancement.
Dominant Segments by Deployment Mode:
- Cloud: Cloud-based solutions are overwhelmingly dominant, offering scalability, accessibility, and cost-effectiveness. This is particularly attractive for businesses across the MEA region that seek to minimize upfront infrastructure investments and benefit from continuous software updates and support. The ease of deployment and integration with other cloud-based business applications further solidifies its leadership.
Dominant Segments by End-user Vertical:
- Consumer Goods and Retail: This sector's highly dynamic workforce, with its complex scheduling needs and high employee turnover, makes it a prime adopter of talent management software. Solutions that offer efficient Workforce Scheduling, Time and Attendance Management, and Performance and Goal Management are crucial for operational success.
- BFSI (Banking, Financial Services, and Insurance): The BFSI sector requires robust solutions for compliance, employee development, and talent retention in a highly competitive environment. Performance and Goal Management, along with Workforce Analytics, are key to managing a high-performing workforce.
- Healthcare: The continuous demand for healthcare services necessitates efficient Workforce Scheduling and Absence and Leave Management to ensure adequate staffing levels and uninterrupted patient care. The sector also benefits from Performance and Goal Management to enhance clinical outcomes and employee development.
MEA Talent Management Software Industry Product Innovations
Product innovation in the MEA Talent Management Software industry is largely driven by the integration of advanced technologies like Artificial Intelligence (AI) and Machine Learning (ML). These innovations focus on delivering personalized employee experiences, predictive insights, and automated workflows. Solutions are increasingly offering AI-powered recruitment tools for better candidate matching, predictive analytics for employee attrition, and personalized learning and development paths. Key competitive advantages stem from intuitive user interfaces, mobile-first design, and seamless integration capabilities with existing enterprise resource planning (ERP) and human resource information system (HRIS) platforms. The emphasis is on creating agile, scalable, and data-rich solutions that empower organizations to proactively manage their talent lifecycle, from recruitment and onboarding to performance management and succession planning, thereby enhancing employee engagement and driving business growth.
Report Segmentation & Scope
This report meticulously segments the MEA Talent Management Software market to provide granular insights into its various facets. The segmentation covers:
Type:
- Workforce Scheduling and Workforce Analytics: This segment encompasses software solutions designed for optimizing employee schedules, forecasting staffing needs, and analyzing workforce data to identify trends and improve productivity.
- Time and Attendance Management: This segment focuses on solutions that accurately track employee work hours, manage overtime, and facilitate payroll processing.
- Performance and Goal Management: This segment includes software that enables organizations to set, track, and manage employee performance against predefined goals, fostering development and accountability.
- Absence and Leave Management: This segment covers systems that streamline the process of requesting, approving, and tracking employee absences and leaves.
- Other So: This includes other specialized talent management functionalities not covered in the primary categories.
Deployment Mode:
- On-premise: This refers to software installed and operated on a company's own servers and IT infrastructure.
- Cloud: This segment includes software delivered over the internet, typically on a subscription basis, offering greater flexibility and scalability.
End-user Vertical:
- BFSI (Banking, Financial Services, and Insurance): This vertical demands robust solutions for compliance, talent development, and performance management.
- Consumer Goods and Retail: Characterized by a dynamic workforce, this vertical requires efficient workforce scheduling, time tracking, and employee engagement tools.
- Automotive: This sector benefits from solutions that manage a skilled workforce, streamline production, and foster employee development.
- Energy and Utilities: This vertical often requires specialized solutions for safety compliance, workforce planning in remote locations, and managing a highly skilled workforce.
- Healthcare: This sector relies heavily on accurate scheduling, absence management, and performance tracking to ensure adequate patient care.
- Manufacturing: This vertical utilizes talent management software for workforce optimization, skill development, and operational efficiency.
- Other End-user Verticals: This encompasses a broad range of industries not specifically listed.
The report projects significant growth in the Cloud deployment mode segment and for Workforce Scheduling and Workforce Analytics within the Consumer Goods and Retail and Healthcare verticals.
Key Drivers of MEA Talent Management Software Industry Growth
The MEA Talent Management Software industry's growth is propelled by a confluence of powerful drivers. A primary catalyst is the increasing emphasis on digital transformation initiatives across governments and enterprises in the region, fostering an environment ripe for technological adoption. Economic diversification efforts in countries like Saudi Arabia and the UAE are leading to the expansion of various industries, creating a greater need for efficient human capital management. Furthermore, a growing awareness among organizations about the strategic importance of employee engagement, productivity, and retention is driving investment in sophisticated talent management solutions. The need to comply with evolving labor laws and regulations across diverse MEA markets also necessitates robust and adaptable HR technology. Finally, the increasing availability of skilled IT professionals and the rising adoption of cloud computing are lowering barriers to entry and facilitating the deployment of advanced talent management software.
Challenges in the MEA Talent Management Software Industry Sector
Despite the robust growth, the MEA Talent Management Software sector faces several challenges. Regulatory fragmentation across different countries within the MEA region can lead to complexity in compliance for multinational corporations. The digital divide and varying levels of digital literacy among the workforce in some parts of the region can hinder the adoption of advanced features and necessitate extensive training. Intense competition from both global players and emerging local vendors can lead to price pressures and necessitate continuous innovation. Furthermore, concerns around data privacy and cybersecurity, especially with the increasing reliance on cloud-based solutions, require vendors to invest heavily in robust security measures and build trust with their clients. The availability of skilled IT personnel to implement and manage these complex systems can also be a bottleneck in certain markets.
Leading Players in the MEA Talent Management Software Industry Market
- Workday Inc
- Reflexis Systems Inc
- NICE Systems Ltd
- Roubler UK Limited Company
- IBM Corporation
- Blue Yonder Group Inc
- Active Operations Management International LLP
- Sage Group PLC
- Kronos Incorporated (UKG Inc)
- 7shifts
- ServiceMax Inc
- Infor Group
- Atoss Software AG
- Oracle Corporation
- ADP LLC
- Tamigo UK Ltd
- SISQUAL
- WorkForce Software LLC
- SAP SE
- Mitrefinch Ltd
- Kirona Solutions Limited
Key Developments in MEA Talent Management Software Industry Sector
- January 2023: BrightPlan, a United States-based company, launched a new workforce financial wellness gauge, providing data-driven insights for organizations to uncover key workforce strengths and gaps in the Middle East and Africa region. BrightPlan's Total Financial Wellness solution, powered by patented AI technology, transforms raw data into valuable insights and advice for employers and employees. This development enhances the focus on employee well-being within talent management strategies.
- October 2022: Darwinbox (provider of cloud-based Human Resources Management Software) expanded its business reach in the Middle Eastern region by opening a new office at Dubai International Financial Centre (DIFC). This will advance its business connection with enterprises, investors, and partners, signaling increased investment and focus on the MEA market by key HR tech providers.
Strategic MEA Talent Management Software Industry Market Outlook
The strategic outlook for the MEA Talent Management Software industry is exceptionally positive, characterized by sustained growth and evolving market demands. Key growth accelerators include the ongoing digital transformation initiatives, the increasing focus on employee experience and engagement, and the imperative for businesses to adopt agile and data-driven HR practices. The expansion of cloud infrastructure and increasing internet penetration across the region will further democratize access to advanced talent management solutions, particularly for SMEs. Strategic opportunities lie in developing localized solutions that cater to the specific cultural and regulatory nuances of various MEA countries, as well as in integrating emerging technologies like AI and blockchain for enhanced security and personalization. Vendors that can offer comprehensive, integrated suites with a strong emphasis on user experience, analytics, and compliance will be well-positioned for significant market share gains. The projected market expansion signifies a robust future for talent management software in powering organizational success across the Middle East and Africa.
MEA Talent Management Software Industry Segmentation
-
1. Type
- 1.1. Workforce Scheduling and Workforce Analytics
- 1.2. Time and Attendance Management
- 1.3. Performance and Goal Management
- 1.4. Absence and Leave Management
- 1.5. Other So
-
2. Deployment Mode
- 2.1. On-premise
- 2.2. Cloud
-
3. End-user Vertical
- 3.1. BFSI
- 3.2. Consumer Goods and Retail
- 3.3. Automotive
- 3.4. Energy and Utilities
- 3.5. Healthcare
- 3.6. Manufacturing
- 3.7. Other End-user Verticals
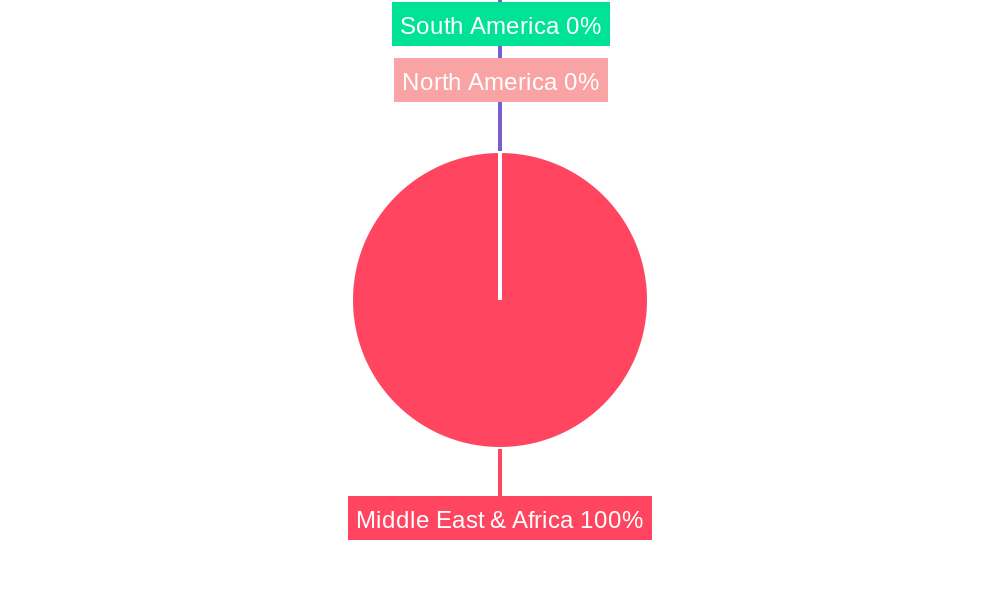
MEA Talent Management Software Industry Segmentation By Geography
-
1. North America
- 1.1. United States
- 1.2. Canada
- 1.3. Mexico
-
2. South America
- 2.1. Brazil
- 2.2. Argentina
- 2.3. Rest of South America
-
3. Europe
- 3.1. United Kingdom
- 3.2. Germany
- 3.3. France
- 3.4. Italy
- 3.5. Spain
- 3.6. Russia
- 3.7. Benelux
- 3.8. Nordics
- 3.9. Rest of Europe
-
4. Middle East & Africa
- 4.1. Turkey
- 4.2. Israel
- 4.3. GCC
- 4.4. North Africa
- 4.5. South Africa
- 4.6. Rest of Middle East & Africa
-
5. Asia Pacific
- 5.1. China
- 5.2. India
- 5.3. Japan
- 5.4. South Korea
- 5.5. ASEAN
- 5.6. Oceania
- 5.7. Rest of Asia Pacific
MEA Talent Management Software Industry REPORT HIGHLIGHTS
| Aspects | Details |
|---|---|
| Study Period | 2019-2033 |
| Base Year | 2024 |
| Estimated Year | 2025 |
| Forecast Period | 2025-2033 |
| Historical Period | 2019-2024 |
| Growth Rate | CAGR of 8.38% from 2019-2033 |
| Segmentation |
|
Table of Contents
- 1. Introduction
- 1.1. Research Scope
- 1.2. Market Segmentation
- 1.3. Research Methodology
- 1.4. Definitions and Assumptions
- 2. Executive Summary
- 2.1. Introduction
- 3. Market Dynamics
- 3.1. Introduction
- 3.2. Market Drivers
- 3.2.1. Increasing Adoption of Internet of Things (IoT) and Cloud-based Solutions Expanding the Market; Growing Adoption of Analytical Solutions and WFM by SMEs Driving Market Growth
- 3.3. Market Restrains
- 3.3.1. ; Availability of open-source alternatives
- 3.4. Market Trends
- 3.4.1. Workforce Scheduling and Workforce Analytics Type is Expected to Hold Significant Market Share
- 4. Market Factor Analysis
- 4.1. Porters Five Forces
- 4.2. Supply/Value Chain
- 4.3. PESTEL analysis
- 4.4. Market Entropy
- 4.5. Patent/Trademark Analysis
- 5. Global MEA Talent Management Software Industry Analysis, Insights and Forecast, 2019-2031
- 5.1. Market Analysis, Insights and Forecast - by Type
- 5.1.1. Workforce Scheduling and Workforce Analytics
- 5.1.2. Time and Attendance Management
- 5.1.3. Performance and Goal Management
- 5.1.4. Absence and Leave Management
- 5.1.5. Other So
- 5.2. Market Analysis, Insights and Forecast - by Deployment Mode
- 5.2.1. On-premise
- 5.2.2. Cloud
- 5.3. Market Analysis, Insights and Forecast - by End-user Vertical
- 5.3.1. BFSI
- 5.3.2. Consumer Goods and Retail
- 5.3.3. Automotive
- 5.3.4. Energy and Utilities
- 5.3.5. Healthcare
- 5.3.6. Manufacturing
- 5.3.7. Other End-user Verticals
- 5.4. Market Analysis, Insights and Forecast - by Region
- 5.4.1. North America
- 5.4.2. South America
- 5.4.3. Europe
- 5.4.4. Middle East & Africa
- 5.4.5. Asia Pacific
- 5.1. Market Analysis, Insights and Forecast - by Type
- 6. North America MEA Talent Management Software Industry Analysis, Insights and Forecast, 2019-2031
- 6.1. Market Analysis, Insights and Forecast - by Type
- 6.1.1. Workforce Scheduling and Workforce Analytics
- 6.1.2. Time and Attendance Management
- 6.1.3. Performance and Goal Management
- 6.1.4. Absence and Leave Management
- 6.1.5. Other So
- 6.2. Market Analysis, Insights and Forecast - by Deployment Mode
- 6.2.1. On-premise
- 6.2.2. Cloud
- 6.3. Market Analysis, Insights and Forecast - by End-user Vertical
- 6.3.1. BFSI
- 6.3.2. Consumer Goods and Retail
- 6.3.3. Automotive
- 6.3.4. Energy and Utilities
- 6.3.5. Healthcare
- 6.3.6. Manufacturing
- 6.3.7. Other End-user Verticals
- 6.1. Market Analysis, Insights and Forecast - by Type
- 7. South America MEA Talent Management Software Industry Analysis, Insights and Forecast, 2019-2031
- 7.1. Market Analysis, Insights and Forecast - by Type
- 7.1.1. Workforce Scheduling and Workforce Analytics
- 7.1.2. Time and Attendance Management
- 7.1.3. Performance and Goal Management
- 7.1.4. Absence and Leave Management
- 7.1.5. Other So
- 7.2. Market Analysis, Insights and Forecast - by Deployment Mode
- 7.2.1. On-premise
- 7.2.2. Cloud
- 7.3. Market Analysis, Insights and Forecast - by End-user Vertical
- 7.3.1. BFSI
- 7.3.2. Consumer Goods and Retail
- 7.3.3. Automotive
- 7.3.4. Energy and Utilities
- 7.3.5. Healthcare
- 7.3.6. Manufacturing
- 7.3.7. Other End-user Verticals
- 7.1. Market Analysis, Insights and Forecast - by Type
- 8. Europe MEA Talent Management Software Industry Analysis, Insights and Forecast, 2019-2031
- 8.1. Market Analysis, Insights and Forecast - by Type
- 8.1.1. Workforce Scheduling and Workforce Analytics
- 8.1.2. Time and Attendance Management
- 8.1.3. Performance and Goal Management
- 8.1.4. Absence and Leave Management
- 8.1.5. Other So
- 8.2. Market Analysis, Insights and Forecast - by Deployment Mode
- 8.2.1. On-premise
- 8.2.2. Cloud
- 8.3. Market Analysis, Insights and Forecast - by End-user Vertical
- 8.3.1. BFSI
- 8.3.2. Consumer Goods and Retail
- 8.3.3. Automotive
- 8.3.4. Energy and Utilities
- 8.3.5. Healthcare
- 8.3.6. Manufacturing
- 8.3.7. Other End-user Verticals
- 8.1. Market Analysis, Insights and Forecast - by Type
- 9. Middle East & Africa MEA Talent Management Software Industry Analysis, Insights and Forecast, 2019-2031
- 9.1. Market Analysis, Insights and Forecast - by Type
- 9.1.1. Workforce Scheduling and Workforce Analytics
- 9.1.2. Time and Attendance Management
- 9.1.3. Performance and Goal Management
- 9.1.4. Absence and Leave Management
- 9.1.5. Other So
- 9.2. Market Analysis, Insights and Forecast - by Deployment Mode
- 9.2.1. On-premise
- 9.2.2. Cloud
- 9.3. Market Analysis, Insights and Forecast - by End-user Vertical
- 9.3.1. BFSI
- 9.3.2. Consumer Goods and Retail
- 9.3.3. Automotive
- 9.3.4. Energy and Utilities
- 9.3.5. Healthcare
- 9.3.6. Manufacturing
- 9.3.7. Other End-user Verticals
- 9.1. Market Analysis, Insights and Forecast - by Type
- 10. Asia Pacific MEA Talent Management Software Industry Analysis, Insights and Forecast, 2019-2031
- 10.1. Market Analysis, Insights and Forecast - by Type
- 10.1.1. Workforce Scheduling and Workforce Analytics
- 10.1.2. Time and Attendance Management
- 10.1.3. Performance and Goal Management
- 10.1.4. Absence and Leave Management
- 10.1.5. Other So
- 10.2. Market Analysis, Insights and Forecast - by Deployment Mode
- 10.2.1. On-premise
- 10.2.2. Cloud
- 10.3. Market Analysis, Insights and Forecast - by End-user Vertical
- 10.3.1. BFSI
- 10.3.2. Consumer Goods and Retail
- 10.3.3. Automotive
- 10.3.4. Energy and Utilities
- 10.3.5. Healthcare
- 10.3.6. Manufacturing
- 10.3.7. Other End-user Verticals
- 10.1. Market Analysis, Insights and Forecast - by Type
- 11. North America MEA Talent Management Software Industry Analysis, Insights and Forecast, 2019-2031
- 11.1. Market Analysis, Insights and Forecast - By Country/Sub-region
- 11.1.1.
- 12. Europe MEA Talent Management Software Industry Analysis, Insights and Forecast, 2019-2031
- 12.1. Market Analysis, Insights and Forecast - By Country/Sub-region
- 12.1.1.
- 13. Asia Pacific MEA Talent Management Software Industry Analysis, Insights and Forecast, 2019-2031
- 13.1. Market Analysis, Insights and Forecast - By Country/Sub-region
- 13.1.1.
- 14. Latin America MEA Talent Management Software Industry Analysis, Insights and Forecast, 2019-2031
- 14.1. Market Analysis, Insights and Forecast - By Country/Sub-region
- 14.1.1.
- 15. Middle East MEA Talent Management Software Industry Analysis, Insights and Forecast, 2019-2031
- 15.1. Market Analysis, Insights and Forecast - By Country/Sub-region
- 15.1.1.
- 16. Competitive Analysis
- 16.1. Global Market Share Analysis 2024
- 16.2. Company Profiles
- 16.2.1 Workday Inc
- 16.2.1.1. Overview
- 16.2.1.2. Products
- 16.2.1.3. SWOT Analysis
- 16.2.1.4. Recent Developments
- 16.2.1.5. Financials (Based on Availability)
- 16.2.2 Reflexis Systems Inc
- 16.2.2.1. Overview
- 16.2.2.2. Products
- 16.2.2.3. SWOT Analysis
- 16.2.2.4. Recent Developments
- 16.2.2.5. Financials (Based on Availability)
- 16.2.3 NICE Systems Ltd
- 16.2.3.1. Overview
- 16.2.3.2. Products
- 16.2.3.3. SWOT Analysis
- 16.2.3.4. Recent Developments
- 16.2.3.5. Financials (Based on Availability)
- 16.2.4 Roubler UK Limited Company
- 16.2.4.1. Overview
- 16.2.4.2. Products
- 16.2.4.3. SWOT Analysis
- 16.2.4.4. Recent Developments
- 16.2.4.5. Financials (Based on Availability)
- 16.2.5 IBM Corporation
- 16.2.5.1. Overview
- 16.2.5.2. Products
- 16.2.5.3. SWOT Analysis
- 16.2.5.4. Recent Developments
- 16.2.5.5. Financials (Based on Availability)
- 16.2.6 Blue Yonder Group Inc
- 16.2.6.1. Overview
- 16.2.6.2. Products
- 16.2.6.3. SWOT Analysis
- 16.2.6.4. Recent Developments
- 16.2.6.5. Financials (Based on Availability)
- 16.2.7 Active Operations Management International LLP
- 16.2.7.1. Overview
- 16.2.7.2. Products
- 16.2.7.3. SWOT Analysis
- 16.2.7.4. Recent Developments
- 16.2.7.5. Financials (Based on Availability)
- 16.2.8 Sage Group PLC
- 16.2.8.1. Overview
- 16.2.8.2. Products
- 16.2.8.3. SWOT Analysis
- 16.2.8.4. Recent Developments
- 16.2.8.5. Financials (Based on Availability)
- 16.2.9 Kronos Incorporated (UKG Inc )
- 16.2.9.1. Overview
- 16.2.9.2. Products
- 16.2.9.3. SWOT Analysis
- 16.2.9.4. Recent Developments
- 16.2.9.5. Financials (Based on Availability)
- 16.2.10 7shifts
- 16.2.10.1. Overview
- 16.2.10.2. Products
- 16.2.10.3. SWOT Analysis
- 16.2.10.4. Recent Developments
- 16.2.10.5. Financials (Based on Availability)
- 16.2.11 ServiceMax Inc
- 16.2.11.1. Overview
- 16.2.11.2. Products
- 16.2.11.3. SWOT Analysis
- 16.2.11.4. Recent Developments
- 16.2.11.5. Financials (Based on Availability)
- 16.2.12 Infor Group
- 16.2.12.1. Overview
- 16.2.12.2. Products
- 16.2.12.3. SWOT Analysis
- 16.2.12.4. Recent Developments
- 16.2.12.5. Financials (Based on Availability)
- 16.2.13 Atoss Software AG
- 16.2.13.1. Overview
- 16.2.13.2. Products
- 16.2.13.3. SWOT Analysis
- 16.2.13.4. Recent Developments
- 16.2.13.5. Financials (Based on Availability)
- 16.2.14 Oracle Corporation
- 16.2.14.1. Overview
- 16.2.14.2. Products
- 16.2.14.3. SWOT Analysis
- 16.2.14.4. Recent Developments
- 16.2.14.5. Financials (Based on Availability)
- 16.2.15 ADP LLC
- 16.2.15.1. Overview
- 16.2.15.2. Products
- 16.2.15.3. SWOT Analysis
- 16.2.15.4. Recent Developments
- 16.2.15.5. Financials (Based on Availability)
- 16.2.16 Tamigo UK Ltd
- 16.2.16.1. Overview
- 16.2.16.2. Products
- 16.2.16.3. SWOT Analysis
- 16.2.16.4. Recent Developments
- 16.2.16.5. Financials (Based on Availability)
- 16.2.17 SISQUAL
- 16.2.17.1. Overview
- 16.2.17.2. Products
- 16.2.17.3. SWOT Analysis
- 16.2.17.4. Recent Developments
- 16.2.17.5. Financials (Based on Availability)
- 16.2.18 WorkForce Software LLC
- 16.2.18.1. Overview
- 16.2.18.2. Products
- 16.2.18.3. SWOT Analysis
- 16.2.18.4. Recent Developments
- 16.2.18.5. Financials (Based on Availability)
- 16.2.19 SAP SE
- 16.2.19.1. Overview
- 16.2.19.2. Products
- 16.2.19.3. SWOT Analysis
- 16.2.19.4. Recent Developments
- 16.2.19.5. Financials (Based on Availability)
- 16.2.20 Mitrefinch Ltd
- 16.2.20.1. Overview
- 16.2.20.2. Products
- 16.2.20.3. SWOT Analysis
- 16.2.20.4. Recent Developments
- 16.2.20.5. Financials (Based on Availability)
- 16.2.21 Kirona Solutions Limited
- 16.2.21.1. Overview
- 16.2.21.2. Products
- 16.2.21.3. SWOT Analysis
- 16.2.21.4. Recent Developments
- 16.2.21.5. Financials (Based on Availability)
- 16.2.1 Workday Inc
List of Figures
- Figure 1: Global MEA Talent Management Software Industry Revenue Breakdown (Million, %) by Region 2024 & 2032
- Figure 2: Global MEA Talent Management Software Industry Volume Breakdown (K Unit, %) by Region 2024 & 2032
- Figure 3: North America MEA Talent Management Software Industry Revenue (Million), by Country 2024 & 2032
- Figure 4: North America MEA Talent Management Software Industry Volume (K Unit), by Country 2024 & 2032
- Figure 5: North America MEA Talent Management Software Industry Revenue Share (%), by Country 2024 & 2032
- Figure 6: North America MEA Talent Management Software Industry Volume Share (%), by Country 2024 & 2032
- Figure 7: Europe MEA Talent Management Software Industry Revenue (Million), by Country 2024 & 2032
- Figure 8: Europe MEA Talent Management Software Industry Volume (K Unit), by Country 2024 & 2032
- Figure 9: Europe MEA Talent Management Software Industry Revenue Share (%), by Country 2024 & 2032
- Figure 10: Europe MEA Talent Management Software Industry Volume Share (%), by Country 2024 & 2032
- Figure 11: Asia Pacific MEA Talent Management Software Industry Revenue (Million), by Country 2024 & 2032
- Figure 12: Asia Pacific MEA Talent Management Software Industry Volume (K Unit), by Country 2024 & 2032
- Figure 13: Asia Pacific MEA Talent Management Software Industry Revenue Share (%), by Country 2024 & 2032
- Figure 14: Asia Pacific MEA Talent Management Software Industry Volume Share (%), by Country 2024 & 2032
- Figure 15: Latin America MEA Talent Management Software Industry Revenue (Million), by Country 2024 & 2032
- Figure 16: Latin America MEA Talent Management Software Industry Volume (K Unit), by Country 2024 & 2032
- Figure 17: Latin America MEA Talent Management Software Industry Revenue Share (%), by Country 2024 & 2032
- Figure 18: Latin America MEA Talent Management Software Industry Volume Share (%), by Country 2024 & 2032
- Figure 19: Middle East MEA Talent Management Software Industry Revenue (Million), by Country 2024 & 2032
- Figure 20: Middle East MEA Talent Management Software Industry Volume (K Unit), by Country 2024 & 2032
- Figure 21: Middle East MEA Talent Management Software Industry Revenue Share (%), by Country 2024 & 2032
- Figure 22: Middle East MEA Talent Management Software Industry Volume Share (%), by Country 2024 & 2032
- Figure 23: North America MEA Talent Management Software Industry Revenue (Million), by Type 2024 & 2032
- Figure 24: North America MEA Talent Management Software Industry Volume (K Unit), by Type 2024 & 2032
- Figure 25: North America MEA Talent Management Software Industry Revenue Share (%), by Type 2024 & 2032
- Figure 26: North America MEA Talent Management Software Industry Volume Share (%), by Type 2024 & 2032
- Figure 27: North America MEA Talent Management Software Industry Revenue (Million), by Deployment Mode 2024 & 2032
- Figure 28: North America MEA Talent Management Software Industry Volume (K Unit), by Deployment Mode 2024 & 2032
- Figure 29: North America MEA Talent Management Software Industry Revenue Share (%), by Deployment Mode 2024 & 2032
- Figure 30: North America MEA Talent Management Software Industry Volume Share (%), by Deployment Mode 2024 & 2032
- Figure 31: North America MEA Talent Management Software Industry Revenue (Million), by End-user Vertical 2024 & 2032
- Figure 32: North America MEA Talent Management Software Industry Volume (K Unit), by End-user Vertical 2024 & 2032
- Figure 33: North America MEA Talent Management Software Industry Revenue Share (%), by End-user Vertical 2024 & 2032
- Figure 34: North America MEA Talent Management Software Industry Volume Share (%), by End-user Vertical 2024 & 2032
- Figure 35: North America MEA Talent Management Software Industry Revenue (Million), by Country 2024 & 2032
- Figure 36: North America MEA Talent Management Software Industry Volume (K Unit), by Country 2024 & 2032
- Figure 37: North America MEA Talent Management Software Industry Revenue Share (%), by Country 2024 & 2032
- Figure 38: North America MEA Talent Management Software Industry Volume Share (%), by Country 2024 & 2032
- Figure 39: South America MEA Talent Management Software Industry Revenue (Million), by Type 2024 & 2032
- Figure 40: South America MEA Talent Management Software Industry Volume (K Unit), by Type 2024 & 2032
- Figure 41: South America MEA Talent Management Software Industry Revenue Share (%), by Type 2024 & 2032
- Figure 42: South America MEA Talent Management Software Industry Volume Share (%), by Type 2024 & 2032
- Figure 43: South America MEA Talent Management Software Industry Revenue (Million), by Deployment Mode 2024 & 2032
- Figure 44: South America MEA Talent Management Software Industry Volume (K Unit), by Deployment Mode 2024 & 2032
- Figure 45: South America MEA Talent Management Software Industry Revenue Share (%), by Deployment Mode 2024 & 2032
- Figure 46: South America MEA Talent Management Software Industry Volume Share (%), by Deployment Mode 2024 & 2032
- Figure 47: South America MEA Talent Management Software Industry Revenue (Million), by End-user Vertical 2024 & 2032
- Figure 48: South America MEA Talent Management Software Industry Volume (K Unit), by End-user Vertical 2024 & 2032
- Figure 49: South America MEA Talent Management Software Industry Revenue Share (%), by End-user Vertical 2024 & 2032
- Figure 50: South America MEA Talent Management Software Industry Volume Share (%), by End-user Vertical 2024 & 2032
- Figure 51: South America MEA Talent Management Software Industry Revenue (Million), by Country 2024 & 2032
- Figure 52: South America MEA Talent Management Software Industry Volume (K Unit), by Country 2024 & 2032
- Figure 53: South America MEA Talent Management Software Industry Revenue Share (%), by Country 2024 & 2032
- Figure 54: South America MEA Talent Management Software Industry Volume Share (%), by Country 2024 & 2032
- Figure 55: Europe MEA Talent Management Software Industry Revenue (Million), by Type 2024 & 2032
- Figure 56: Europe MEA Talent Management Software Industry Volume (K Unit), by Type 2024 & 2032
- Figure 57: Europe MEA Talent Management Software Industry Revenue Share (%), by Type 2024 & 2032
- Figure 58: Europe MEA Talent Management Software Industry Volume Share (%), by Type 2024 & 2032
- Figure 59: Europe MEA Talent Management Software Industry Revenue (Million), by Deployment Mode 2024 & 2032
- Figure 60: Europe MEA Talent Management Software Industry Volume (K Unit), by Deployment Mode 2024 & 2032
- Figure 61: Europe MEA Talent Management Software Industry Revenue Share (%), by Deployment Mode 2024 & 2032
- Figure 62: Europe MEA Talent Management Software Industry Volume Share (%), by Deployment Mode 2024 & 2032
- Figure 63: Europe MEA Talent Management Software Industry Revenue (Million), by End-user Vertical 2024 & 2032
- Figure 64: Europe MEA Talent Management Software Industry Volume (K Unit), by End-user Vertical 2024 & 2032
- Figure 65: Europe MEA Talent Management Software Industry Revenue Share (%), by End-user Vertical 2024 & 2032
- Figure 66: Europe MEA Talent Management Software Industry Volume Share (%), by End-user Vertical 2024 & 2032
- Figure 67: Europe MEA Talent Management Software Industry Revenue (Million), by Country 2024 & 2032
- Figure 68: Europe MEA Talent Management Software Industry Volume (K Unit), by Country 2024 & 2032
- Figure 69: Europe MEA Talent Management Software Industry Revenue Share (%), by Country 2024 & 2032
- Figure 70: Europe MEA Talent Management Software Industry Volume Share (%), by Country 2024 & 2032
- Figure 71: Middle East & Africa MEA Talent Management Software Industry Revenue (Million), by Type 2024 & 2032
- Figure 72: Middle East & Africa MEA Talent Management Software Industry Volume (K Unit), by Type 2024 & 2032
- Figure 73: Middle East & Africa MEA Talent Management Software Industry Revenue Share (%), by Type 2024 & 2032
- Figure 74: Middle East & Africa MEA Talent Management Software Industry Volume Share (%), by Type 2024 & 2032
- Figure 75: Middle East & Africa MEA Talent Management Software Industry Revenue (Million), by Deployment Mode 2024 & 2032
- Figure 76: Middle East & Africa MEA Talent Management Software Industry Volume (K Unit), by Deployment Mode 2024 & 2032
- Figure 77: Middle East & Africa MEA Talent Management Software Industry Revenue Share (%), by Deployment Mode 2024 & 2032
- Figure 78: Middle East & Africa MEA Talent Management Software Industry Volume Share (%), by Deployment Mode 2024 & 2032
- Figure 79: Middle East & Africa MEA Talent Management Software Industry Revenue (Million), by End-user Vertical 2024 & 2032
- Figure 80: Middle East & Africa MEA Talent Management Software Industry Volume (K Unit), by End-user Vertical 2024 & 2032
- Figure 81: Middle East & Africa MEA Talent Management Software Industry Revenue Share (%), by End-user Vertical 2024 & 2032
- Figure 82: Middle East & Africa MEA Talent Management Software Industry Volume Share (%), by End-user Vertical 2024 & 2032
- Figure 83: Middle East & Africa MEA Talent Management Software Industry Revenue (Million), by Country 2024 & 2032
- Figure 84: Middle East & Africa MEA Talent Management Software Industry Volume (K Unit), by Country 2024 & 2032
- Figure 85: Middle East & Africa MEA Talent Management Software Industry Revenue Share (%), by Country 2024 & 2032
- Figure 86: Middle East & Africa MEA Talent Management Software Industry Volume Share (%), by Country 2024 & 2032
- Figure 87: Asia Pacific MEA Talent Management Software Industry Revenue (Million), by Type 2024 & 2032
- Figure 88: Asia Pacific MEA Talent Management Software Industry Volume (K Unit), by Type 2024 & 2032
- Figure 89: Asia Pacific MEA Talent Management Software Industry Revenue Share (%), by Type 2024 & 2032
- Figure 90: Asia Pacific MEA Talent Management Software Industry Volume Share (%), by Type 2024 & 2032
- Figure 91: Asia Pacific MEA Talent Management Software Industry Revenue (Million), by Deployment Mode 2024 & 2032
- Figure 92: Asia Pacific MEA Talent Management Software Industry Volume (K Unit), by Deployment Mode 2024 & 2032
- Figure 93: Asia Pacific MEA Talent Management Software Industry Revenue Share (%), by Deployment Mode 2024 & 2032
- Figure 94: Asia Pacific MEA Talent Management Software Industry Volume Share (%), by Deployment Mode 2024 & 2032
- Figure 95: Asia Pacific MEA Talent Management Software Industry Revenue (Million), by End-user Vertical 2024 & 2032
- Figure 96: Asia Pacific MEA Talent Management Software Industry Volume (K Unit), by End-user Vertical 2024 & 2032
- Figure 97: Asia Pacific MEA Talent Management Software Industry Revenue Share (%), by End-user Vertical 2024 & 2032
- Figure 98: Asia Pacific MEA Talent Management Software Industry Volume Share (%), by End-user Vertical 2024 & 2032
- Figure 99: Asia Pacific MEA Talent Management Software Industry Revenue (Million), by Country 2024 & 2032
- Figure 100: Asia Pacific MEA Talent Management Software Industry Volume (K Unit), by Country 2024 & 2032
- Figure 101: Asia Pacific MEA Talent Management Software Industry Revenue Share (%), by Country 2024 & 2032
- Figure 102: Asia Pacific MEA Talent Management Software Industry Volume Share (%), by Country 2024 & 2032
List of Tables
- Table 1: Global MEA Talent Management Software Industry Revenue Million Forecast, by Region 2019 & 2032
- Table 2: Global MEA Talent Management Software Industry Volume K Unit Forecast, by Region 2019 & 2032
- Table 3: Global MEA Talent Management Software Industry Revenue Million Forecast, by Type 2019 & 2032
- Table 4: Global MEA Talent Management Software Industry Volume K Unit Forecast, by Type 2019 & 2032
- Table 5: Global MEA Talent Management Software Industry Revenue Million Forecast, by Deployment Mode 2019 & 2032
- Table 6: Global MEA Talent Management Software Industry Volume K Unit Forecast, by Deployment Mode 2019 & 2032
- Table 7: Global MEA Talent Management Software Industry Revenue Million Forecast, by End-user Vertical 2019 & 2032
- Table 8: Global MEA Talent Management Software Industry Volume K Unit Forecast, by End-user Vertical 2019 & 2032
- Table 9: Global MEA Talent Management Software Industry Revenue Million Forecast, by Region 2019 & 2032
- Table 10: Global MEA Talent Management Software Industry Volume K Unit Forecast, by Region 2019 & 2032
- Table 11: Global MEA Talent Management Software Industry Revenue Million Forecast, by Country 2019 & 2032
- Table 12: Global MEA Talent Management Software Industry Volume K Unit Forecast, by Country 2019 & 2032
- Table 13: MEA Talent Management Software Industry Revenue (Million) Forecast, by Application 2019 & 2032
- Table 14: MEA Talent Management Software Industry Volume (K Unit) Forecast, by Application 2019 & 2032
- Table 15: Global MEA Talent Management Software Industry Revenue Million Forecast, by Country 2019 & 2032
- Table 16: Global MEA Talent Management Software Industry Volume K Unit Forecast, by Country 2019 & 2032
- Table 17: MEA Talent Management Software Industry Revenue (Million) Forecast, by Application 2019 & 2032
- Table 18: MEA Talent Management Software Industry Volume (K Unit) Forecast, by Application 2019 & 2032
- Table 19: Global MEA Talent Management Software Industry Revenue Million Forecast, by Country 2019 & 2032
- Table 20: Global MEA Talent Management Software Industry Volume K Unit Forecast, by Country 2019 & 2032
- Table 21: MEA Talent Management Software Industry Revenue (Million) Forecast, by Application 2019 & 2032
- Table 22: MEA Talent Management Software Industry Volume (K Unit) Forecast, by Application 2019 & 2032
- Table 23: Global MEA Talent Management Software Industry Revenue Million Forecast, by Country 2019 & 2032
- Table 24: Global MEA Talent Management Software Industry Volume K Unit Forecast, by Country 2019 & 2032
- Table 25: MEA Talent Management Software Industry Revenue (Million) Forecast, by Application 2019 & 2032
- Table 26: MEA Talent Management Software Industry Volume (K Unit) Forecast, by Application 2019 & 2032
- Table 27: Global MEA Talent Management Software Industry Revenue Million Forecast, by Country 2019 & 2032
- Table 28: Global MEA Talent Management Software Industry Volume K Unit Forecast, by Country 2019 & 2032
- Table 29: MEA Talent Management Software Industry Revenue (Million) Forecast, by Application 2019 & 2032
- Table 30: MEA Talent Management Software Industry Volume (K Unit) Forecast, by Application 2019 & 2032
- Table 31: Global MEA Talent Management Software Industry Revenue Million Forecast, by Type 2019 & 2032
- Table 32: Global MEA Talent Management Software Industry Volume K Unit Forecast, by Type 2019 & 2032
- Table 33: Global MEA Talent Management Software Industry Revenue Million Forecast, by Deployment Mode 2019 & 2032
- Table 34: Global MEA Talent Management Software Industry Volume K Unit Forecast, by Deployment Mode 2019 & 2032
- Table 35: Global MEA Talent Management Software Industry Revenue Million Forecast, by End-user Vertical 2019 & 2032
- Table 36: Global MEA Talent Management Software Industry Volume K Unit Forecast, by End-user Vertical 2019 & 2032
- Table 37: Global MEA Talent Management Software Industry Revenue Million Forecast, by Country 2019 & 2032
- Table 38: Global MEA Talent Management Software Industry Volume K Unit Forecast, by Country 2019 & 2032
- Table 39: United States MEA Talent Management Software Industry Revenue (Million) Forecast, by Application 2019 & 2032
- Table 40: United States MEA Talent Management Software Industry Volume (K Unit) Forecast, by Application 2019 & 2032
- Table 41: Canada MEA Talent Management Software Industry Revenue (Million) Forecast, by Application 2019 & 2032
- Table 42: Canada MEA Talent Management Software Industry Volume (K Unit) Forecast, by Application 2019 & 2032
- Table 43: Mexico MEA Talent Management Software Industry Revenue (Million) Forecast, by Application 2019 & 2032
- Table 44: Mexico MEA Talent Management Software Industry Volume (K Unit) Forecast, by Application 2019 & 2032
- Table 45: Global MEA Talent Management Software Industry Revenue Million Forecast, by Type 2019 & 2032
- Table 46: Global MEA Talent Management Software Industry Volume K Unit Forecast, by Type 2019 & 2032
- Table 47: Global MEA Talent Management Software Industry Revenue Million Forecast, by Deployment Mode 2019 & 2032
- Table 48: Global MEA Talent Management Software Industry Volume K Unit Forecast, by Deployment Mode 2019 & 2032
- Table 49: Global MEA Talent Management Software Industry Revenue Million Forecast, by End-user Vertical 2019 & 2032
- Table 50: Global MEA Talent Management Software Industry Volume K Unit Forecast, by End-user Vertical 2019 & 2032
- Table 51: Global MEA Talent Management Software Industry Revenue Million Forecast, by Country 2019 & 2032
- Table 52: Global MEA Talent Management Software Industry Volume K Unit Forecast, by Country 2019 & 2032
- Table 53: Brazil MEA Talent Management Software Industry Revenue (Million) Forecast, by Application 2019 & 2032
- Table 54: Brazil MEA Talent Management Software Industry Volume (K Unit) Forecast, by Application 2019 & 2032
- Table 55: Argentina MEA Talent Management Software Industry Revenue (Million) Forecast, by Application 2019 & 2032
- Table 56: Argentina MEA Talent Management Software Industry Volume (K Unit) Forecast, by Application 2019 & 2032
- Table 57: Rest of South America MEA Talent Management Software Industry Revenue (Million) Forecast, by Application 2019 & 2032
- Table 58: Rest of South America MEA Talent Management Software Industry Volume (K Unit) Forecast, by Application 2019 & 2032
- Table 59: Global MEA Talent Management Software Industry Revenue Million Forecast, by Type 2019 & 2032
- Table 60: Global MEA Talent Management Software Industry Volume K Unit Forecast, by Type 2019 & 2032
- Table 61: Global MEA Talent Management Software Industry Revenue Million Forecast, by Deployment Mode 2019 & 2032
- Table 62: Global MEA Talent Management Software Industry Volume K Unit Forecast, by Deployment Mode 2019 & 2032
- Table 63: Global MEA Talent Management Software Industry Revenue Million Forecast, by End-user Vertical 2019 & 2032
- Table 64: Global MEA Talent Management Software Industry Volume K Unit Forecast, by End-user Vertical 2019 & 2032
- Table 65: Global MEA Talent Management Software Industry Revenue Million Forecast, by Country 2019 & 2032
- Table 66: Global MEA Talent Management Software Industry Volume K Unit Forecast, by Country 2019 & 2032
- Table 67: United Kingdom MEA Talent Management Software Industry Revenue (Million) Forecast, by Application 2019 & 2032
- Table 68: United Kingdom MEA Talent Management Software Industry Volume (K Unit) Forecast, by Application 2019 & 2032
- Table 69: Germany MEA Talent Management Software Industry Revenue (Million) Forecast, by Application 2019 & 2032
- Table 70: Germany MEA Talent Management Software Industry Volume (K Unit) Forecast, by Application 2019 & 2032
- Table 71: France MEA Talent Management Software Industry Revenue (Million) Forecast, by Application 2019 & 2032
- Table 72: France MEA Talent Management Software Industry Volume (K Unit) Forecast, by Application 2019 & 2032
- Table 73: Italy MEA Talent Management Software Industry Revenue (Million) Forecast, by Application 2019 & 2032
- Table 74: Italy MEA Talent Management Software Industry Volume (K Unit) Forecast, by Application 2019 & 2032
- Table 75: Spain MEA Talent Management Software Industry Revenue (Million) Forecast, by Application 2019 & 2032
- Table 76: Spain MEA Talent Management Software Industry Volume (K Unit) Forecast, by Application 2019 & 2032
- Table 77: Russia MEA Talent Management Software Industry Revenue (Million) Forecast, by Application 2019 & 2032
- Table 78: Russia MEA Talent Management Software Industry Volume (K Unit) Forecast, by Application 2019 & 2032
- Table 79: Benelux MEA Talent Management Software Industry Revenue (Million) Forecast, by Application 2019 & 2032
- Table 80: Benelux MEA Talent Management Software Industry Volume (K Unit) Forecast, by Application 2019 & 2032
- Table 81: Nordics MEA Talent Management Software Industry Revenue (Million) Forecast, by Application 2019 & 2032
- Table 82: Nordics MEA Talent Management Software Industry Volume (K Unit) Forecast, by Application 2019 & 2032
- Table 83: Rest of Europe MEA Talent Management Software Industry Revenue (Million) Forecast, by Application 2019 & 2032
- Table 84: Rest of Europe MEA Talent Management Software Industry Volume (K Unit) Forecast, by Application 2019 & 2032
- Table 85: Global MEA Talent Management Software Industry Revenue Million Forecast, by Type 2019 & 2032
- Table 86: Global MEA Talent Management Software Industry Volume K Unit Forecast, by Type 2019 & 2032
- Table 87: Global MEA Talent Management Software Industry Revenue Million Forecast, by Deployment Mode 2019 & 2032
- Table 88: Global MEA Talent Management Software Industry Volume K Unit Forecast, by Deployment Mode 2019 & 2032
- Table 89: Global MEA Talent Management Software Industry Revenue Million Forecast, by End-user Vertical 2019 & 2032
- Table 90: Global MEA Talent Management Software Industry Volume K Unit Forecast, by End-user Vertical 2019 & 2032
- Table 91: Global MEA Talent Management Software Industry Revenue Million Forecast, by Country 2019 & 2032
- Table 92: Global MEA Talent Management Software Industry Volume K Unit Forecast, by Country 2019 & 2032
- Table 93: Turkey MEA Talent Management Software Industry Revenue (Million) Forecast, by Application 2019 & 2032
- Table 94: Turkey MEA Talent Management Software Industry Volume (K Unit) Forecast, by Application 2019 & 2032
- Table 95: Israel MEA Talent Management Software Industry Revenue (Million) Forecast, by Application 2019 & 2032
- Table 96: Israel MEA Talent Management Software Industry Volume (K Unit) Forecast, by Application 2019 & 2032
- Table 97: GCC MEA Talent Management Software Industry Revenue (Million) Forecast, by Application 2019 & 2032
- Table 98: GCC MEA Talent Management Software Industry Volume (K Unit) Forecast, by Application 2019 & 2032
- Table 99: North Africa MEA Talent Management Software Industry Revenue (Million) Forecast, by Application 2019 & 2032
- Table 100: North Africa MEA Talent Management Software Industry Volume (K Unit) Forecast, by Application 2019 & 2032
- Table 101: South Africa MEA Talent Management Software Industry Revenue (Million) Forecast, by Application 2019 & 2032
- Table 102: South Africa MEA Talent Management Software Industry Volume (K Unit) Forecast, by Application 2019 & 2032
- Table 103: Rest of Middle East & Africa MEA Talent Management Software Industry Revenue (Million) Forecast, by Application 2019 & 2032
- Table 104: Rest of Middle East & Africa MEA Talent Management Software Industry Volume (K Unit) Forecast, by Application 2019 & 2032
- Table 105: Global MEA Talent Management Software Industry Revenue Million Forecast, by Type 2019 & 2032
- Table 106: Global MEA Talent Management Software Industry Volume K Unit Forecast, by Type 2019 & 2032
- Table 107: Global MEA Talent Management Software Industry Revenue Million Forecast, by Deployment Mode 2019 & 2032
- Table 108: Global MEA Talent Management Software Industry Volume K Unit Forecast, by Deployment Mode 2019 & 2032
- Table 109: Global MEA Talent Management Software Industry Revenue Million Forecast, by End-user Vertical 2019 & 2032
- Table 110: Global MEA Talent Management Software Industry Volume K Unit Forecast, by End-user Vertical 2019 & 2032
- Table 111: Global MEA Talent Management Software Industry Revenue Million Forecast, by Country 2019 & 2032
- Table 112: Global MEA Talent Management Software Industry Volume K Unit Forecast, by Country 2019 & 2032
- Table 113: China MEA Talent Management Software Industry Revenue (Million) Forecast, by Application 2019 & 2032
- Table 114: China MEA Talent Management Software Industry Volume (K Unit) Forecast, by Application 2019 & 2032
- Table 115: India MEA Talent Management Software Industry Revenue (Million) Forecast, by Application 2019 & 2032
- Table 116: India MEA Talent Management Software Industry Volume (K Unit) Forecast, by Application 2019 & 2032
- Table 117: Japan MEA Talent Management Software Industry Revenue (Million) Forecast, by Application 2019 & 2032
- Table 118: Japan MEA Talent Management Software Industry Volume (K Unit) Forecast, by Application 2019 & 2032
- Table 119: South Korea MEA Talent Management Software Industry Revenue (Million) Forecast, by Application 2019 & 2032
- Table 120: South Korea MEA Talent Management Software Industry Volume (K Unit) Forecast, by Application 2019 & 2032
- Table 121: ASEAN MEA Talent Management Software Industry Revenue (Million) Forecast, by Application 2019 & 2032
- Table 122: ASEAN MEA Talent Management Software Industry Volume (K Unit) Forecast, by Application 2019 & 2032
- Table 123: Oceania MEA Talent Management Software Industry Revenue (Million) Forecast, by Application 2019 & 2032
- Table 124: Oceania MEA Talent Management Software Industry Volume (K Unit) Forecast, by Application 2019 & 2032
- Table 125: Rest of Asia Pacific MEA Talent Management Software Industry Revenue (Million) Forecast, by Application 2019 & 2032
- Table 126: Rest of Asia Pacific MEA Talent Management Software Industry Volume (K Unit) Forecast, by Application 2019 & 2032
Frequently Asked Questions
1. What is the projected Compound Annual Growth Rate (CAGR) of the MEA Talent Management Software Industry?
The projected CAGR is approximately 8.38%.
2. Which companies are prominent players in the MEA Talent Management Software Industry?
Key companies in the market include Workday Inc, Reflexis Systems Inc, NICE Systems Ltd, Roubler UK Limited Company, IBM Corporation, Blue Yonder Group Inc, Active Operations Management International LLP, Sage Group PLC, Kronos Incorporated (UKG Inc ), 7shifts, ServiceMax Inc, Infor Group, Atoss Software AG, Oracle Corporation, ADP LLC, Tamigo UK Ltd, SISQUAL, WorkForce Software LLC, SAP SE, Mitrefinch Ltd, Kirona Solutions Limited.
3. What are the main segments of the MEA Talent Management Software Industry?
The market segments include Type, Deployment Mode, End-user Vertical.
4. Can you provide details about the market size?
The market size is estimated to be USD 0.41 Million as of 2022.
5. What are some drivers contributing to market growth?
Increasing Adoption of Internet of Things (IoT) and Cloud-based Solutions Expanding the Market; Growing Adoption of Analytical Solutions and WFM by SMEs Driving Market Growth.
6. What are the notable trends driving market growth?
Workforce Scheduling and Workforce Analytics Type is Expected to Hold Significant Market Share.
7. Are there any restraints impacting market growth?
; Availability of open-source alternatives.
8. Can you provide examples of recent developments in the market?
January 2023: BrightPlan, a United States-based company, launched a new workforce financial wellness gauge, providing data-driven insights for organizations to uncover key workforce strengths and gaps in the Middle East and Africa region. BrightPlan's Total Financial Wellness solution, powered by patented AI technology, transforms raw data into valuable insights and advice for employers and employees.
9. What pricing options are available for accessing the report?
Pricing options include single-user, multi-user, and enterprise licenses priced at USD 4750, USD 4950, and USD 6800 respectively.
10. Is the market size provided in terms of value or volume?
The market size is provided in terms of value, measured in Million and volume, measured in K Unit.
11. Are there any specific market keywords associated with the report?
Yes, the market keyword associated with the report is "MEA Talent Management Software Industry," which aids in identifying and referencing the specific market segment covered.
12. How do I determine which pricing option suits my needs best?
The pricing options vary based on user requirements and access needs. Individual users may opt for single-user licenses, while businesses requiring broader access may choose multi-user or enterprise licenses for cost-effective access to the report.
13. Are there any additional resources or data provided in the MEA Talent Management Software Industry report?
While the report offers comprehensive insights, it's advisable to review the specific contents or supplementary materials provided to ascertain if additional resources or data are available.
14. How can I stay updated on further developments or reports in the MEA Talent Management Software Industry?
To stay informed about further developments, trends, and reports in the MEA Talent Management Software Industry, consider subscribing to industry newsletters, following relevant companies and organizations, or regularly checking reputable industry news sources and publications.
Methodology
Step 1 - Identification of Relevant Samples Size from Population Database


Step 2 - Approaches for Defining Global Market Size (Value, Volume* & Price*)

Note*: In applicable scenarios
Step 3 - Data Sources
Primary Research
- Web Analytics
- Survey Reports
- Research Institute
- Latest Research Reports
- Opinion Leaders
Secondary Research
- Annual Reports
- White Paper
- Latest Press Release
- Industry Association
- Paid Database
- Investor Presentations

Step 4 - Data Triangulation
Involves using different sources of information in order to increase the validity of a study
These sources are likely to be stakeholders in a program - participants, other researchers, program staff, other community members, and so on.
Then we put all data in single framework & apply various statistical tools to find out the dynamic on the market.
During the analysis stage, feedback from the stakeholder groups would be compared to determine areas of agreement as well as areas of divergence


