
Key Insights
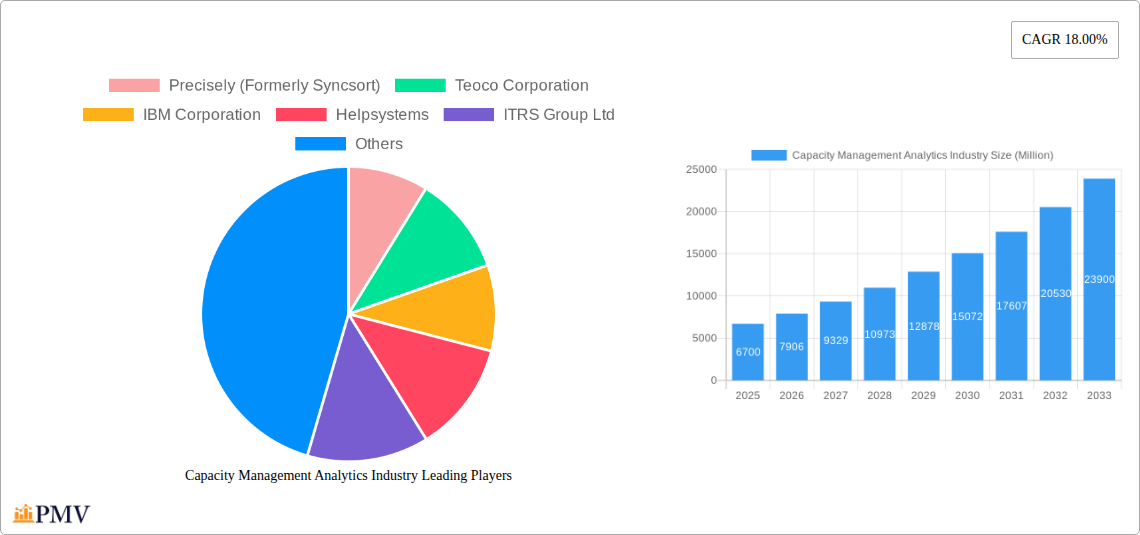
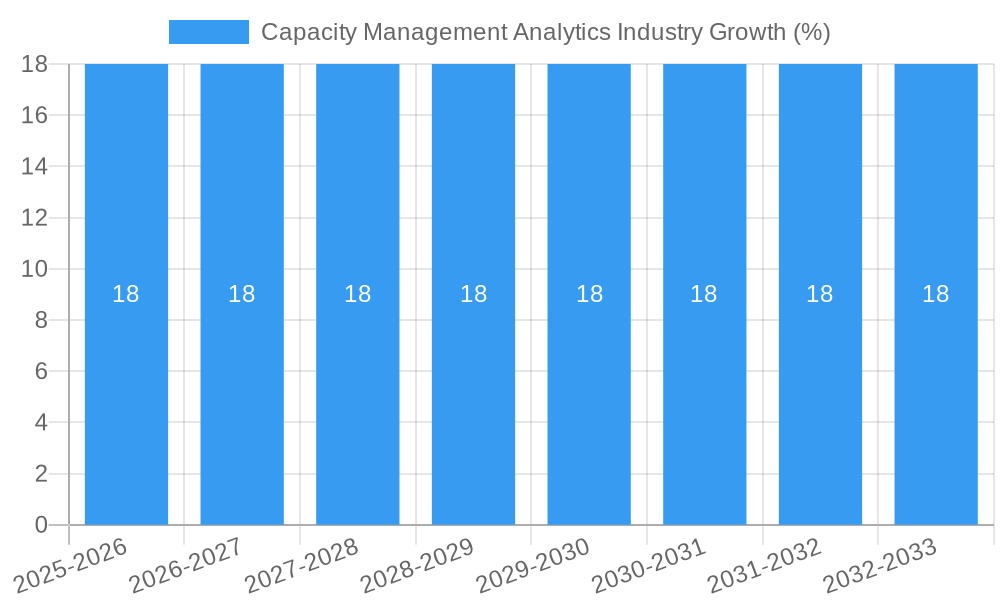
The Capacity Management Analytics market is poised for significant expansion, projected to reach approximately \$15,000 million by the end of the forecast period, driven by a remarkable Compound Annual Growth Rate (CAGR) of 18.00%. This robust growth is primarily fueled by the escalating complexity of IT infrastructures, the increasing adoption of cloud computing, and the growing demand for data-driven decision-making across various industries. Businesses are increasingly recognizing the critical need for efficient resource utilization, performance optimization, and cost reduction, making capacity management analytics an indispensable tool. Key drivers include the proliferation of Big Data, the rise of Artificial Intelligence and Machine Learning for predictive analytics, and the ongoing digital transformation initiatives across sectors like IT & Telecom, Healthcare, Manufacturing, BFSI, and Government. As organizations grapple with dynamic workloads and the need to anticipate future resource requirements, the demand for sophisticated capacity management solutions will only intensify.
The market is characterized by a diverse range of solutions, with both on-premise and cloud deployments catering to varied organizational needs. While on-premise solutions offer greater control and security for sensitive data, the scalability and cost-effectiveness of cloud-based analytics are driving its rapid adoption. Emerging trends such as the integration of AI/ML for advanced forecasting, real-time monitoring, and automated resource allocation are shaping the competitive landscape. However, the market also faces certain restraints, including the initial investment costs associated with advanced analytics tools, the scarcity of skilled professionals capable of managing and interpreting complex data, and concerns regarding data privacy and security, particularly for cloud deployments. Despite these challenges, the overarching benefits of improved operational efficiency, enhanced service delivery, and proactive problem-solving are expected to propel the market's sustained growth.
This in-depth Capacity Management Analytics Industry report provides an exhaustive analysis of the global market landscape, meticulously examining capacity planning solutions, IT resource optimization, performance monitoring tools, and predictive analytics for infrastructure management. Spanning the study period of 2019–2033, with a base year and estimated year of 2025, and a forecast period from 2025–2033, this report delves into historical trends and future projections. We leverage advanced analytics to uncover critical insights into market dynamics, key players, emerging technologies, and growth opportunities within this vital sector. The report includes comprehensive data on On-premise and Cloud deployment models, alongside detailed segmentations across IT & Telecom, Healthcare, Manufacturing, BFSI, Government, and Other End-user Industries.
Capacity Management Analytics Industry Market Structure & Competitive Dynamics
The Capacity Management Analytics Industry exhibits a moderately concentrated market structure, characterized by the presence of established global players and a growing number of innovative niche providers. The innovation ecosystem is vibrant, driven by the increasing demand for AI-powered capacity planning, cloud cost optimization, and workload automation. Regulatory frameworks are primarily focused on data privacy and security, influencing how analytics are deployed and managed. Product substitutes are emerging, particularly in broader IT operations management (ITOM) suites that incorporate capacity planning capabilities. End-user trends highlight a strong shift towards cloud-native solutions and the adoption of hybrid cloud environments, necessitating robust analytics for managing distributed resources. Mergers and Acquisitions (M&A) activities are strategic, aimed at consolidating market share, acquiring advanced technologies, and expanding service offerings. Key M&A deal values in recent years have ranged from tens of millions to over a billion USD, demonstrating significant investor confidence. Market share is currently distributed, with leading players holding substantial portions, but new entrants are disrupting established positions through specialized offerings. The competitive landscape is shaped by factors such as technological innovation, pricing strategies, customer support, and the ability to integrate with existing IT infrastructure.
- Market Concentration: Moderate, with a mix of large enterprise vendors and specialized solution providers.
- Innovation Ecosystem: Driven by AI, ML, cloud optimization, and automation.
- Regulatory Frameworks: Data privacy (e.g., GDPR, CCPA) and industry-specific compliance.
- Product Substitutes: Broader ITOM suites, manual processes (decreasingly).
- End-User Trends: Cloud adoption (public, private, hybrid), multi-cloud strategies, edge computing.
- M&A Activities: Strategic acquisitions for technology, market access, and talent.
- Example M&A Deal Value: Over $500 Million for a leading cloud optimization analytics firm.
Capacity Management Analytics Industry Industry Trends & Insights
The Capacity Management Analytics Industry is experiencing robust growth, driven by an escalating need for efficient IT resource utilization, cost containment, and performance assurance in increasingly complex digital infrastructures. The Compound Annual Growth Rate (CAGR) is projected to be robust, estimated at xx% from 2025–2033, reflecting the critical role of these solutions in modern business operations. A significant market penetration of software-defined infrastructure and containerization technologies like Kubernetes is creating new challenges and opportunities for capacity analytics. Organizations are moving beyond reactive monitoring to proactive and predictive approaches, leveraging machine learning algorithms to forecast resource demands, identify bottlenecks, and optimize spending. The proliferation of big data analytics within IT environments further fuels the demand for sophisticated capacity management tools capable of processing vast datasets.
Consumer preferences are evolving towards SaaS-based capacity management solutions that offer scalability, flexibility, and reduced upfront investment. AI-driven insights are becoming paramount, enabling businesses to automatically adjust resource allocations, right-size instances, and prevent performance degradation or over-provisioning. The competitive dynamics are intensifying, with vendors differentiating themselves through advanced features such as real-time anomaly detection, predictive scaling, cost allocation and chargeback capabilities, and deep integrations with cloud platforms (AWS, Azure, GCP) and private cloud technologies. The increasing adoption of DevOps practices also necessitates integrated capacity planning that aligns with agile development cycles, ensuring that infrastructure can seamlessly scale to meet application demands. Furthermore, the growing sophistication of cyber threats is indirectly boosting the need for capacity management by highlighting the importance of resilient and optimally performing infrastructure. The shift to remote work models has also amplified the need for robust and scalable IT resources, making effective capacity management a strategic imperative. This trend is expected to continue as organizations embrace flexible work policies and invest in the underlying infrastructure to support them. The integration of FinOps principles into capacity management is another key trend, ensuring that IT operations are not only efficient but also cost-effective.
Dominant Markets & Segments in Capacity Management Analytics Industry
The IT & Telecom end-user industry stands out as the dominant market segment within the Capacity Management Analytics Industry, driven by the inherent complexity and constant evolution of their digital infrastructure. This sector's heavy reliance on data processing, network bandwidth, and computing power necessitates continuous monitoring and optimization, making sophisticated capacity analytics indispensable. The sheer volume of data generated and consumed, coupled with the need for high availability and low latency, positions IT & Telecom as the primary adopter of these solutions.
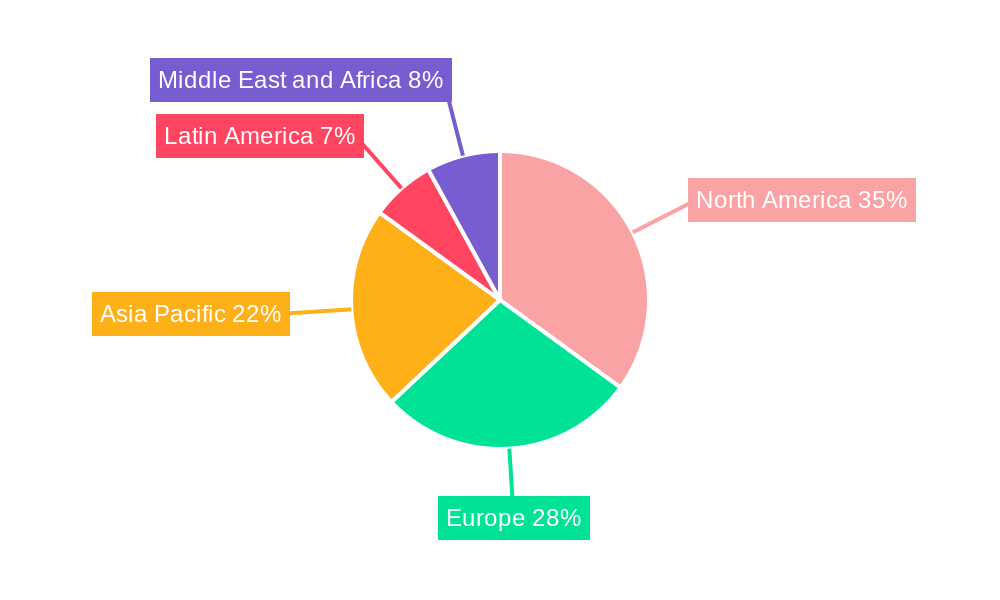
- Leading Region: North America is currently the dominant region, attributed to its early adoption of advanced technologies, significant presence of major cloud providers and technology companies, and a strong regulatory environment supporting data-driven decision-making. The substantial investments in digital transformation initiatives across various industries within the US and Canada underpin this leadership.
- Leading Country: The United States leads the global market, fueled by its robust technological ecosystem, extensive cloud infrastructure, and a proactive approach to IT modernization. The presence of major cloud service providers and a large enterprise base seeking to optimize cloud spend and performance further solidifies its dominant position.
- Dominant Deployment: Cloud deployment models are rapidly gaining dominance, accounting for a significant portion of the market share. The scalability, agility, and cost-effectiveness offered by cloud platforms are compelling drivers for organizations to migrate their capacity management analytics to cloud-based solutions.
- Key Drivers for Cloud Dominance:
- Scalability & Elasticity: Ability to dynamically adjust resources based on demand.
- Cost Efficiency: Pay-as-you-go models and reduced infrastructure overhead.
- Faster Deployment: Quick provisioning and ease of access to advanced tools.
- Managed Services: Reduced burden of infrastructure maintenance and updates.
- Integration Capabilities: Seamless integration with major cloud providers (AWS, Azure, GCP).
- Key Drivers for Cloud Dominance:
- Dominant End-user Industry: IT & Telecom
- Key Drivers for IT & Telecom Dominance:
- Massive Data Volumes: Handling and processing of extensive datasets.
- High Availability & Performance Demands: Critical need for uninterrupted service and optimal speeds.
- Rapid Technological Advancements: Constant need to adapt and scale infrastructure.
- Network Optimization: Managing complex network infrastructure for seamless connectivity.
- Cloud Migration & Hybrid Cloud Management: Expertise in managing distributed resources.
- Key Drivers for IT & Telecom Dominance:
- Other Significant End-user Industries:
- BFSI: Driven by stringent regulatory compliance, high transaction volumes, and the need for secure, reliable infrastructure for financial services.
- Healthcare: Increasing adoption of EMR/EHR systems, telehealth services, and AI in diagnostics requires robust capacity management for patient data and critical applications.
- Manufacturing: The rise of Industry 4.0, IoT devices, and smart factories necessitates precise capacity planning for operational efficiency and automation.
- Government: Growing digital transformation initiatives, public service delivery enhancements, and cybersecurity demands are spurring the adoption of capacity management analytics.
Capacity Management Analytics Industry Product Innovations
Product innovations in the Capacity Management Analytics Industry are heavily focused on leveraging Artificial Intelligence (AI) and Machine Learning (ML) for predictive insights and automated optimization. Key developments include enhanced cost allocation and optimization tools for cloud environments, offering granular visibility into spending patterns and identifying opportunities for savings. Advanced performance monitoring solutions now provide real-time anomaly detection and root-cause analysis, significantly reducing Mean Time To Resolution (MTTR). Furthermore, the integration of AIOps (Artificial Intelligence for IT Operations) capabilities is transforming how organizations manage their infrastructure, enabling proactive problem-solving and self-healing systems. Competitive advantages are being built on the ability to offer seamless integration with multi-cloud and hybrid environments, providing a unified view of all IT resources.
Report Segmentation & Scope
This report provides a comprehensive segmentation of the Capacity Management Analytics Industry, offering detailed insights into each critical area. The scope encompasses all major deployment models and end-user industries, ensuring a holistic market view.
- Deployment:
- On-premise: This segment analyzes the market for solutions deployed within an organization's own data centers, focusing on traditional infrastructure management and control. Growth projections are moderate, with continued adoption in highly regulated sectors or organizations with specific data sovereignty needs.
- Cloud: This segment examines the rapidly expanding market for cloud-based capacity management analytics, including public, private, and hybrid cloud environments. Expected to exhibit high growth rates due to scalability, flexibility, and cost-efficiency.
- End-user Industry:
- IT & Telecom: Detailed analysis of this segment's unique capacity demands, growth projections, and competitive dynamics. Expected to remain the largest and fastest-growing segment.
- Healthcare: Focus on specific needs related to patient data, compliance, and the growing adoption of telehealth. Moderate to significant growth anticipated.
- Manufacturing: Analysis of Industry 4.0, IoT, and automation's impact on capacity requirements. Steady growth projected.
- BFSI: Examination of regulatory pressures, transaction volumes, and security needs. Strong and consistent growth expected.
- Government: Insights into digital transformation initiatives and public service delivery. Significant growth potential driven by modernization efforts.
- Other End-user Industries: A consolidated view of segments like retail, education, and media, which are also increasingly reliant on efficient capacity management.
Key Drivers of Capacity Management Analytics Industry Growth
The Capacity Management Analytics Industry is propelled by several potent growth drivers. The relentless expansion of digital transformation initiatives across all sectors necessitates robust IT infrastructure, driving demand for efficient resource management. The pervasive adoption of cloud computing and hybrid cloud strategies, while offering agility, creates significant complexity that can only be managed with advanced analytics. Furthermore, the escalating volume and velocity of data being generated demand sophisticated tools for performance monitoring and capacity planning to ensure seamless operations. Economic factors like the pressure to optimize IT spending and control cloud costs are also significant, pushing organizations towards analytics solutions that promise cost savings and better resource utilization. Technological advancements, particularly in AI and ML, are enabling more predictive and proactive capacity management, moving beyond reactive problem-solving.
Challenges in the Capacity Management Analytics Industry Sector
Despite robust growth, the Capacity Management Analytics Industry faces several challenges. The inherent complexity of integrating disparate IT systems, including legacy on-premise infrastructure and multiple cloud environments, poses a significant hurdle for comprehensive analytics. Talent shortage in skilled professionals capable of deploying, managing, and interpreting capacity analytics is another restraint. Data security and privacy concerns, especially when dealing with sensitive organizational data, can lead to hesitation in adopting cloud-based solutions. The rapid pace of technological change also means that analytics tools need constant updates and integration to remain effective, adding to implementation and maintenance costs. Cost of implementation and subscription fees can be a barrier for smaller organizations.
Leading Players in the Capacity Management Analytics Industry Market
- Precisely (Formerly Syncsort)
- Teoco Corporation
- IBM Corporation
- Helpsystems
- ITRS Group Ltd
- Hewlett Packard Enterprise Company
- Broadcom Inc
- BMC Software Inc
- Riverbed Technology Inc
- NetApp Inc
- CPT Global Limited
- VMware Inc
Key Developments in Capacity Management Analytics Industry Sector
- 2023 Q4: Launch of advanced AI-driven predictive analytics module by BMC Software Inc., enhancing proactive capacity planning and resource allocation.
- 2024 Q1: Hewlett Packard Enterprise Company announces strategic partnership with a leading cloud provider to offer integrated hybrid cloud capacity management solutions.
- 2024 Q2: IBM Corporation unveils new AIOps capabilities for its IT operations management suite, enabling automated capacity forecasting and anomaly detection.
- 2024 Q3: Broadcom Inc. acquires a prominent cloud cost optimization analytics company, strengthening its portfolio for cloud financial management.
- 2024 Q4: VMware Inc. enhances its cloud management platform with sophisticated tools for multi-cloud capacity optimization and cost visibility.
Strategic Capacity Management Analytics Industry Market Outlook
The strategic outlook for the Capacity Management Analytics Industry is highly positive, driven by the indispensable role these solutions play in navigating the complexities of modern IT environments. Future growth will be accelerated by the continued evolution of AI and ML, leading to more intelligent, autonomous, and predictive capacity management systems. The increasing adoption of edge computing and the Internet of Things (IoT) will create new frontiers for capacity analytics, requiring specialized solutions to manage distributed and resource-constrained environments. Strategic opportunities lie in the deepening integration of FinOps principles, enabling a stronger alignment between IT operations and financial governance. Furthermore, the focus on sustainability and energy efficiency within IT infrastructure presents a significant growth avenue for analytics that can optimize resource consumption. Companies that can offer seamless, end-to-end visibility and control across hybrid and multi-cloud ecosystems, while providing actionable, data-driven insights, will be best positioned for success.
Capacity Management Analytics Industry Segmentation
-
1. Deployment
- 1.1. On-premise
- 1.2. Cloud
-
2. End-user Industry
- 2.1. IT & Telecom
- 2.2. Healthcare
- 2.3. Manufacturing
- 2.4. BFSI
- 2.5. Government
- 2.6. Other End-user Industries
Capacity Management Analytics Industry Segmentation By Geography
- 1. North America
- 2. Europe
- 3. Asia Pacific
- 4. Latin America
- 5. Middle East and Africa
Capacity Management Analytics Industry REPORT HIGHLIGHTS
| Aspects | Details |
|---|---|
| Study Period | 2019-2033 |
| Base Year | 2024 |
| Estimated Year | 2025 |
| Forecast Period | 2025-2033 |
| Historical Period | 2019-2024 |
| Growth Rate | CAGR of 18.00% from 2019-2033 |
| Segmentation |
|
Table of Contents
- 1. Introduction
- 1.1. Research Scope
- 1.2. Market Segmentation
- 1.3. Research Methodology
- 1.4. Definitions and Assumptions
- 2. Executive Summary
- 2.1. Introduction
- 3. Market Dynamics
- 3.1. Introduction
- 3.2. Market Drivers
- 3.2.1. ; Increasing Need for Optimization and Effective Utilization of IT Infrastructures; Increasing Complexities in IT Infrastructures
- 3.3. Market Restrains
- 3.3.1. ; Lower Adoption Among the SMEs
- 3.4. Market Trends
- 3.4.1. Manufacturing Segment is Expected to Witness Significant Growth
- 4. Market Factor Analysis
- 4.1. Porters Five Forces
- 4.2. Supply/Value Chain
- 4.3. PESTEL analysis
- 4.4. Market Entropy
- 4.5. Patent/Trademark Analysis
- 5. Global Capacity Management Analytics Industry Analysis, Insights and Forecast, 2019-2031
- 5.1. Market Analysis, Insights and Forecast - by Deployment
- 5.1.1. On-premise
- 5.1.2. Cloud
- 5.2. Market Analysis, Insights and Forecast - by End-user Industry
- 5.2.1. IT & Telecom
- 5.2.2. Healthcare
- 5.2.3. Manufacturing
- 5.2.4. BFSI
- 5.2.5. Government
- 5.2.6. Other End-user Industries
- 5.3. Market Analysis, Insights and Forecast - by Region
- 5.3.1. North America
- 5.3.2. Europe
- 5.3.3. Asia Pacific
- 5.3.4. Latin America
- 5.3.5. Middle East and Africa
- 5.1. Market Analysis, Insights and Forecast - by Deployment
- 6. North America Capacity Management Analytics Industry Analysis, Insights and Forecast, 2019-2031
- 6.1. Market Analysis, Insights and Forecast - by Deployment
- 6.1.1. On-premise
- 6.1.2. Cloud
- 6.2. Market Analysis, Insights and Forecast - by End-user Industry
- 6.2.1. IT & Telecom
- 6.2.2. Healthcare
- 6.2.3. Manufacturing
- 6.2.4. BFSI
- 6.2.5. Government
- 6.2.6. Other End-user Industries
- 6.1. Market Analysis, Insights and Forecast - by Deployment
- 7. Europe Capacity Management Analytics Industry Analysis, Insights and Forecast, 2019-2031
- 7.1. Market Analysis, Insights and Forecast - by Deployment
- 7.1.1. On-premise
- 7.1.2. Cloud
- 7.2. Market Analysis, Insights and Forecast - by End-user Industry
- 7.2.1. IT & Telecom
- 7.2.2. Healthcare
- 7.2.3. Manufacturing
- 7.2.4. BFSI
- 7.2.5. Government
- 7.2.6. Other End-user Industries
- 7.1. Market Analysis, Insights and Forecast - by Deployment
- 8. Asia Pacific Capacity Management Analytics Industry Analysis, Insights and Forecast, 2019-2031
- 8.1. Market Analysis, Insights and Forecast - by Deployment
- 8.1.1. On-premise
- 8.1.2. Cloud
- 8.2. Market Analysis, Insights and Forecast - by End-user Industry
- 8.2.1. IT & Telecom
- 8.2.2. Healthcare
- 8.2.3. Manufacturing
- 8.2.4. BFSI
- 8.2.5. Government
- 8.2.6. Other End-user Industries
- 8.1. Market Analysis, Insights and Forecast - by Deployment
- 9. Latin America Capacity Management Analytics Industry Analysis, Insights and Forecast, 2019-2031
- 9.1. Market Analysis, Insights and Forecast - by Deployment
- 9.1.1. On-premise
- 9.1.2. Cloud
- 9.2. Market Analysis, Insights and Forecast - by End-user Industry
- 9.2.1. IT & Telecom
- 9.2.2. Healthcare
- 9.2.3. Manufacturing
- 9.2.4. BFSI
- 9.2.5. Government
- 9.2.6. Other End-user Industries
- 9.1. Market Analysis, Insights and Forecast - by Deployment
- 10. Middle East and Africa Capacity Management Analytics Industry Analysis, Insights and Forecast, 2019-2031
- 10.1. Market Analysis, Insights and Forecast - by Deployment
- 10.1.1. On-premise
- 10.1.2. Cloud
- 10.2. Market Analysis, Insights and Forecast - by End-user Industry
- 10.2.1. IT & Telecom
- 10.2.2. Healthcare
- 10.2.3. Manufacturing
- 10.2.4. BFSI
- 10.2.5. Government
- 10.2.6. Other End-user Industries
- 10.1. Market Analysis, Insights and Forecast - by Deployment
- 11. North America Capacity Management Analytics Industry Analysis, Insights and Forecast, 2019-2031
- 11.1. Market Analysis, Insights and Forecast - By Country/Sub-region
- 11.1.1 United States
- 11.1.2 Canada
- 11.1.3 Mexico
- 12. Europe Capacity Management Analytics Industry Analysis, Insights and Forecast, 2019-2031
- 12.1. Market Analysis, Insights and Forecast - By Country/Sub-region
- 12.1.1 Germany
- 12.1.2 United Kingdom
- 12.1.3 France
- 12.1.4 Spain
- 12.1.5 Italy
- 12.1.6 Spain
- 12.1.7 Belgium
- 12.1.8 Netherland
- 12.1.9 Nordics
- 12.1.10 Rest of Europe
- 13. Asia Pacific Capacity Management Analytics Industry Analysis, Insights and Forecast, 2019-2031
- 13.1. Market Analysis, Insights and Forecast - By Country/Sub-region
- 13.1.1 China
- 13.1.2 Japan
- 13.1.3 India
- 13.1.4 South Korea
- 13.1.5 Southeast Asia
- 13.1.6 Australia
- 13.1.7 Indonesia
- 13.1.8 Phillipes
- 13.1.9 Singapore
- 13.1.10 Thailandc
- 13.1.11 Rest of Asia Pacific
- 14. South America Capacity Management Analytics Industry Analysis, Insights and Forecast, 2019-2031
- 14.1. Market Analysis, Insights and Forecast - By Country/Sub-region
- 14.1.1 Brazil
- 14.1.2 Argentina
- 14.1.3 Peru
- 14.1.4 Chile
- 14.1.5 Colombia
- 14.1.6 Ecuador
- 14.1.7 Venezuela
- 14.1.8 Rest of South America
- 15. North America Capacity Management Analytics Industry Analysis, Insights and Forecast, 2019-2031
- 15.1. Market Analysis, Insights and Forecast - By Country/Sub-region
- 15.1.1 United States
- 15.1.2 Canada
- 15.1.3 Mexico
- 16. MEA Capacity Management Analytics Industry Analysis, Insights and Forecast, 2019-2031
- 16.1. Market Analysis, Insights and Forecast - By Country/Sub-region
- 16.1.1 United Arab Emirates
- 16.1.2 Saudi Arabia
- 16.1.3 South Africa
- 16.1.4 Rest of Middle East and Africa
- 17. Competitive Analysis
- 17.1. Global Market Share Analysis 2024
- 17.2. Company Profiles
- 17.2.1 Precisely (Formerly Syncsort)
- 17.2.1.1. Overview
- 17.2.1.2. Products
- 17.2.1.3. SWOT Analysis
- 17.2.1.4. Recent Developments
- 17.2.1.5. Financials (Based on Availability)
- 17.2.2 Teoco Corporation
- 17.2.2.1. Overview
- 17.2.2.2. Products
- 17.2.2.3. SWOT Analysis
- 17.2.2.4. Recent Developments
- 17.2.2.5. Financials (Based on Availability)
- 17.2.3 IBM Corporation
- 17.2.3.1. Overview
- 17.2.3.2. Products
- 17.2.3.3. SWOT Analysis
- 17.2.3.4. Recent Developments
- 17.2.3.5. Financials (Based on Availability)
- 17.2.4 Helpsystems
- 17.2.4.1. Overview
- 17.2.4.2. Products
- 17.2.4.3. SWOT Analysis
- 17.2.4.4. Recent Developments
- 17.2.4.5. Financials (Based on Availability)
- 17.2.5 ITRS Group Ltd
- 17.2.5.1. Overview
- 17.2.5.2. Products
- 17.2.5.3. SWOT Analysis
- 17.2.5.4. Recent Developments
- 17.2.5.5. Financials (Based on Availability)
- 17.2.6 Hewlett Packard Enterprise Company
- 17.2.6.1. Overview
- 17.2.6.2. Products
- 17.2.6.3. SWOT Analysis
- 17.2.6.4. Recent Developments
- 17.2.6.5. Financials (Based on Availability)
- 17.2.7 Broadcom Inc
- 17.2.7.1. Overview
- 17.2.7.2. Products
- 17.2.7.3. SWOT Analysis
- 17.2.7.4. Recent Developments
- 17.2.7.5. Financials (Based on Availability)
- 17.2.8 BMC Software Inc
- 17.2.8.1. Overview
- 17.2.8.2. Products
- 17.2.8.3. SWOT Analysis
- 17.2.8.4. Recent Developments
- 17.2.8.5. Financials (Based on Availability)
- 17.2.9 Riverbed Technology Inc
- 17.2.9.1. Overview
- 17.2.9.2. Products
- 17.2.9.3. SWOT Analysis
- 17.2.9.4. Recent Developments
- 17.2.9.5. Financials (Based on Availability)
- 17.2.10 NetApp Inc
- 17.2.10.1. Overview
- 17.2.10.2. Products
- 17.2.10.3. SWOT Analysis
- 17.2.10.4. Recent Developments
- 17.2.10.5. Financials (Based on Availability)
- 17.2.11 CPT Global Limited*List Not Exhaustive
- 17.2.11.1. Overview
- 17.2.11.2. Products
- 17.2.11.3. SWOT Analysis
- 17.2.11.4. Recent Developments
- 17.2.11.5. Financials (Based on Availability)
- 17.2.12 VMware Inc
- 17.2.12.1. Overview
- 17.2.12.2. Products
- 17.2.12.3. SWOT Analysis
- 17.2.12.4. Recent Developments
- 17.2.12.5. Financials (Based on Availability)
- 17.2.1 Precisely (Formerly Syncsort)
List of Figures
- Figure 1: Global Capacity Management Analytics Industry Revenue Breakdown (Million, %) by Region 2024 & 2032
- Figure 2: North America Capacity Management Analytics Industry Revenue (Million), by Country 2024 & 2032
- Figure 3: North America Capacity Management Analytics Industry Revenue Share (%), by Country 2024 & 2032
- Figure 4: Europe Capacity Management Analytics Industry Revenue (Million), by Country 2024 & 2032
- Figure 5: Europe Capacity Management Analytics Industry Revenue Share (%), by Country 2024 & 2032
- Figure 6: Asia Pacific Capacity Management Analytics Industry Revenue (Million), by Country 2024 & 2032
- Figure 7: Asia Pacific Capacity Management Analytics Industry Revenue Share (%), by Country 2024 & 2032
- Figure 8: South America Capacity Management Analytics Industry Revenue (Million), by Country 2024 & 2032
- Figure 9: South America Capacity Management Analytics Industry Revenue Share (%), by Country 2024 & 2032
- Figure 10: North America Capacity Management Analytics Industry Revenue (Million), by Country 2024 & 2032
- Figure 11: North America Capacity Management Analytics Industry Revenue Share (%), by Country 2024 & 2032
- Figure 12: MEA Capacity Management Analytics Industry Revenue (Million), by Country 2024 & 2032
- Figure 13: MEA Capacity Management Analytics Industry Revenue Share (%), by Country 2024 & 2032
- Figure 14: North America Capacity Management Analytics Industry Revenue (Million), by Deployment 2024 & 2032
- Figure 15: North America Capacity Management Analytics Industry Revenue Share (%), by Deployment 2024 & 2032
- Figure 16: North America Capacity Management Analytics Industry Revenue (Million), by End-user Industry 2024 & 2032
- Figure 17: North America Capacity Management Analytics Industry Revenue Share (%), by End-user Industry 2024 & 2032
- Figure 18: North America Capacity Management Analytics Industry Revenue (Million), by Country 2024 & 2032
- Figure 19: North America Capacity Management Analytics Industry Revenue Share (%), by Country 2024 & 2032
- Figure 20: Europe Capacity Management Analytics Industry Revenue (Million), by Deployment 2024 & 2032
- Figure 21: Europe Capacity Management Analytics Industry Revenue Share (%), by Deployment 2024 & 2032
- Figure 22: Europe Capacity Management Analytics Industry Revenue (Million), by End-user Industry 2024 & 2032
- Figure 23: Europe Capacity Management Analytics Industry Revenue Share (%), by End-user Industry 2024 & 2032
- Figure 24: Europe Capacity Management Analytics Industry Revenue (Million), by Country 2024 & 2032
- Figure 25: Europe Capacity Management Analytics Industry Revenue Share (%), by Country 2024 & 2032
- Figure 26: Asia Pacific Capacity Management Analytics Industry Revenue (Million), by Deployment 2024 & 2032
- Figure 27: Asia Pacific Capacity Management Analytics Industry Revenue Share (%), by Deployment 2024 & 2032
- Figure 28: Asia Pacific Capacity Management Analytics Industry Revenue (Million), by End-user Industry 2024 & 2032
- Figure 29: Asia Pacific Capacity Management Analytics Industry Revenue Share (%), by End-user Industry 2024 & 2032
- Figure 30: Asia Pacific Capacity Management Analytics Industry Revenue (Million), by Country 2024 & 2032
- Figure 31: Asia Pacific Capacity Management Analytics Industry Revenue Share (%), by Country 2024 & 2032
- Figure 32: Latin America Capacity Management Analytics Industry Revenue (Million), by Deployment 2024 & 2032
- Figure 33: Latin America Capacity Management Analytics Industry Revenue Share (%), by Deployment 2024 & 2032
- Figure 34: Latin America Capacity Management Analytics Industry Revenue (Million), by End-user Industry 2024 & 2032
- Figure 35: Latin America Capacity Management Analytics Industry Revenue Share (%), by End-user Industry 2024 & 2032
- Figure 36: Latin America Capacity Management Analytics Industry Revenue (Million), by Country 2024 & 2032
- Figure 37: Latin America Capacity Management Analytics Industry Revenue Share (%), by Country 2024 & 2032
- Figure 38: Middle East and Africa Capacity Management Analytics Industry Revenue (Million), by Deployment 2024 & 2032
- Figure 39: Middle East and Africa Capacity Management Analytics Industry Revenue Share (%), by Deployment 2024 & 2032
- Figure 40: Middle East and Africa Capacity Management Analytics Industry Revenue (Million), by End-user Industry 2024 & 2032
- Figure 41: Middle East and Africa Capacity Management Analytics Industry Revenue Share (%), by End-user Industry 2024 & 2032
- Figure 42: Middle East and Africa Capacity Management Analytics Industry Revenue (Million), by Country 2024 & 2032
- Figure 43: Middle East and Africa Capacity Management Analytics Industry Revenue Share (%), by Country 2024 & 2032
List of Tables
- Table 1: Global Capacity Management Analytics Industry Revenue Million Forecast, by Region 2019 & 2032
- Table 2: Global Capacity Management Analytics Industry Revenue Million Forecast, by Deployment 2019 & 2032
- Table 3: Global Capacity Management Analytics Industry Revenue Million Forecast, by End-user Industry 2019 & 2032
- Table 4: Global Capacity Management Analytics Industry Revenue Million Forecast, by Region 2019 & 2032
- Table 5: Global Capacity Management Analytics Industry Revenue Million Forecast, by Country 2019 & 2032
- Table 6: United States Capacity Management Analytics Industry Revenue (Million) Forecast, by Application 2019 & 2032
- Table 7: Canada Capacity Management Analytics Industry Revenue (Million) Forecast, by Application 2019 & 2032
- Table 8: Mexico Capacity Management Analytics Industry Revenue (Million) Forecast, by Application 2019 & 2032
- Table 9: Global Capacity Management Analytics Industry Revenue Million Forecast, by Country 2019 & 2032
- Table 10: Germany Capacity Management Analytics Industry Revenue (Million) Forecast, by Application 2019 & 2032
- Table 11: United Kingdom Capacity Management Analytics Industry Revenue (Million) Forecast, by Application 2019 & 2032
- Table 12: France Capacity Management Analytics Industry Revenue (Million) Forecast, by Application 2019 & 2032
- Table 13: Spain Capacity Management Analytics Industry Revenue (Million) Forecast, by Application 2019 & 2032
- Table 14: Italy Capacity Management Analytics Industry Revenue (Million) Forecast, by Application 2019 & 2032
- Table 15: Spain Capacity Management Analytics Industry Revenue (Million) Forecast, by Application 2019 & 2032
- Table 16: Belgium Capacity Management Analytics Industry Revenue (Million) Forecast, by Application 2019 & 2032
- Table 17: Netherland Capacity Management Analytics Industry Revenue (Million) Forecast, by Application 2019 & 2032
- Table 18: Nordics Capacity Management Analytics Industry Revenue (Million) Forecast, by Application 2019 & 2032
- Table 19: Rest of Europe Capacity Management Analytics Industry Revenue (Million) Forecast, by Application 2019 & 2032
- Table 20: Global Capacity Management Analytics Industry Revenue Million Forecast, by Country 2019 & 2032
- Table 21: China Capacity Management Analytics Industry Revenue (Million) Forecast, by Application 2019 & 2032
- Table 22: Japan Capacity Management Analytics Industry Revenue (Million) Forecast, by Application 2019 & 2032
- Table 23: India Capacity Management Analytics Industry Revenue (Million) Forecast, by Application 2019 & 2032
- Table 24: South Korea Capacity Management Analytics Industry Revenue (Million) Forecast, by Application 2019 & 2032
- Table 25: Southeast Asia Capacity Management Analytics Industry Revenue (Million) Forecast, by Application 2019 & 2032
- Table 26: Australia Capacity Management Analytics Industry Revenue (Million) Forecast, by Application 2019 & 2032
- Table 27: Indonesia Capacity Management Analytics Industry Revenue (Million) Forecast, by Application 2019 & 2032
- Table 28: Phillipes Capacity Management Analytics Industry Revenue (Million) Forecast, by Application 2019 & 2032
- Table 29: Singapore Capacity Management Analytics Industry Revenue (Million) Forecast, by Application 2019 & 2032
- Table 30: Thailandc Capacity Management Analytics Industry Revenue (Million) Forecast, by Application 2019 & 2032
- Table 31: Rest of Asia Pacific Capacity Management Analytics Industry Revenue (Million) Forecast, by Application 2019 & 2032
- Table 32: Global Capacity Management Analytics Industry Revenue Million Forecast, by Country 2019 & 2032
- Table 33: Brazil Capacity Management Analytics Industry Revenue (Million) Forecast, by Application 2019 & 2032
- Table 34: Argentina Capacity Management Analytics Industry Revenue (Million) Forecast, by Application 2019 & 2032
- Table 35: Peru Capacity Management Analytics Industry Revenue (Million) Forecast, by Application 2019 & 2032
- Table 36: Chile Capacity Management Analytics Industry Revenue (Million) Forecast, by Application 2019 & 2032
- Table 37: Colombia Capacity Management Analytics Industry Revenue (Million) Forecast, by Application 2019 & 2032
- Table 38: Ecuador Capacity Management Analytics Industry Revenue (Million) Forecast, by Application 2019 & 2032
- Table 39: Venezuela Capacity Management Analytics Industry Revenue (Million) Forecast, by Application 2019 & 2032
- Table 40: Rest of South America Capacity Management Analytics Industry Revenue (Million) Forecast, by Application 2019 & 2032
- Table 41: Global Capacity Management Analytics Industry Revenue Million Forecast, by Country 2019 & 2032
- Table 42: United States Capacity Management Analytics Industry Revenue (Million) Forecast, by Application 2019 & 2032
- Table 43: Canada Capacity Management Analytics Industry Revenue (Million) Forecast, by Application 2019 & 2032
- Table 44: Mexico Capacity Management Analytics Industry Revenue (Million) Forecast, by Application 2019 & 2032
- Table 45: Global Capacity Management Analytics Industry Revenue Million Forecast, by Country 2019 & 2032
- Table 46: United Arab Emirates Capacity Management Analytics Industry Revenue (Million) Forecast, by Application 2019 & 2032
- Table 47: Saudi Arabia Capacity Management Analytics Industry Revenue (Million) Forecast, by Application 2019 & 2032
- Table 48: South Africa Capacity Management Analytics Industry Revenue (Million) Forecast, by Application 2019 & 2032
- Table 49: Rest of Middle East and Africa Capacity Management Analytics Industry Revenue (Million) Forecast, by Application 2019 & 2032
- Table 50: Global Capacity Management Analytics Industry Revenue Million Forecast, by Deployment 2019 & 2032
- Table 51: Global Capacity Management Analytics Industry Revenue Million Forecast, by End-user Industry 2019 & 2032
- Table 52: Global Capacity Management Analytics Industry Revenue Million Forecast, by Country 2019 & 2032
- Table 53: Global Capacity Management Analytics Industry Revenue Million Forecast, by Deployment 2019 & 2032
- Table 54: Global Capacity Management Analytics Industry Revenue Million Forecast, by End-user Industry 2019 & 2032
- Table 55: Global Capacity Management Analytics Industry Revenue Million Forecast, by Country 2019 & 2032
- Table 56: Global Capacity Management Analytics Industry Revenue Million Forecast, by Deployment 2019 & 2032
- Table 57: Global Capacity Management Analytics Industry Revenue Million Forecast, by End-user Industry 2019 & 2032
- Table 58: Global Capacity Management Analytics Industry Revenue Million Forecast, by Country 2019 & 2032
- Table 59: Global Capacity Management Analytics Industry Revenue Million Forecast, by Deployment 2019 & 2032
- Table 60: Global Capacity Management Analytics Industry Revenue Million Forecast, by End-user Industry 2019 & 2032
- Table 61: Global Capacity Management Analytics Industry Revenue Million Forecast, by Country 2019 & 2032
- Table 62: Global Capacity Management Analytics Industry Revenue Million Forecast, by Deployment 2019 & 2032
- Table 63: Global Capacity Management Analytics Industry Revenue Million Forecast, by End-user Industry 2019 & 2032
- Table 64: Global Capacity Management Analytics Industry Revenue Million Forecast, by Country 2019 & 2032
Frequently Asked Questions
1. What is the projected Compound Annual Growth Rate (CAGR) of the Capacity Management Analytics Industry?
The projected CAGR is approximately 18.00%.
2. Which companies are prominent players in the Capacity Management Analytics Industry?
Key companies in the market include Precisely (Formerly Syncsort), Teoco Corporation, IBM Corporation, Helpsystems, ITRS Group Ltd, Hewlett Packard Enterprise Company, Broadcom Inc, BMC Software Inc, Riverbed Technology Inc, NetApp Inc, CPT Global Limited*List Not Exhaustive, VMware Inc.
3. What are the main segments of the Capacity Management Analytics Industry?
The market segments include Deployment , End-user Industry.
4. Can you provide details about the market size?
The market size is estimated to be USD XX Million as of 2022.
5. What are some drivers contributing to market growth?
; Increasing Need for Optimization and Effective Utilization of IT Infrastructures; Increasing Complexities in IT Infrastructures.
6. What are the notable trends driving market growth?
Manufacturing Segment is Expected to Witness Significant Growth.
7. Are there any restraints impacting market growth?
; Lower Adoption Among the SMEs.
8. Can you provide examples of recent developments in the market?
N/A
9. What pricing options are available for accessing the report?
Pricing options include single-user, multi-user, and enterprise licenses priced at USD 4750, USD 5250, and USD 8750 respectively.
10. Is the market size provided in terms of value or volume?
The market size is provided in terms of value, measured in Million.
11. Are there any specific market keywords associated with the report?
Yes, the market keyword associated with the report is "Capacity Management Analytics Industry," which aids in identifying and referencing the specific market segment covered.
12. How do I determine which pricing option suits my needs best?
The pricing options vary based on user requirements and access needs. Individual users may opt for single-user licenses, while businesses requiring broader access may choose multi-user or enterprise licenses for cost-effective access to the report.
13. Are there any additional resources or data provided in the Capacity Management Analytics Industry report?
While the report offers comprehensive insights, it's advisable to review the specific contents or supplementary materials provided to ascertain if additional resources or data are available.
14. How can I stay updated on further developments or reports in the Capacity Management Analytics Industry?
To stay informed about further developments, trends, and reports in the Capacity Management Analytics Industry, consider subscribing to industry newsletters, following relevant companies and organizations, or regularly checking reputable industry news sources and publications.
Methodology
Step 1 - Identification of Relevant Samples Size from Population Database


Step 2 - Approaches for Defining Global Market Size (Value, Volume* & Price*)

Note*: In applicable scenarios
Step 3 - Data Sources
Primary Research
- Web Analytics
- Survey Reports
- Research Institute
- Latest Research Reports
- Opinion Leaders
Secondary Research
- Annual Reports
- White Paper
- Latest Press Release
- Industry Association
- Paid Database
- Investor Presentations

Step 4 - Data Triangulation
Involves using different sources of information in order to increase the validity of a study
These sources are likely to be stakeholders in a program - participants, other researchers, program staff, other community members, and so on.
Then we put all data in single framework & apply various statistical tools to find out the dynamic on the market.
During the analysis stage, feedback from the stakeholder groups would be compared to determine areas of agreement as well as areas of divergence


