

Key Insights
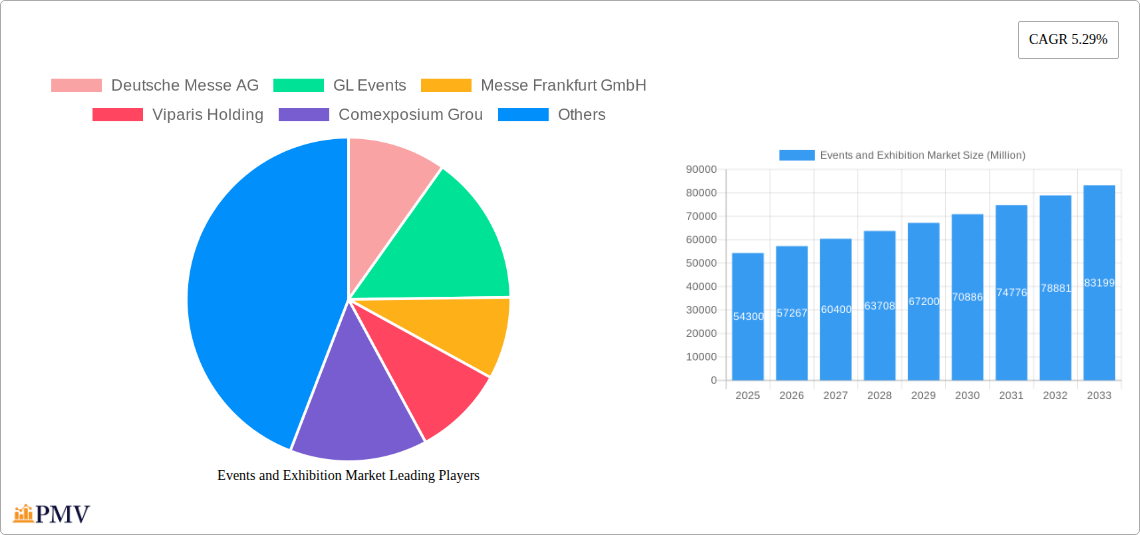
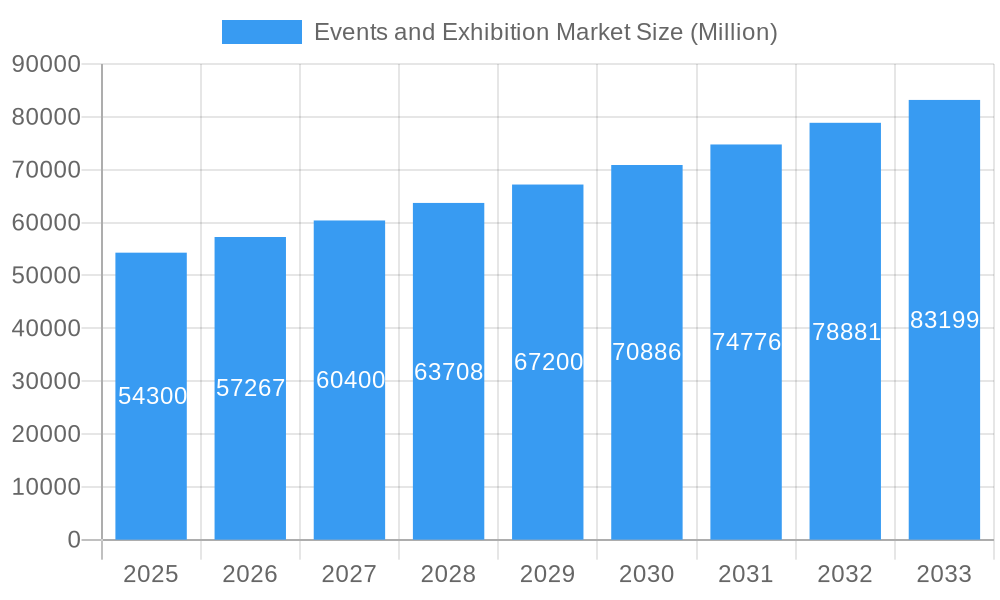
The global events and exhibition market, valued at $54.30 billion in 2025, is projected to experience robust growth, driven by a compound annual growth rate (CAGR) of 5.29% from 2025 to 2033. This expansion is fueled by several key factors. The increasing adoption of hybrid and virtual event formats caters to broader audiences and reduces geographical limitations, boosting participation and revenue streams. Furthermore, the resurgence of in-person events post-pandemic reflects a strong desire for networking and experiential engagement. Across diverse sectors like consumer goods, automotive, and industrial manufacturing, exhibitions provide crucial platforms for product launches, brand building, and business-to-business (B2B) collaborations. The rise of specialized niche events further contributes to market segmentation and growth. While economic fluctuations and potential logistical challenges could act as restraints, the overall trajectory indicates sustained growth, particularly in regions like Asia-Pacific, fueled by expanding economies and rising disposable incomes. The competitive landscape is populated by major players such as Deutsche Messe AG, Messe Frankfurt GmbH, and Comexposium Group, continuously innovating to enhance attendee experience and optimize event management. Revenue generation is diversified across exhibitor fees, sponsorships, entrance fees, and ancillary services, creating resilience against market volatility.
Events and Exhibition Market Market Size (In Billion)
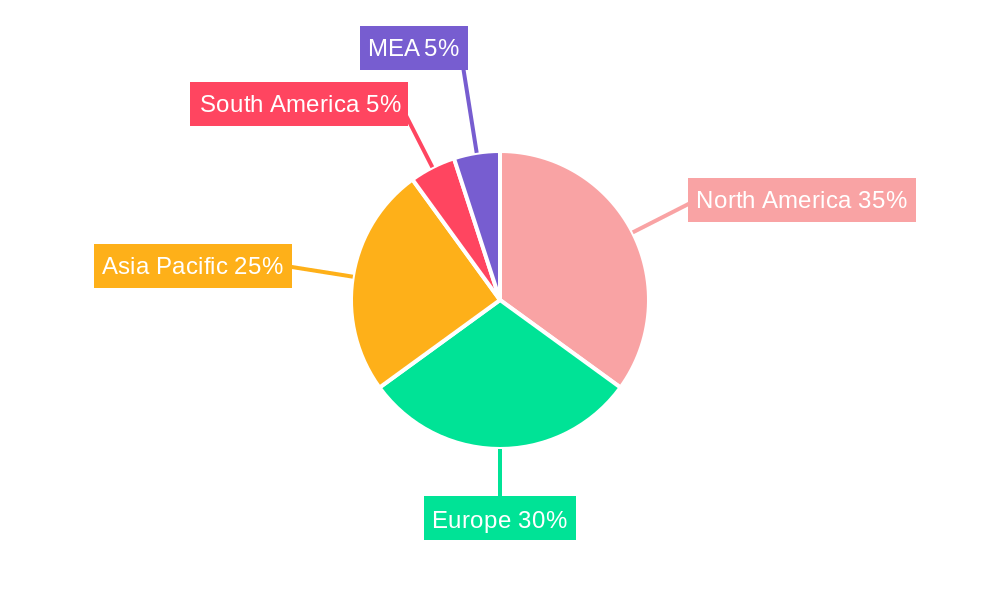
The segmentation of the market offers further insight into growth drivers. The B2B segment, while currently dominant, is expected to witness growth driven by companies seeking efficient networking opportunities and lead generation. The B2C segment, benefiting from increased consumer spending and experiential marketing trends, will also see significant growth. The mixed/hybrid model will continue to gain traction, leveraging the strengths of both in-person and virtual formats. Geographically, North America and Europe continue to hold significant market shares, but Asia-Pacific is projected to demonstrate the fastest growth rate, fueled by strong economic expansion and a rising middle class. Strategic partnerships, technological advancements in event management software and virtual platforms, and a focus on sustainability will further shape the future landscape of the events and exhibition industry.
Events and Exhibition Market Company Market Share
Events and Exhibition Market: A Comprehensive Report (2019-2033)
This comprehensive report provides a detailed analysis of the global Events and Exhibition Market, offering invaluable insights for industry professionals, investors, and stakeholders. With a study period spanning 2019-2033, a base year of 2025, and a forecast period of 2025-2033, this report utilizes extensive data analysis and expert insights to present a clear and actionable understanding of this dynamic market. The market is expected to reach xx Million by 2033, exhibiting a CAGR of xx% during the forecast period.
Events and Exhibition Market Market Structure & Competitive Dynamics
The global Events and Exhibition Market is characterized by a moderately concentrated structure, with several major players dominating the landscape. Key players such as Deutsche Messe AG, GL Events, Messe Frankfurt GmbH, Viparis Holding, Comexposium Group, Koelnmesse GmbH, Messe Düsseldorf GmbH, Percept Limited, Fiera Milano SpA, and MCH Group AG control a significant portion of the market share. The market share distribution exhibits a slight skew, with the top five players collectively holding approximately xx% of the global market in 2024.
Innovation within the sector is driven by technological advancements such as virtual and hybrid event platforms, AI-powered event management tools, and immersive technologies. The regulatory framework varies across regions, impacting aspects like licensing, safety regulations, and environmental standards. Substitutes include online webinars, virtual conferences, and digital marketing campaigns; however, the in-person experience continues to hold significant value for many events. End-user trends indicate a growing preference for experiential and personalized events. M&A activity has been robust in recent years, with several significant mergers and acquisitions aimed at expanding market reach and service offerings. For instance, the merger of EventWorks and Quest Events in November 2023 is a noteworthy example with a combined value of xx Million. The total value of M&A deals in the sector during the historical period (2019-2024) amounted to approximately xx Million.
Events and Exhibition Market Industry Trends & Insights
The Events and Exhibition Market exhibits a complex interplay of factors driving its growth trajectory. Key growth drivers include the increasing need for business networking and brand building, rising disposable incomes in emerging economies, and the growing adoption of hybrid event formats. The market is also witnessing significant technological disruption, with the integration of virtual reality (VR) and augmented reality (AR) technologies enhancing the event experience. Consumer preferences are shifting towards more personalized, immersive, and sustainable events. Competitive dynamics are intense, with companies focusing on innovation, strategic partnerships, and geographical expansion to maintain market share. The market penetration of hybrid events is increasing significantly, expected to reach xx% by 2033.
Dominant Markets & Segments in Events and Exhibition Market
While precise market share data requires proprietary access, North America and Europe are widely considered the dominant regions, boasting well-established event infrastructure and a high concentration of major players. However, Asia-Pacific is experiencing rapid growth, driven by economic expansion and increasing disposable incomes.
- By Type: The B2B segment currently holds the largest market share, followed by Mixed/Hybrid and B2C events. The rapid adoption of hybrid events is expected to significantly impact the market segmentation.
- By Revenue Stream: Exhibitor fees are the primary revenue source for most events. However, sponsorship fees and service revenue are becoming increasingly important, particularly in larger-scale events. Entrance fees constitute a significant portion of the revenue for B2C events.
- By End User: The Consumer Goods and Retail sector, along with the Automotive and Transportation sector and Industrial sector, represent significant end-user segments. The Entertainment sector is experiencing strong growth due to the increasing popularity of live events.
Key drivers vary across segments: Economic policies supporting the events industry and robust infrastructure play a crucial role in regional dominance. The rapid growth of certain segments is fueled by technological innovations and evolving consumer preferences.
Events and Exhibition Market Product Innovations
Recent product developments focus on enhancing the event experience through technological integration. Virtual and hybrid event platforms are becoming increasingly sophisticated, offering immersive experiences and advanced networking tools. AI-powered event management solutions are streamlining operations and improving efficiency. The competitive advantage lies in providing innovative solutions that meet the evolving needs of both organizers and attendees, ensuring a seamless and engaging experience.
Report Segmentation & Scope
This report comprehensively segments the Events and Exhibition Market across several key dimensions:
- By Type: B2B, B2C, Mixed/Hybrid (Growth projections, market sizes and competitive dynamics are detailed for each type).
- By Revenue Stream: Exhibitor Fee, Sponsorship Fee, Entrance Fee, Services (Market size and growth projections are provided for each revenue stream).
- By End User: Consumer Goods and Retail Sector, Automotive and Transportation Sector, Industrial, Entertainment, Real Estate and Property, Hospitality Sector, Other End Users (Growth projections and market size breakdown by end-user sector). Each segment's analysis considers market size, growth projections, and competitive dynamics.
Key Drivers of Events and Exhibition Market Growth
Several factors contribute to the market's growth: Technological advancements like virtual and hybrid event platforms are broadening accessibility. Economic factors like increasing disposable incomes fuel demand for experiential events. Supportive government policies and infrastructure investments further enhance market expansion.
Challenges in the Events and Exhibition Market Sector
The sector faces challenges such as stringent regulatory compliance, requiring significant investment and resources. Supply chain disruptions and increased operational costs pose substantial financial burdens. Intense competition requires continuous innovation and adaptability to maintain market share. These factors collectively impact market growth and profitability.
Leading Players in the Events and Exhibition Market Market
- Deutsche Messe AG
- GL Events
- Messe Frankfurt GmbH
- Viparis Holding
- Comexposium Group
- Koelnmesse GmbH
- Messe Düsseldorf GmbH
- Percept Limited
- Fiera Milano SpA
- MCH Group AG
Key Developments in Events and Exhibition Market Sector
- November 2023: Art Design Chicago launched, showcasing the city's artistic heritage and boosting local arts organizations. This initiative highlights the importance of community-focused events and their impact on the cultural landscape.
- November 2023: The merger of EventWorks and Quest Events created a larger, full-service event provider, increasing competition and service offerings within the market. This exemplifies consolidation trends in the sector.
Strategic Events and Exhibition Market Market Outlook
The Events and Exhibition Market presents significant future potential, driven by evolving consumer preferences and technological innovation. Strategic opportunities exist for companies focusing on personalization, sustainability, and digital integration. The market’s continued growth is likely, fueled by advancements in hybrid and virtual event formats, leading to enhanced audience engagement and expanded market reach.
Events and Exhibition Market Segmentation
-
1. Type
- 1.1. B2B
- 1.2. B2C
- 1.3. Mixed/Hybrid
-
2. Revenue Stream
- 2.1. Exhibitor Fee
- 2.2. Sponsorship Fee
- 2.3. Entrance Fee
- 2.4. Services
-
3. End User
- 3.1. Consumer Goods and Retail Sector
- 3.2. Automotive and Transportation Sector
- 3.3. Industrial
- 3.4. Entertainment
- 3.5. Real Estate and Property
- 3.6. Hospitality Sector
- 3.7. Other End Users
Events and Exhibition Market Segmentation By Geography
-
1. North America
- 1.1. United States
- 1.2. Canada
-
2. Europe
- 2.1. Germany
- 2.2. United Kingdom
- 2.3. France
-
3. Asia Pacific
- 3.1. China
- 3.2. Japan
- 3.3. India
- 3.4. South Korea
- 3.5. Australia and New Zealand
- 4. Latin America
- 5. Middle East and Africa
Events and Exhibition Market Regional Market Share
Geographic Coverage of Events and Exhibition Market
Events and Exhibition Market REPORT HIGHLIGHTS
| Aspects | Details |
|---|---|
| Study Period | 2020-2034 |
| Base Year | 2025 |
| Estimated Year | 2026 |
| Forecast Period | 2026-2034 |
| Historical Period | 2020-2025 |
| Growth Rate | CAGR of 5.29% from 2020-2034 |
| Segmentation |
|
Table of Contents
- 1. Introduction
- 1.1. Research Scope
- 1.2. Market Segmentation
- 1.3. Research Objective
- 1.4. Definitions and Assumptions
- 2. Executive Summary
- 2.1. Market Snapshot
- 3. Market Dynamics
- 3.1. Market Drivers
- 3.2. Market Restrains
- 3.3. Market Trends
- 3.4. Market Opportunities
- 4. Market Factor Analysis
- 4.1. Porters Five Forces
- 4.1.1. Bargaining Power of Suppliers
- 4.1.2. Bargaining Power of Buyers
- 4.1.3. Threat of New Entrants
- 4.1.4. Threat of Substitutes
- 4.1.5. Competitive Rivalry
- 4.2. PESTEL analysis
- 4.3. BCG Analysis
- 4.3.1. Stars (High Growth, High Market Share)
- 4.3.2. Cash Cows (Low Growth, High Market Share)
- 4.3.3. Question Mark (High Growth, Low Market Share)
- 4.3.4. Dogs (Low Growth, Low Market Share)
- 4.4. Ansoff Matrix Analysis
- 4.5. Supply Chain Analysis
- 4.6. Regulatory Landscape
- 4.7. Current Market Potential and Opportunity Assessment (TAM–SAM–SOM Framework)
- 4.8. PMV Analyst Note
- 4.1. Porters Five Forces
- 5. Market Analysis, Insights and Forecast 2021-2033
- 5.1. Market Analysis, Insights and Forecast - by Type
- 5.1.1. B2B
- 5.1.2. B2C
- 5.1.3. Mixed/Hybrid
- 5.2. Market Analysis, Insights and Forecast - by Revenue Stream
- 5.2.1. Exhibitor Fee
- 5.2.2. Sponsorship Fee
- 5.2.3. Entrance Fee
- 5.2.4. Services
- 5.3. Market Analysis, Insights and Forecast - by End User
- 5.3.1. Consumer Goods and Retail Sector
- 5.3.2. Automotive and Transportation Sector
- 5.3.3. Industrial
- 5.3.4. Entertainment
- 5.3.5. Real Estate and Property
- 5.3.6. Hospitality Sector
- 5.3.7. Other End Users
- 5.4. Market Analysis, Insights and Forecast - by Region
- 5.4.1. North America
- 5.4.2. Europe
- 5.4.3. Asia Pacific
- 5.4.4. Latin America
- 5.4.5. Middle East and Africa
- 5.1. Market Analysis, Insights and Forecast - by Type
- 6. Global Events and Exhibition Market Analysis, Insights and Forecast, 2021-2033
- 6.1. Market Analysis, Insights and Forecast - by Type
- 6.1.1. B2B
- 6.1.2. B2C
- 6.1.3. Mixed/Hybrid
- 6.2. Market Analysis, Insights and Forecast - by Revenue Stream
- 6.2.1. Exhibitor Fee
- 6.2.2. Sponsorship Fee
- 6.2.3. Entrance Fee
- 6.2.4. Services
- 6.3. Market Analysis, Insights and Forecast - by End User
- 6.3.1. Consumer Goods and Retail Sector
- 6.3.2. Automotive and Transportation Sector
- 6.3.3. Industrial
- 6.3.4. Entertainment
- 6.3.5. Real Estate and Property
- 6.3.6. Hospitality Sector
- 6.3.7. Other End Users
- 6.1. Market Analysis, Insights and Forecast - by Type
- 7. North America Events and Exhibition Market Analysis, Insights and Forecast, 2020-2032
- 7.1. Market Analysis, Insights and Forecast - by Type
- 7.1.1. B2B
- 7.1.2. B2C
- 7.1.3. Mixed/Hybrid
- 7.2. Market Analysis, Insights and Forecast - by Revenue Stream
- 7.2.1. Exhibitor Fee
- 7.2.2. Sponsorship Fee
- 7.2.3. Entrance Fee
- 7.2.4. Services
- 7.3. Market Analysis, Insights and Forecast - by End User
- 7.3.1. Consumer Goods and Retail Sector
- 7.3.2. Automotive and Transportation Sector
- 7.3.3. Industrial
- 7.3.4. Entertainment
- 7.3.5. Real Estate and Property
- 7.3.6. Hospitality Sector
- 7.3.7. Other End Users
- 7.1. Market Analysis, Insights and Forecast - by Type
- 8. Europe Events and Exhibition Market Analysis, Insights and Forecast, 2020-2032
- 8.1. Market Analysis, Insights and Forecast - by Type
- 8.1.1. B2B
- 8.1.2. B2C
- 8.1.3. Mixed/Hybrid
- 8.2. Market Analysis, Insights and Forecast - by Revenue Stream
- 8.2.1. Exhibitor Fee
- 8.2.2. Sponsorship Fee
- 8.2.3. Entrance Fee
- 8.2.4. Services
- 8.3. Market Analysis, Insights and Forecast - by End User
- 8.3.1. Consumer Goods and Retail Sector
- 8.3.2. Automotive and Transportation Sector
- 8.3.3. Industrial
- 8.3.4. Entertainment
- 8.3.5. Real Estate and Property
- 8.3.6. Hospitality Sector
- 8.3.7. Other End Users
- 8.1. Market Analysis, Insights and Forecast - by Type
- 9. Asia Pacific Events and Exhibition Market Analysis, Insights and Forecast, 2020-2032
- 9.1. Market Analysis, Insights and Forecast - by Type
- 9.1.1. B2B
- 9.1.2. B2C
- 9.1.3. Mixed/Hybrid
- 9.2. Market Analysis, Insights and Forecast - by Revenue Stream
- 9.2.1. Exhibitor Fee
- 9.2.2. Sponsorship Fee
- 9.2.3. Entrance Fee
- 9.2.4. Services
- 9.3. Market Analysis, Insights and Forecast - by End User
- 9.3.1. Consumer Goods and Retail Sector
- 9.3.2. Automotive and Transportation Sector
- 9.3.3. Industrial
- 9.3.4. Entertainment
- 9.3.5. Real Estate and Property
- 9.3.6. Hospitality Sector
- 9.3.7. Other End Users
- 9.1. Market Analysis, Insights and Forecast - by Type
- 10. Latin America Events and Exhibition Market Analysis, Insights and Forecast, 2020-2032
- 10.1. Market Analysis, Insights and Forecast - by Type
- 10.1.1. B2B
- 10.1.2. B2C
- 10.1.3. Mixed/Hybrid
- 10.2. Market Analysis, Insights and Forecast - by Revenue Stream
- 10.2.1. Exhibitor Fee
- 10.2.2. Sponsorship Fee
- 10.2.3. Entrance Fee
- 10.2.4. Services
- 10.3. Market Analysis, Insights and Forecast - by End User
- 10.3.1. Consumer Goods and Retail Sector
- 10.3.2. Automotive and Transportation Sector
- 10.3.3. Industrial
- 10.3.4. Entertainment
- 10.3.5. Real Estate and Property
- 10.3.6. Hospitality Sector
- 10.3.7. Other End Users
- 10.1. Market Analysis, Insights and Forecast - by Type
- 11. Middle East and Africa Events and Exhibition Market Analysis, Insights and Forecast, 2020-2032
- 11.1. Market Analysis, Insights and Forecast - by Type
- 11.1.1. B2B
- 11.1.2. B2C
- 11.1.3. Mixed/Hybrid
- 11.2. Market Analysis, Insights and Forecast - by Revenue Stream
- 11.2.1. Exhibitor Fee
- 11.2.2. Sponsorship Fee
- 11.2.3. Entrance Fee
- 11.2.4. Services
- 11.3. Market Analysis, Insights and Forecast - by End User
- 11.3.1. Consumer Goods and Retail Sector
- 11.3.2. Automotive and Transportation Sector
- 11.3.3. Industrial
- 11.3.4. Entertainment
- 11.3.5. Real Estate and Property
- 11.3.6. Hospitality Sector
- 11.3.7. Other End Users
- 11.1. Market Analysis, Insights and Forecast - by Type
- 12. Competitive Analysis
- 12.1. Company Profiles
- 12.1.1 Deutsche Messe AG
- 12.1.1.1. Company Overview
- 12.1.1.2. Products
- 12.1.1.3. Company Financials
- 12.1.1.4. SWOT Analysis
- 12.1.2 GL Events
- 12.1.2.1. Company Overview
- 12.1.2.2. Products
- 12.1.2.3. Company Financials
- 12.1.2.4. SWOT Analysis
- 12.1.3 Messe Frankfurt GmbH
- 12.1.3.1. Company Overview
- 12.1.3.2. Products
- 12.1.3.3. Company Financials
- 12.1.3.4. SWOT Analysis
- 12.1.4 Viparis Holding
- 12.1.4.1. Company Overview
- 12.1.4.2. Products
- 12.1.4.3. Company Financials
- 12.1.4.4. SWOT Analysis
- 12.1.5 Comexposium Grou
- 12.1.5.1. Company Overview
- 12.1.5.2. Products
- 12.1.5.3. Company Financials
- 12.1.5.4. SWOT Analysis
- 12.1.6 Koelnmesse GmbH
- 12.1.6.1. Company Overview
- 12.1.6.2. Products
- 12.1.6.3. Company Financials
- 12.1.6.4. SWOT Analysis
- 12.1.7 Messe Dsseldorf GmbH
- 12.1.7.1. Company Overview
- 12.1.7.2. Products
- 12.1.7.3. Company Financials
- 12.1.7.4. SWOT Analysis
- 12.1.8 Percept Limited
- 12.1.8.1. Company Overview
- 12.1.8.2. Products
- 12.1.8.3. Company Financials
- 12.1.8.4. SWOT Analysis
- 12.1.9 Fiera Milano SpA
- 12.1.9.1. Company Overview
- 12.1.9.2. Products
- 12.1.9.3. Company Financials
- 12.1.9.4. SWOT Analysis
- 12.1.10 MCH Group AG
- 12.1.10.1. Company Overview
- 12.1.10.2. Products
- 12.1.10.3. Company Financials
- 12.1.10.4. SWOT Analysis
- 12.1.1 Deutsche Messe AG
- 12.2. Market Entropy
- 12.2.1 Company's Key Areas Served
- 12.2.2 Recent Developments
- 12.3. Company Market Share Analysis 2025
- 12.3.1 Top 5 Companies Market Share Analysis
- 12.3.2 Top 3 Companies Market Share Analysis
- 12.4. List of Potential Customers
- 13. Research Methodology
List of Figures
- Figure 1: Global Events and Exhibition Market Revenue Breakdown (Million, %) by Region 2025 & 2033
- Figure 2: North America Events and Exhibition Market Revenue (Million), by Type 2025 & 2033
- Figure 3: North America Events and Exhibition Market Revenue Share (%), by Type 2025 & 2033
- Figure 4: North America Events and Exhibition Market Revenue (Million), by Revenue Stream 2025 & 2033
- Figure 5: North America Events and Exhibition Market Revenue Share (%), by Revenue Stream 2025 & 2033
- Figure 6: North America Events and Exhibition Market Revenue (Million), by End User 2025 & 2033
- Figure 7: North America Events and Exhibition Market Revenue Share (%), by End User 2025 & 2033
- Figure 8: North America Events and Exhibition Market Revenue (Million), by Country 2025 & 2033
- Figure 9: North America Events and Exhibition Market Revenue Share (%), by Country 2025 & 2033
- Figure 10: Europe Events and Exhibition Market Revenue (Million), by Type 2025 & 2033
- Figure 11: Europe Events and Exhibition Market Revenue Share (%), by Type 2025 & 2033
- Figure 12: Europe Events and Exhibition Market Revenue (Million), by Revenue Stream 2025 & 2033
- Figure 13: Europe Events and Exhibition Market Revenue Share (%), by Revenue Stream 2025 & 2033
- Figure 14: Europe Events and Exhibition Market Revenue (Million), by End User 2025 & 2033
- Figure 15: Europe Events and Exhibition Market Revenue Share (%), by End User 2025 & 2033
- Figure 16: Europe Events and Exhibition Market Revenue (Million), by Country 2025 & 2033
- Figure 17: Europe Events and Exhibition Market Revenue Share (%), by Country 2025 & 2033
- Figure 18: Asia Pacific Events and Exhibition Market Revenue (Million), by Type 2025 & 2033
- Figure 19: Asia Pacific Events and Exhibition Market Revenue Share (%), by Type 2025 & 2033
- Figure 20: Asia Pacific Events and Exhibition Market Revenue (Million), by Revenue Stream 2025 & 2033
- Figure 21: Asia Pacific Events and Exhibition Market Revenue Share (%), by Revenue Stream 2025 & 2033
- Figure 22: Asia Pacific Events and Exhibition Market Revenue (Million), by End User 2025 & 2033
- Figure 23: Asia Pacific Events and Exhibition Market Revenue Share (%), by End User 2025 & 2033
- Figure 24: Asia Pacific Events and Exhibition Market Revenue (Million), by Country 2025 & 2033
- Figure 25: Asia Pacific Events and Exhibition Market Revenue Share (%), by Country 2025 & 2033
- Figure 26: Latin America Events and Exhibition Market Revenue (Million), by Type 2025 & 2033
- Figure 27: Latin America Events and Exhibition Market Revenue Share (%), by Type 2025 & 2033
- Figure 28: Latin America Events and Exhibition Market Revenue (Million), by Revenue Stream 2025 & 2033
- Figure 29: Latin America Events and Exhibition Market Revenue Share (%), by Revenue Stream 2025 & 2033
- Figure 30: Latin America Events and Exhibition Market Revenue (Million), by End User 2025 & 2033
- Figure 31: Latin America Events and Exhibition Market Revenue Share (%), by End User 2025 & 2033
- Figure 32: Latin America Events and Exhibition Market Revenue (Million), by Country 2025 & 2033
- Figure 33: Latin America Events and Exhibition Market Revenue Share (%), by Country 2025 & 2033
- Figure 34: Middle East and Africa Events and Exhibition Market Revenue (Million), by Type 2025 & 2033
- Figure 35: Middle East and Africa Events and Exhibition Market Revenue Share (%), by Type 2025 & 2033
- Figure 36: Middle East and Africa Events and Exhibition Market Revenue (Million), by Revenue Stream 2025 & 2033
- Figure 37: Middle East and Africa Events and Exhibition Market Revenue Share (%), by Revenue Stream 2025 & 2033
- Figure 38: Middle East and Africa Events and Exhibition Market Revenue (Million), by End User 2025 & 2033
- Figure 39: Middle East and Africa Events and Exhibition Market Revenue Share (%), by End User 2025 & 2033
- Figure 40: Middle East and Africa Events and Exhibition Market Revenue (Million), by Country 2025 & 2033
- Figure 41: Middle East and Africa Events and Exhibition Market Revenue Share (%), by Country 2025 & 2033
List of Tables
- Table 1: Global Events and Exhibition Market Revenue Million Forecast, by Type 2020 & 2033
- Table 2: Global Events and Exhibition Market Revenue Million Forecast, by Revenue Stream 2020 & 2033
- Table 3: Global Events and Exhibition Market Revenue Million Forecast, by End User 2020 & 2033
- Table 4: Global Events and Exhibition Market Revenue Million Forecast, by Region 2020 & 2033
- Table 5: Global Events and Exhibition Market Revenue Million Forecast, by Type 2020 & 2033
- Table 6: Global Events and Exhibition Market Revenue Million Forecast, by Revenue Stream 2020 & 2033
- Table 7: Global Events and Exhibition Market Revenue Million Forecast, by End User 2020 & 2033
- Table 8: Global Events and Exhibition Market Revenue Million Forecast, by Country 2020 & 2033
- Table 9: United States Events and Exhibition Market Revenue (Million) Forecast, by Application 2020 & 2033
- Table 10: Canada Events and Exhibition Market Revenue (Million) Forecast, by Application 2020 & 2033
- Table 11: Global Events and Exhibition Market Revenue Million Forecast, by Type 2020 & 2033
- Table 12: Global Events and Exhibition Market Revenue Million Forecast, by Revenue Stream 2020 & 2033
- Table 13: Global Events and Exhibition Market Revenue Million Forecast, by End User 2020 & 2033
- Table 14: Global Events and Exhibition Market Revenue Million Forecast, by Country 2020 & 2033
- Table 15: Germany Events and Exhibition Market Revenue (Million) Forecast, by Application 2020 & 2033
- Table 16: United Kingdom Events and Exhibition Market Revenue (Million) Forecast, by Application 2020 & 2033
- Table 17: France Events and Exhibition Market Revenue (Million) Forecast, by Application 2020 & 2033
- Table 18: Global Events and Exhibition Market Revenue Million Forecast, by Type 2020 & 2033
- Table 19: Global Events and Exhibition Market Revenue Million Forecast, by Revenue Stream 2020 & 2033
- Table 20: Global Events and Exhibition Market Revenue Million Forecast, by End User 2020 & 2033
- Table 21: Global Events and Exhibition Market Revenue Million Forecast, by Country 2020 & 2033
- Table 22: China Events and Exhibition Market Revenue (Million) Forecast, by Application 2020 & 2033
- Table 23: Japan Events and Exhibition Market Revenue (Million) Forecast, by Application 2020 & 2033
- Table 24: India Events and Exhibition Market Revenue (Million) Forecast, by Application 2020 & 2033
- Table 25: South Korea Events and Exhibition Market Revenue (Million) Forecast, by Application 2020 & 2033
- Table 26: Australia and New Zealand Events and Exhibition Market Revenue (Million) Forecast, by Application 2020 & 2033
- Table 27: Global Events and Exhibition Market Revenue Million Forecast, by Type 2020 & 2033
- Table 28: Global Events and Exhibition Market Revenue Million Forecast, by Revenue Stream 2020 & 2033
- Table 29: Global Events and Exhibition Market Revenue Million Forecast, by End User 2020 & 2033
- Table 30: Global Events and Exhibition Market Revenue Million Forecast, by Country 2020 & 2033
- Table 31: Global Events and Exhibition Market Revenue Million Forecast, by Type 2020 & 2033
- Table 32: Global Events and Exhibition Market Revenue Million Forecast, by Revenue Stream 2020 & 2033
- Table 33: Global Events and Exhibition Market Revenue Million Forecast, by End User 2020 & 2033
- Table 34: Global Events and Exhibition Market Revenue Million Forecast, by Country 2020 & 2033
Frequently Asked Questions
1. What is the projected Compound Annual Growth Rate (CAGR) of the Events and Exhibition Market?
The projected CAGR is approximately 5.29%.
2. Which companies are prominent players in the Events and Exhibition Market?
Key companies in the market include Deutsche Messe AG, GL Events, Messe Frankfurt GmbH, Viparis Holding, Comexposium Grou, Koelnmesse GmbH, Messe Dsseldorf GmbH, Percept Limited, Fiera Milano SpA, MCH Group AG.
3. What are the main segments of the Events and Exhibition Market?
The market segments include Type, Revenue Stream, End User.
4. Can you provide details about the market size?
The market size is estimated to be USD 54.30 Million as of 2022.
5. What are some drivers contributing to market growth?
Growing Adoption of Geo-Cloning for Exhibition Organizers; Increasing Growth of Consumer Goods Penetrates the Growth of B2C Exhibition.
6. What are the notable trends driving market growth?
Entertainment Sector to Witness Fastest Growth.
7. Are there any restraints impacting market growth?
Loss Due to Restrictions of Smaller Players to Participate Owing to Potential Low Turnouts.
8. Can you provide examples of recent developments in the market?
November 2023 - Art Design Chicago, an initiative of the Terra Foundation for American Art in partnership with local artists and arts organizations, is a citywide collaboration and series of events and exhibitions that highlight the voices and stories that are part of the city's unique artistic heritage and creative communities. Continuing into 2025, more than 50 Chicago-area arts organizations across 30 Chicago neighborhoods and several suburban communities showcase the work of hundreds of artists.
9. What pricing options are available for accessing the report?
Pricing options include single-user, multi-user, and enterprise licenses priced at USD 4750, USD 5250, and USD 8750 respectively.
10. Is the market size provided in terms of value or volume?
The market size is provided in terms of value, measured in Million.
11. Are there any specific market keywords associated with the report?
Yes, the market keyword associated with the report is "Events and Exhibition Market," which aids in identifying and referencing the specific market segment covered.
12. How do I determine which pricing option suits my needs best?
The pricing options vary based on user requirements and access needs. Individual users may opt for single-user licenses, while businesses requiring broader access may choose multi-user or enterprise licenses for cost-effective access to the report.
13. Are there any additional resources or data provided in the Events and Exhibition Market report?
While the report offers comprehensive insights, it's advisable to review the specific contents or supplementary materials provided to ascertain if additional resources or data are available.
14. How can I stay updated on further developments or reports in the Events and Exhibition Market?
To stay informed about further developments, trends, and reports in the Events and Exhibition Market, consider subscribing to industry newsletters, following relevant companies and organizations, or regularly checking reputable industry news sources and publications.
Methodology
Step 1 - Identification of Relevant Samples Size from Population Database


Step 2 - Approaches for Defining Global Market Size (Value, Volume* & Price*)

Note*: In applicable scenarios
Step 3 - Data Sources
Primary Research
- Web Analytics
- Survey Reports
- Research Institute
- Latest Research Reports
- Opinion Leaders
Secondary Research
- Annual Reports
- White Paper
- Latest Press Release
- Industry Association
- Paid Database
- Investor Presentations

Step 4 - Data Triangulation
Involves using different sources of information in order to increase the validity of a study
These sources are likely to be stakeholders in a program - participants, other researchers, program staff, other community members, and so on.
Then we put all data in single framework & apply various statistical tools to find out the dynamic on the market.
During the analysis stage, feedback from the stakeholder groups would be compared to determine areas of agreement as well as areas of divergence