
Key Insights
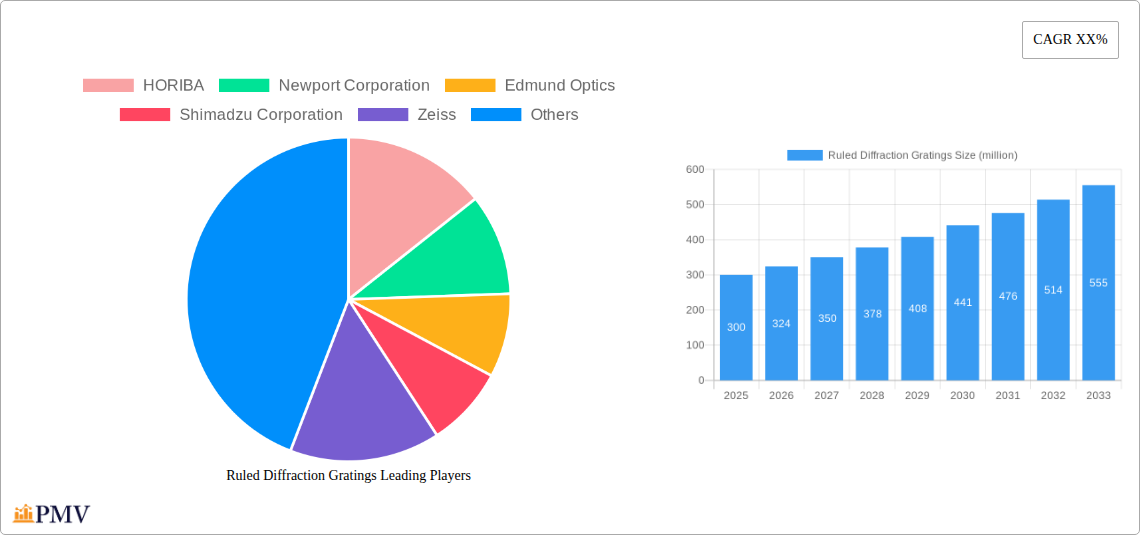
The global Ruled Diffraction Gratings market is poised for significant expansion, projected to reach a valuation of approximately $300 million by 2025, with a robust Compound Annual Growth Rate (CAGR) of around 8% anticipated for the forecast period of 2025-2033. This growth is primarily fueled by the escalating demand across diverse applications such as laser systems, advanced astronomical observatories, and high-performance optical telecommunications. The increasing sophistication of scientific instrumentation and the continuous innovation in photonics are key drivers propelling the market forward. Furthermore, the growing adoption of monochromators and spectrometers in research and development, quality control, and medical diagnostics is creating substantial opportunities for ruled diffraction gratings, especially those offering precise wavelength separation and high efficiency. Emerging markets and government investments in scientific infrastructure are also contributing to this positive market trajectory.
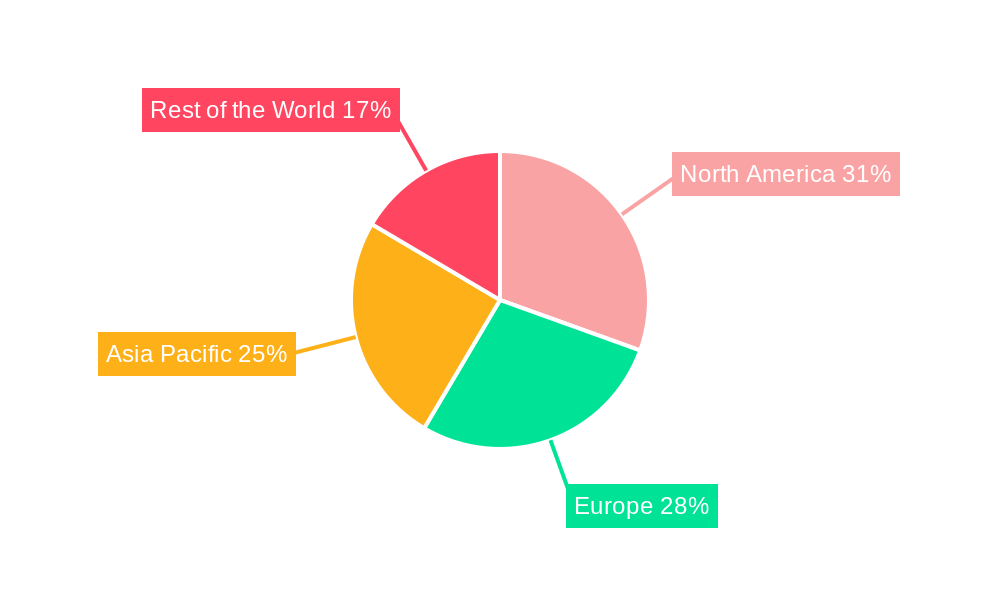
The market is characterized by a dynamic landscape, with key players like HORIBA, Newport Corporation, and Edmund Optics continually innovating to offer gratings with improved groove density, substrates, and coatings. The demand for specific grating sizes, such as 25 x 25 mm and 12.5 x 25 mm, is particularly strong, aligning with the form factors of prevalent optical instruments. However, challenges such as the high cost of precision manufacturing and the availability of alternative technologies like holographic gratings could present restraints. Despite these, the inherent advantages of ruled diffraction gratings in terms of efficiency, spectral resolution, and durability ensure their continued relevance. Geographically, North America and Europe are expected to lead the market due to significant R&D expenditure and established industries, while the Asia Pacific region, driven by China and India, is projected to exhibit the fastest growth, owing to expanding manufacturing capabilities and increasing adoption in emerging technological sectors.
This comprehensive market research report delves into the intricate landscape of Ruled Diffraction Gratings, offering an in-depth analysis of market structure, competitive dynamics, industry trends, and future growth prospects. Spanning the historical period of 2019–2024, with a base year of 2025 and a forecast period extending to 2033, this report provides actionable insights for stakeholders seeking to navigate the evolving market. We meticulously examine key segments, including applications like Laser, Astronomy, Optical Telecom, Monochromator and Spectrometer, and Others, alongside product types such as 12.5 x 12.5 mm, 25 x 25 mm, 12.5 x 25 mm, 12.7 x 12.7 mm, 30 x 30 mm, and Others. The report highlights significant industry developments and the strategic positioning of leading players.
Ruled Diffraction Gratings Market Structure & Competitive Dynamics
The global Ruled Diffraction Gratings market exhibits a moderately concentrated structure, with key players like HORIBA, Newport Corporation, Edmund Optics, Shimadzu Corporation, and Zeiss holding substantial market share. The innovation ecosystem is driven by continuous advancements in metrology, spectral analysis, and optical component miniaturization. Regulatory frameworks, while generally conducive to technological advancement, can influence manufacturing standards and import/export dynamics. Product substitutes, primarily holographic diffraction gratings and Fourier Transform Infrared (FTIR) spectroscopy, present a competitive challenge, particularly in niche applications demanding higher resolution or specific spectral characteristics. End-user trends are characterized by an increasing demand for high-precision optical instruments across scientific research, industrial automation, and defense sectors. Mergers and acquisitions (M&A) activities are anticipated to play a role in market consolidation, with estimated M&A deal values projected to reach several hundred million dollars over the forecast period, aimed at expanding product portfolios and geographic reach.
Ruled Diffraction Gratings Industry Trends & Insights
The Ruled Diffraction Gratings industry is poised for robust growth, driven by a confluence of technological advancements and escalating demand across diverse end-use sectors. The Compound Annual Growth Rate (CAGR) is estimated at a healthy xx%, indicating significant market expansion from an estimated market size of over one million in the base year of 2025. Key growth drivers include the burgeoning need for advanced spectroscopic solutions in life sciences, environmental monitoring, and industrial quality control. Technological disruptions are centered around enhanced groove density, improved efficiency, and the development of custom gratings for specialized applications, pushing the boundaries of spectral resolution and wavelength coverage. Consumer preferences are shifting towards more compact, cost-effective, and highly performant optical components, influencing product design and material innovation. Competitive dynamics are intensifying, with established players focusing on R&D to maintain their edge and emerging companies carving out niches through specialized offerings. Market penetration is expected to deepen as new applications for ruled diffraction gratings continue to emerge, particularly in areas like hyperspectral imaging and advanced laser systems. The market is also influenced by global supply chain resilience, with manufacturers investing in diversified sourcing and localized production capabilities to mitigate risks and ensure consistent availability of these critical optical components. The increasing adoption of artificial intelligence and machine learning in data analysis further fuels the demand for precise spectroscopic data, directly benefiting the ruled diffraction gratings market.
Dominant Markets & Segments in Ruled Diffraction Gratings
The Laser application segment is a dominant force within the Ruled Diffraction Gratings market, driven by the ubiquitous use of lasers in industrial manufacturing, telecommunications, scientific research, and medical procedures. The demand for precise wavelength control and spectral filtering in laser systems directly translates to a significant need for high-quality ruled diffraction gratings. Economic policies supporting advanced manufacturing and technological innovation, particularly in regions with strong industrial bases, further bolster this segment. Infrastructure development, including the expansion of research and development facilities, also plays a crucial role.
Within the Monochromator and Spectrometer application, ruled diffraction gratings are indispensable components, enabling high-resolution spectral analysis across a vast array of scientific disciplines. The burgeoning field of materials science, environmental monitoring, and chemical analysis are key drivers of growth in this segment. Investments in advanced analytical instrumentation, coupled with stringent quality control standards in industries like pharmaceuticals and food & beverage, create a sustained demand.
The Astronomy segment, while smaller in volume compared to industrial applications, represents a critical niche where ruled diffraction gratings are vital for astrophysical research, enabling the study of celestial objects and phenomena. Continued investment in space exploration and ground-based observatories fuels the demand for specialized, high-performance gratings.
In terms of product types, the 25 x 25 mm and 12.7 x 12.7 mm gratings often represent the sweet spot for a wide range of applications, balancing performance with cost-effectiveness. However, the "Others" category, encompassing custom-sized gratings tailored to specific OEM requirements, is also a significant contributor, reflecting the industry's move towards highly specialized solutions.
- Key Drivers for Dominance:
- Technological Advancement: Continuous improvements in groove precision and efficiency.
- Industrial Growth: Expansion of manufacturing, R&D, and quality control sectors.
- Scientific Research: Increasing demand for high-resolution spectral analysis.
- Government Funding: Investments in scientific infrastructure and advanced technology.
- Miniaturization Trends: Development of compact and efficient optical systems.
The dominance of these segments is further reinforced by favorable market penetration rates, estimated to be over xx% for the key application areas. The total market size for these dominant segments is projected to reach several million dollars by 2033, with significant contributions from North America and Europe due to their established research and industrial ecosystems.
Ruled Diffraction Gratings Product Innovations
Product innovation in Ruled Diffraction Gratings is primarily focused on enhancing efficiency, precision, and durability. Manufacturers are developing gratings with finer groove densities to achieve higher spectral resolution, crucial for advanced spectroscopic applications. Innovations also include improved coating technologies to minimize stray light and maximize signal throughput. These advancements translate to competitive advantages by enabling more accurate measurements in demanding fields like medical diagnostics, environmental monitoring, and cutting-edge laser systems. The integration of custom designs and specialized groove profiles further broadens the applicability of ruled diffraction gratings, addressing unique end-user requirements.
Report Segmentation & Scope
This report segments the Ruled Diffraction Gratings market across key application areas, including Laser, Astronomy, Optical Telecom, Monochromator and Spectrometer, and Others. The Laser segment is expected to witness a CAGR of xx% owing to the expanding use of lasers in industrial and medical applications. The Astronomy segment, while niche, will see steady growth driven by research investments. Optical Telecom benefits from the increasing demand for high-speed data transmission requiring precise wavelength management. The Monochromator and Spectrometer segment is a significant revenue generator, driven by advancements in analytical instrumentation. The Others category captures emerging applications and bespoke solutions.
In terms of product types, the market is analyzed for 12.5 x 12.5 mm, 25 x 25 mm, 12.5 x 25 mm, 12.7 x 12.7 mm, 30 x 30 mm, and Others (custom sizes). The 25 x 25 mm and 12.7 x 12.7 mm types are projected to maintain strong market positions due to their versatility and widespread adoption. Custom sizes, falling under the Others category, are anticipated to grow at a higher CAGR as industries demand specialized optical solutions.
Key Drivers of Ruled Diffraction Gratings Growth
The growth of the Ruled Diffraction Gratings market is propelled by several key factors. Technologically, the ongoing advancements in laser technology and spectroscopy necessitate increasingly precise and efficient gratings for wavelength selection and spectral analysis. Economically, the expansion of sectors like telecommunications, aerospace, and life sciences, coupled with increased R&D investments globally, creates a sustained demand. Regulatory initiatives promoting environmental monitoring and quality control also indirectly fuel the need for advanced analytical instruments incorporating these gratings. The growing demand for hyperspectral imaging in agriculture, defense, and mining further acts as a significant growth accelerant.
Challenges in the Ruled Diffraction Gratings Sector
Despite promising growth, the Ruled Diffraction Gratings sector faces several challenges. The manufacturing of high-precision gratings is a complex and capital-intensive process, leading to relatively high product costs, which can be a barrier for smaller research institutions or price-sensitive markets. Intense competition from holographic diffraction gratings, offering certain advantages in specific applications, poses a continuous challenge. Supply chain disruptions, particularly concerning raw materials and specialized manufacturing equipment, can impact production timelines and costs. Furthermore, the need for skilled labor in the manufacturing and calibration of these intricate optical components can present a human resource challenge.
Leading Players in the Ruled Diffraction Gratings Market
- HORIBA
- Newport Corporation
- Edmund Optics
- Shimadzu Corporation
- Zeiss
- Dynasil Corporation
- Kaiser Optical Systems
- Spectrogon AB
- Headwall Photonics
- Thorlabs
- Photop Technologies
- Spectrum Scientific
- Wasatch Photonics
- GratingWorks
- Shenyang Yibeite Optics
Key Developments in Ruled Diffraction Gratings Sector
- 2023: Edmund Optics launches a new series of high-efficiency ruled diffraction gratings for demanding spectroscopic applications, enhancing spectral resolution by over xx%.
- 2023: Thorlabs introduces advanced laser tuning gratings with improved groove profiles, leading to enhanced stability and narrower linewidths.
- 2022: Newport Corporation announces strategic partnerships to expand its custom ruled grating manufacturing capabilities, aiming to serve the growing OEM market.
- 2022: Shimadzu Corporation integrates novel ruled diffraction gratings into its next-generation spectrometer series, improving analytical accuracy by xx%.
- 2021: Spectrogon AB expands its production facility to meet increasing global demand for custom-designed ruled gratings.
Strategic Ruled Diffraction Gratings Market Outlook
The strategic outlook for the Ruled Diffraction Gratings market is highly positive, fueled by continuous technological innovation and the expanding application scope. Growth accelerators include the increasing adoption of spectroscopy in emerging fields like personalized medicine and advanced materials characterization. The trend towards miniaturization in optical systems will drive demand for compact and highly efficient gratings. Strategic opportunities lie in developing specialized gratings for emerging technologies such as quantum computing and advanced sensor systems. Collaboration between grating manufacturers and end-users will be crucial for co-developing tailored solutions that address specific market needs and drive further market penetration, projected to exceed xx% by 2033.
Ruled Diffraction Gratings Segmentation
-
1. Application
- 1.1. Laser
- 1.2. Astronomy
- 1.3. Optical Telecom
- 1.4. Monochromator and Spectrometer
- 1.5. Others
-
2. Types
- 2.1. 12.5 x 12.5 mm
- 2.2. 25 x 25 mm
- 2.3. 12.5 x 25 mm
- 2.4. 12.7 x 12.7 mm
- 2.5. 30 x 30 mm
- 2.6. Others
Ruled Diffraction Gratings Segmentation By Geography
-
1. North America
- 1.1. United States
- 1.2. Canada
- 1.3. Mexico
-
2. South America
- 2.1. Brazil
- 2.2. Argentina
- 2.3. Rest of South America
-
3. Europe
- 3.1. United Kingdom
- 3.2. Germany
- 3.3. France
- 3.4. Italy
- 3.5. Spain
- 3.6. Russia
- 3.7. Benelux
- 3.8. Nordics
- 3.9. Rest of Europe
-
4. Middle East & Africa
- 4.1. Turkey
- 4.2. Israel
- 4.3. GCC
- 4.4. North Africa
- 4.5. South Africa
- 4.6. Rest of Middle East & Africa
-
5. Asia Pacific
- 5.1. China
- 5.2. India
- 5.3. Japan
- 5.4. South Korea
- 5.5. ASEAN
- 5.6. Oceania
- 5.7. Rest of Asia Pacific
Ruled Diffraction Gratings REPORT HIGHLIGHTS
| Aspects | Details |
|---|---|
| Study Period | 2019-2033 |
| Base Year | 2024 |
| Estimated Year | 2025 |
| Forecast Period | 2025-2033 |
| Historical Period | 2019-2024 |
| Growth Rate | CAGR of XX% from 2019-2033 |
| Segmentation |
|
Table of Contents
- 1. Introduction
- 1.1. Research Scope
- 1.2. Market Segmentation
- 1.3. Research Methodology
- 1.4. Definitions and Assumptions
- 2. Executive Summary
- 2.1. Introduction
- 3. Market Dynamics
- 3.1. Introduction
- 3.2. Market Drivers
- 3.3. Market Restrains
- 3.4. Market Trends
- 4. Market Factor Analysis
- 4.1. Porters Five Forces
- 4.2. Supply/Value Chain
- 4.3. PESTEL analysis
- 4.4. Market Entropy
- 4.5. Patent/Trademark Analysis
- 5. Global Ruled Diffraction Gratings Analysis, Insights and Forecast, 2019-2031
- 5.1. Market Analysis, Insights and Forecast - by Application
- 5.1.1. Laser
- 5.1.2. Astronomy
- 5.1.3. Optical Telecom
- 5.1.4. Monochromator and Spectrometer
- 5.1.5. Others
- 5.2. Market Analysis, Insights and Forecast - by Types
- 5.2.1. 12.5 x 12.5 mm
- 5.2.2. 25 x 25 mm
- 5.2.3. 12.5 x 25 mm
- 5.2.4. 12.7 x 12.7 mm
- 5.2.5. 30 x 30 mm
- 5.2.6. Others
- 5.3. Market Analysis, Insights and Forecast - by Region
- 5.3.1. North America
- 5.3.2. South America
- 5.3.3. Europe
- 5.3.4. Middle East & Africa
- 5.3.5. Asia Pacific
- 5.1. Market Analysis, Insights and Forecast - by Application
- 6. North America Ruled Diffraction Gratings Analysis, Insights and Forecast, 2019-2031
- 6.1. Market Analysis, Insights and Forecast - by Application
- 6.1.1. Laser
- 6.1.2. Astronomy
- 6.1.3. Optical Telecom
- 6.1.4. Monochromator and Spectrometer
- 6.1.5. Others
- 6.2. Market Analysis, Insights and Forecast - by Types
- 6.2.1. 12.5 x 12.5 mm
- 6.2.2. 25 x 25 mm
- 6.2.3. 12.5 x 25 mm
- 6.2.4. 12.7 x 12.7 mm
- 6.2.5. 30 x 30 mm
- 6.2.6. Others
- 6.1. Market Analysis, Insights and Forecast - by Application
- 7. South America Ruled Diffraction Gratings Analysis, Insights and Forecast, 2019-2031
- 7.1. Market Analysis, Insights and Forecast - by Application
- 7.1.1. Laser
- 7.1.2. Astronomy
- 7.1.3. Optical Telecom
- 7.1.4. Monochromator and Spectrometer
- 7.1.5. Others
- 7.2. Market Analysis, Insights and Forecast - by Types
- 7.2.1. 12.5 x 12.5 mm
- 7.2.2. 25 x 25 mm
- 7.2.3. 12.5 x 25 mm
- 7.2.4. 12.7 x 12.7 mm
- 7.2.5. 30 x 30 mm
- 7.2.6. Others
- 7.1. Market Analysis, Insights and Forecast - by Application
- 8. Europe Ruled Diffraction Gratings Analysis, Insights and Forecast, 2019-2031
- 8.1. Market Analysis, Insights and Forecast - by Application
- 8.1.1. Laser
- 8.1.2. Astronomy
- 8.1.3. Optical Telecom
- 8.1.4. Monochromator and Spectrometer
- 8.1.5. Others
- 8.2. Market Analysis, Insights and Forecast - by Types
- 8.2.1. 12.5 x 12.5 mm
- 8.2.2. 25 x 25 mm
- 8.2.3. 12.5 x 25 mm
- 8.2.4. 12.7 x 12.7 mm
- 8.2.5. 30 x 30 mm
- 8.2.6. Others
- 8.1. Market Analysis, Insights and Forecast - by Application
- 9. Middle East & Africa Ruled Diffraction Gratings Analysis, Insights and Forecast, 2019-2031
- 9.1. Market Analysis, Insights and Forecast - by Application
- 9.1.1. Laser
- 9.1.2. Astronomy
- 9.1.3. Optical Telecom
- 9.1.4. Monochromator and Spectrometer
- 9.1.5. Others
- 9.2. Market Analysis, Insights and Forecast - by Types
- 9.2.1. 12.5 x 12.5 mm
- 9.2.2. 25 x 25 mm
- 9.2.3. 12.5 x 25 mm
- 9.2.4. 12.7 x 12.7 mm
- 9.2.5. 30 x 30 mm
- 9.2.6. Others
- 9.1. Market Analysis, Insights and Forecast - by Application
- 10. Asia Pacific Ruled Diffraction Gratings Analysis, Insights and Forecast, 2019-2031
- 10.1. Market Analysis, Insights and Forecast - by Application
- 10.1.1. Laser
- 10.1.2. Astronomy
- 10.1.3. Optical Telecom
- 10.1.4. Monochromator and Spectrometer
- 10.1.5. Others
- 10.2. Market Analysis, Insights and Forecast - by Types
- 10.2.1. 12.5 x 12.5 mm
- 10.2.2. 25 x 25 mm
- 10.2.3. 12.5 x 25 mm
- 10.2.4. 12.7 x 12.7 mm
- 10.2.5. 30 x 30 mm
- 10.2.6. Others
- 10.1. Market Analysis, Insights and Forecast - by Application
- 11. Competitive Analysis
- 11.1. Global Market Share Analysis 2024
- 11.2. Company Profiles
- 11.2.1 HORIBA
- 11.2.1.1. Overview
- 11.2.1.2. Products
- 11.2.1.3. SWOT Analysis
- 11.2.1.4. Recent Developments
- 11.2.1.5. Financials (Based on Availability)
- 11.2.2 Newport Corporation
- 11.2.2.1. Overview
- 11.2.2.2. Products
- 11.2.2.3. SWOT Analysis
- 11.2.2.4. Recent Developments
- 11.2.2.5. Financials (Based on Availability)
- 11.2.3 Edmund Optics
- 11.2.3.1. Overview
- 11.2.3.2. Products
- 11.2.3.3. SWOT Analysis
- 11.2.3.4. Recent Developments
- 11.2.3.5. Financials (Based on Availability)
- 11.2.4 Shimadzu Corporation
- 11.2.4.1. Overview
- 11.2.4.2. Products
- 11.2.4.3. SWOT Analysis
- 11.2.4.4. Recent Developments
- 11.2.4.5. Financials (Based on Availability)
- 11.2.5 Zeiss
- 11.2.5.1. Overview
- 11.2.5.2. Products
- 11.2.5.3. SWOT Analysis
- 11.2.5.4. Recent Developments
- 11.2.5.5. Financials (Based on Availability)
- 11.2.6 Dynasil Corporation
- 11.2.6.1. Overview
- 11.2.6.2. Products
- 11.2.6.3. SWOT Analysis
- 11.2.6.4. Recent Developments
- 11.2.6.5. Financials (Based on Availability)
- 11.2.7 Kaiser Optical Systems
- 11.2.7.1. Overview
- 11.2.7.2. Products
- 11.2.7.3. SWOT Analysis
- 11.2.7.4. Recent Developments
- 11.2.7.5. Financials (Based on Availability)
- 11.2.8 Spectrogon AB
- 11.2.8.1. Overview
- 11.2.8.2. Products
- 11.2.8.3. SWOT Analysis
- 11.2.8.4. Recent Developments
- 11.2.8.5. Financials (Based on Availability)
- 11.2.9 Headwall Photonics
- 11.2.9.1. Overview
- 11.2.9.2. Products
- 11.2.9.3. SWOT Analysis
- 11.2.9.4. Recent Developments
- 11.2.9.5. Financials (Based on Availability)
- 11.2.10 Thorlabs
- 11.2.10.1. Overview
- 11.2.10.2. Products
- 11.2.10.3. SWOT Analysis
- 11.2.10.4. Recent Developments
- 11.2.10.5. Financials (Based on Availability)
- 11.2.11 Photop Technologies
- 11.2.11.1. Overview
- 11.2.11.2. Products
- 11.2.11.3. SWOT Analysis
- 11.2.11.4. Recent Developments
- 11.2.11.5. Financials (Based on Availability)
- 11.2.12 Spectrum Scientific
- 11.2.12.1. Overview
- 11.2.12.2. Products
- 11.2.12.3. SWOT Analysis
- 11.2.12.4. Recent Developments
- 11.2.12.5. Financials (Based on Availability)
- 11.2.13 Wasatch Photonics
- 11.2.13.1. Overview
- 11.2.13.2. Products
- 11.2.13.3. SWOT Analysis
- 11.2.13.4. Recent Developments
- 11.2.13.5. Financials (Based on Availability)
- 11.2.14 GratingWorks
- 11.2.14.1. Overview
- 11.2.14.2. Products
- 11.2.14.3. SWOT Analysis
- 11.2.14.4. Recent Developments
- 11.2.14.5. Financials (Based on Availability)
- 11.2.15 Shenyang Yibeite Optics
- 11.2.15.1. Overview
- 11.2.15.2. Products
- 11.2.15.3. SWOT Analysis
- 11.2.15.4. Recent Developments
- 11.2.15.5. Financials (Based on Availability)
- 11.2.1 HORIBA
List of Figures
- Figure 1: Global Ruled Diffraction Gratings Revenue Breakdown (million, %) by Region 2024 & 2032
- Figure 2: Global Ruled Diffraction Gratings Volume Breakdown (K, %) by Region 2024 & 2032
- Figure 3: North America Ruled Diffraction Gratings Revenue (million), by Application 2024 & 2032
- Figure 4: North America Ruled Diffraction Gratings Volume (K), by Application 2024 & 2032
- Figure 5: North America Ruled Diffraction Gratings Revenue Share (%), by Application 2024 & 2032
- Figure 6: North America Ruled Diffraction Gratings Volume Share (%), by Application 2024 & 2032
- Figure 7: North America Ruled Diffraction Gratings Revenue (million), by Types 2024 & 2032
- Figure 8: North America Ruled Diffraction Gratings Volume (K), by Types 2024 & 2032
- Figure 9: North America Ruled Diffraction Gratings Revenue Share (%), by Types 2024 & 2032
- Figure 10: North America Ruled Diffraction Gratings Volume Share (%), by Types 2024 & 2032
- Figure 11: North America Ruled Diffraction Gratings Revenue (million), by Country 2024 & 2032
- Figure 12: North America Ruled Diffraction Gratings Volume (K), by Country 2024 & 2032
- Figure 13: North America Ruled Diffraction Gratings Revenue Share (%), by Country 2024 & 2032
- Figure 14: North America Ruled Diffraction Gratings Volume Share (%), by Country 2024 & 2032
- Figure 15: South America Ruled Diffraction Gratings Revenue (million), by Application 2024 & 2032
- Figure 16: South America Ruled Diffraction Gratings Volume (K), by Application 2024 & 2032
- Figure 17: South America Ruled Diffraction Gratings Revenue Share (%), by Application 2024 & 2032
- Figure 18: South America Ruled Diffraction Gratings Volume Share (%), by Application 2024 & 2032
- Figure 19: South America Ruled Diffraction Gratings Revenue (million), by Types 2024 & 2032
- Figure 20: South America Ruled Diffraction Gratings Volume (K), by Types 2024 & 2032
- Figure 21: South America Ruled Diffraction Gratings Revenue Share (%), by Types 2024 & 2032
- Figure 22: South America Ruled Diffraction Gratings Volume Share (%), by Types 2024 & 2032
- Figure 23: South America Ruled Diffraction Gratings Revenue (million), by Country 2024 & 2032
- Figure 24: South America Ruled Diffraction Gratings Volume (K), by Country 2024 & 2032
- Figure 25: South America Ruled Diffraction Gratings Revenue Share (%), by Country 2024 & 2032
- Figure 26: South America Ruled Diffraction Gratings Volume Share (%), by Country 2024 & 2032
- Figure 27: Europe Ruled Diffraction Gratings Revenue (million), by Application 2024 & 2032
- Figure 28: Europe Ruled Diffraction Gratings Volume (K), by Application 2024 & 2032
- Figure 29: Europe Ruled Diffraction Gratings Revenue Share (%), by Application 2024 & 2032
- Figure 30: Europe Ruled Diffraction Gratings Volume Share (%), by Application 2024 & 2032
- Figure 31: Europe Ruled Diffraction Gratings Revenue (million), by Types 2024 & 2032
- Figure 32: Europe Ruled Diffraction Gratings Volume (K), by Types 2024 & 2032
- Figure 33: Europe Ruled Diffraction Gratings Revenue Share (%), by Types 2024 & 2032
- Figure 34: Europe Ruled Diffraction Gratings Volume Share (%), by Types 2024 & 2032
- Figure 35: Europe Ruled Diffraction Gratings Revenue (million), by Country 2024 & 2032
- Figure 36: Europe Ruled Diffraction Gratings Volume (K), by Country 2024 & 2032
- Figure 37: Europe Ruled Diffraction Gratings Revenue Share (%), by Country 2024 & 2032
- Figure 38: Europe Ruled Diffraction Gratings Volume Share (%), by Country 2024 & 2032
- Figure 39: Middle East & Africa Ruled Diffraction Gratings Revenue (million), by Application 2024 & 2032
- Figure 40: Middle East & Africa Ruled Diffraction Gratings Volume (K), by Application 2024 & 2032
- Figure 41: Middle East & Africa Ruled Diffraction Gratings Revenue Share (%), by Application 2024 & 2032
- Figure 42: Middle East & Africa Ruled Diffraction Gratings Volume Share (%), by Application 2024 & 2032
- Figure 43: Middle East & Africa Ruled Diffraction Gratings Revenue (million), by Types 2024 & 2032
- Figure 44: Middle East & Africa Ruled Diffraction Gratings Volume (K), by Types 2024 & 2032
- Figure 45: Middle East & Africa Ruled Diffraction Gratings Revenue Share (%), by Types 2024 & 2032
- Figure 46: Middle East & Africa Ruled Diffraction Gratings Volume Share (%), by Types 2024 & 2032
- Figure 47: Middle East & Africa Ruled Diffraction Gratings Revenue (million), by Country 2024 & 2032
- Figure 48: Middle East & Africa Ruled Diffraction Gratings Volume (K), by Country 2024 & 2032
- Figure 49: Middle East & Africa Ruled Diffraction Gratings Revenue Share (%), by Country 2024 & 2032
- Figure 50: Middle East & Africa Ruled Diffraction Gratings Volume Share (%), by Country 2024 & 2032
- Figure 51: Asia Pacific Ruled Diffraction Gratings Revenue (million), by Application 2024 & 2032
- Figure 52: Asia Pacific Ruled Diffraction Gratings Volume (K), by Application 2024 & 2032
- Figure 53: Asia Pacific Ruled Diffraction Gratings Revenue Share (%), by Application 2024 & 2032
- Figure 54: Asia Pacific Ruled Diffraction Gratings Volume Share (%), by Application 2024 & 2032
- Figure 55: Asia Pacific Ruled Diffraction Gratings Revenue (million), by Types 2024 & 2032
- Figure 56: Asia Pacific Ruled Diffraction Gratings Volume (K), by Types 2024 & 2032
- Figure 57: Asia Pacific Ruled Diffraction Gratings Revenue Share (%), by Types 2024 & 2032
- Figure 58: Asia Pacific Ruled Diffraction Gratings Volume Share (%), by Types 2024 & 2032
- Figure 59: Asia Pacific Ruled Diffraction Gratings Revenue (million), by Country 2024 & 2032
- Figure 60: Asia Pacific Ruled Diffraction Gratings Volume (K), by Country 2024 & 2032
- Figure 61: Asia Pacific Ruled Diffraction Gratings Revenue Share (%), by Country 2024 & 2032
- Figure 62: Asia Pacific Ruled Diffraction Gratings Volume Share (%), by Country 2024 & 2032
List of Tables
- Table 1: Global Ruled Diffraction Gratings Revenue million Forecast, by Region 2019 & 2032
- Table 2: Global Ruled Diffraction Gratings Volume K Forecast, by Region 2019 & 2032
- Table 3: Global Ruled Diffraction Gratings Revenue million Forecast, by Application 2019 & 2032
- Table 4: Global Ruled Diffraction Gratings Volume K Forecast, by Application 2019 & 2032
- Table 5: Global Ruled Diffraction Gratings Revenue million Forecast, by Types 2019 & 2032
- Table 6: Global Ruled Diffraction Gratings Volume K Forecast, by Types 2019 & 2032
- Table 7: Global Ruled Diffraction Gratings Revenue million Forecast, by Region 2019 & 2032
- Table 8: Global Ruled Diffraction Gratings Volume K Forecast, by Region 2019 & 2032
- Table 9: Global Ruled Diffraction Gratings Revenue million Forecast, by Application 2019 & 2032
- Table 10: Global Ruled Diffraction Gratings Volume K Forecast, by Application 2019 & 2032
- Table 11: Global Ruled Diffraction Gratings Revenue million Forecast, by Types 2019 & 2032
- Table 12: Global Ruled Diffraction Gratings Volume K Forecast, by Types 2019 & 2032
- Table 13: Global Ruled Diffraction Gratings Revenue million Forecast, by Country 2019 & 2032
- Table 14: Global Ruled Diffraction Gratings Volume K Forecast, by Country 2019 & 2032
- Table 15: United States Ruled Diffraction Gratings Revenue (million) Forecast, by Application 2019 & 2032
- Table 16: United States Ruled Diffraction Gratings Volume (K) Forecast, by Application 2019 & 2032
- Table 17: Canada Ruled Diffraction Gratings Revenue (million) Forecast, by Application 2019 & 2032
- Table 18: Canada Ruled Diffraction Gratings Volume (K) Forecast, by Application 2019 & 2032
- Table 19: Mexico Ruled Diffraction Gratings Revenue (million) Forecast, by Application 2019 & 2032
- Table 20: Mexico Ruled Diffraction Gratings Volume (K) Forecast, by Application 2019 & 2032
- Table 21: Global Ruled Diffraction Gratings Revenue million Forecast, by Application 2019 & 2032
- Table 22: Global Ruled Diffraction Gratings Volume K Forecast, by Application 2019 & 2032
- Table 23: Global Ruled Diffraction Gratings Revenue million Forecast, by Types 2019 & 2032
- Table 24: Global Ruled Diffraction Gratings Volume K Forecast, by Types 2019 & 2032
- Table 25: Global Ruled Diffraction Gratings Revenue million Forecast, by Country 2019 & 2032
- Table 26: Global Ruled Diffraction Gratings Volume K Forecast, by Country 2019 & 2032
- Table 27: Brazil Ruled Diffraction Gratings Revenue (million) Forecast, by Application 2019 & 2032
- Table 28: Brazil Ruled Diffraction Gratings Volume (K) Forecast, by Application 2019 & 2032
- Table 29: Argentina Ruled Diffraction Gratings Revenue (million) Forecast, by Application 2019 & 2032
- Table 30: Argentina Ruled Diffraction Gratings Volume (K) Forecast, by Application 2019 & 2032
- Table 31: Rest of South America Ruled Diffraction Gratings Revenue (million) Forecast, by Application 2019 & 2032
- Table 32: Rest of South America Ruled Diffraction Gratings Volume (K) Forecast, by Application 2019 & 2032
- Table 33: Global Ruled Diffraction Gratings Revenue million Forecast, by Application 2019 & 2032
- Table 34: Global Ruled Diffraction Gratings Volume K Forecast, by Application 2019 & 2032
- Table 35: Global Ruled Diffraction Gratings Revenue million Forecast, by Types 2019 & 2032
- Table 36: Global Ruled Diffraction Gratings Volume K Forecast, by Types 2019 & 2032
- Table 37: Global Ruled Diffraction Gratings Revenue million Forecast, by Country 2019 & 2032
- Table 38: Global Ruled Diffraction Gratings Volume K Forecast, by Country 2019 & 2032
- Table 39: United Kingdom Ruled Diffraction Gratings Revenue (million) Forecast, by Application 2019 & 2032
- Table 40: United Kingdom Ruled Diffraction Gratings Volume (K) Forecast, by Application 2019 & 2032
- Table 41: Germany Ruled Diffraction Gratings Revenue (million) Forecast, by Application 2019 & 2032
- Table 42: Germany Ruled Diffraction Gratings Volume (K) Forecast, by Application 2019 & 2032
- Table 43: France Ruled Diffraction Gratings Revenue (million) Forecast, by Application 2019 & 2032
- Table 44: France Ruled Diffraction Gratings Volume (K) Forecast, by Application 2019 & 2032
- Table 45: Italy Ruled Diffraction Gratings Revenue (million) Forecast, by Application 2019 & 2032
- Table 46: Italy Ruled Diffraction Gratings Volume (K) Forecast, by Application 2019 & 2032
- Table 47: Spain Ruled Diffraction Gratings Revenue (million) Forecast, by Application 2019 & 2032
- Table 48: Spain Ruled Diffraction Gratings Volume (K) Forecast, by Application 2019 & 2032
- Table 49: Russia Ruled Diffraction Gratings Revenue (million) Forecast, by Application 2019 & 2032
- Table 50: Russia Ruled Diffraction Gratings Volume (K) Forecast, by Application 2019 & 2032
- Table 51: Benelux Ruled Diffraction Gratings Revenue (million) Forecast, by Application 2019 & 2032
- Table 52: Benelux Ruled Diffraction Gratings Volume (K) Forecast, by Application 2019 & 2032
- Table 53: Nordics Ruled Diffraction Gratings Revenue (million) Forecast, by Application 2019 & 2032
- Table 54: Nordics Ruled Diffraction Gratings Volume (K) Forecast, by Application 2019 & 2032
- Table 55: Rest of Europe Ruled Diffraction Gratings Revenue (million) Forecast, by Application 2019 & 2032
- Table 56: Rest of Europe Ruled Diffraction Gratings Volume (K) Forecast, by Application 2019 & 2032
- Table 57: Global Ruled Diffraction Gratings Revenue million Forecast, by Application 2019 & 2032
- Table 58: Global Ruled Diffraction Gratings Volume K Forecast, by Application 2019 & 2032
- Table 59: Global Ruled Diffraction Gratings Revenue million Forecast, by Types 2019 & 2032
- Table 60: Global Ruled Diffraction Gratings Volume K Forecast, by Types 2019 & 2032
- Table 61: Global Ruled Diffraction Gratings Revenue million Forecast, by Country 2019 & 2032
- Table 62: Global Ruled Diffraction Gratings Volume K Forecast, by Country 2019 & 2032
- Table 63: Turkey Ruled Diffraction Gratings Revenue (million) Forecast, by Application 2019 & 2032
- Table 64: Turkey Ruled Diffraction Gratings Volume (K) Forecast, by Application 2019 & 2032
- Table 65: Israel Ruled Diffraction Gratings Revenue (million) Forecast, by Application 2019 & 2032
- Table 66: Israel Ruled Diffraction Gratings Volume (K) Forecast, by Application 2019 & 2032
- Table 67: GCC Ruled Diffraction Gratings Revenue (million) Forecast, by Application 2019 & 2032
- Table 68: GCC Ruled Diffraction Gratings Volume (K) Forecast, by Application 2019 & 2032
- Table 69: North Africa Ruled Diffraction Gratings Revenue (million) Forecast, by Application 2019 & 2032
- Table 70: North Africa Ruled Diffraction Gratings Volume (K) Forecast, by Application 2019 & 2032
- Table 71: South Africa Ruled Diffraction Gratings Revenue (million) Forecast, by Application 2019 & 2032
- Table 72: South Africa Ruled Diffraction Gratings Volume (K) Forecast, by Application 2019 & 2032
- Table 73: Rest of Middle East & Africa Ruled Diffraction Gratings Revenue (million) Forecast, by Application 2019 & 2032
- Table 74: Rest of Middle East & Africa Ruled Diffraction Gratings Volume (K) Forecast, by Application 2019 & 2032
- Table 75: Global Ruled Diffraction Gratings Revenue million Forecast, by Application 2019 & 2032
- Table 76: Global Ruled Diffraction Gratings Volume K Forecast, by Application 2019 & 2032
- Table 77: Global Ruled Diffraction Gratings Revenue million Forecast, by Types 2019 & 2032
- Table 78: Global Ruled Diffraction Gratings Volume K Forecast, by Types 2019 & 2032
- Table 79: Global Ruled Diffraction Gratings Revenue million Forecast, by Country 2019 & 2032
- Table 80: Global Ruled Diffraction Gratings Volume K Forecast, by Country 2019 & 2032
- Table 81: China Ruled Diffraction Gratings Revenue (million) Forecast, by Application 2019 & 2032
- Table 82: China Ruled Diffraction Gratings Volume (K) Forecast, by Application 2019 & 2032
- Table 83: India Ruled Diffraction Gratings Revenue (million) Forecast, by Application 2019 & 2032
- Table 84: India Ruled Diffraction Gratings Volume (K) Forecast, by Application 2019 & 2032
- Table 85: Japan Ruled Diffraction Gratings Revenue (million) Forecast, by Application 2019 & 2032
- Table 86: Japan Ruled Diffraction Gratings Volume (K) Forecast, by Application 2019 & 2032
- Table 87: South Korea Ruled Diffraction Gratings Revenue (million) Forecast, by Application 2019 & 2032
- Table 88: South Korea Ruled Diffraction Gratings Volume (K) Forecast, by Application 2019 & 2032
- Table 89: ASEAN Ruled Diffraction Gratings Revenue (million) Forecast, by Application 2019 & 2032
- Table 90: ASEAN Ruled Diffraction Gratings Volume (K) Forecast, by Application 2019 & 2032
- Table 91: Oceania Ruled Diffraction Gratings Revenue (million) Forecast, by Application 2019 & 2032
- Table 92: Oceania Ruled Diffraction Gratings Volume (K) Forecast, by Application 2019 & 2032
- Table 93: Rest of Asia Pacific Ruled Diffraction Gratings Revenue (million) Forecast, by Application 2019 & 2032
- Table 94: Rest of Asia Pacific Ruled Diffraction Gratings Volume (K) Forecast, by Application 2019 & 2032
Frequently Asked Questions
1. What is the projected Compound Annual Growth Rate (CAGR) of the Ruled Diffraction Gratings?
The projected CAGR is approximately XX%.
2. Which companies are prominent players in the Ruled Diffraction Gratings?
Key companies in the market include HORIBA, Newport Corporation, Edmund Optics, Shimadzu Corporation, Zeiss, Dynasil Corporation, Kaiser Optical Systems, Spectrogon AB, Headwall Photonics, Thorlabs, Photop Technologies, Spectrum Scientific, Wasatch Photonics, GratingWorks, Shenyang Yibeite Optics.
3. What are the main segments of the Ruled Diffraction Gratings?
The market segments include Application, Types.
4. Can you provide details about the market size?
The market size is estimated to be USD XXX million as of 2022.
5. What are some drivers contributing to market growth?
N/A
6. What are the notable trends driving market growth?
N/A
7. Are there any restraints impacting market growth?
N/A
8. Can you provide examples of recent developments in the market?
N/A
9. What pricing options are available for accessing the report?
Pricing options include single-user, multi-user, and enterprise licenses priced at USD 3350.00, USD 5025.00, and USD 6700.00 respectively.
10. Is the market size provided in terms of value or volume?
The market size is provided in terms of value, measured in million and volume, measured in K.
11. Are there any specific market keywords associated with the report?
Yes, the market keyword associated with the report is "Ruled Diffraction Gratings," which aids in identifying and referencing the specific market segment covered.
12. How do I determine which pricing option suits my needs best?
The pricing options vary based on user requirements and access needs. Individual users may opt for single-user licenses, while businesses requiring broader access may choose multi-user or enterprise licenses for cost-effective access to the report.
13. Are there any additional resources or data provided in the Ruled Diffraction Gratings report?
While the report offers comprehensive insights, it's advisable to review the specific contents or supplementary materials provided to ascertain if additional resources or data are available.
14. How can I stay updated on further developments or reports in the Ruled Diffraction Gratings?
To stay informed about further developments, trends, and reports in the Ruled Diffraction Gratings, consider subscribing to industry newsletters, following relevant companies and organizations, or regularly checking reputable industry news sources and publications.
Methodology
Step 1 - Identification of Relevant Samples Size from Population Database


Step 2 - Approaches for Defining Global Market Size (Value, Volume* & Price*)

Note*: In applicable scenarios
Step 3 - Data Sources
Primary Research
- Web Analytics
- Survey Reports
- Research Institute
- Latest Research Reports
- Opinion Leaders
Secondary Research
- Annual Reports
- White Paper
- Latest Press Release
- Industry Association
- Paid Database
- Investor Presentations

Step 4 - Data Triangulation
Involves using different sources of information in order to increase the validity of a study
These sources are likely to be stakeholders in a program - participants, other researchers, program staff, other community members, and so on.
Then we put all data in single framework & apply various statistical tools to find out the dynamic on the market.
During the analysis stage, feedback from the stakeholder groups would be compared to determine areas of agreement as well as areas of divergence


