
Key Insights
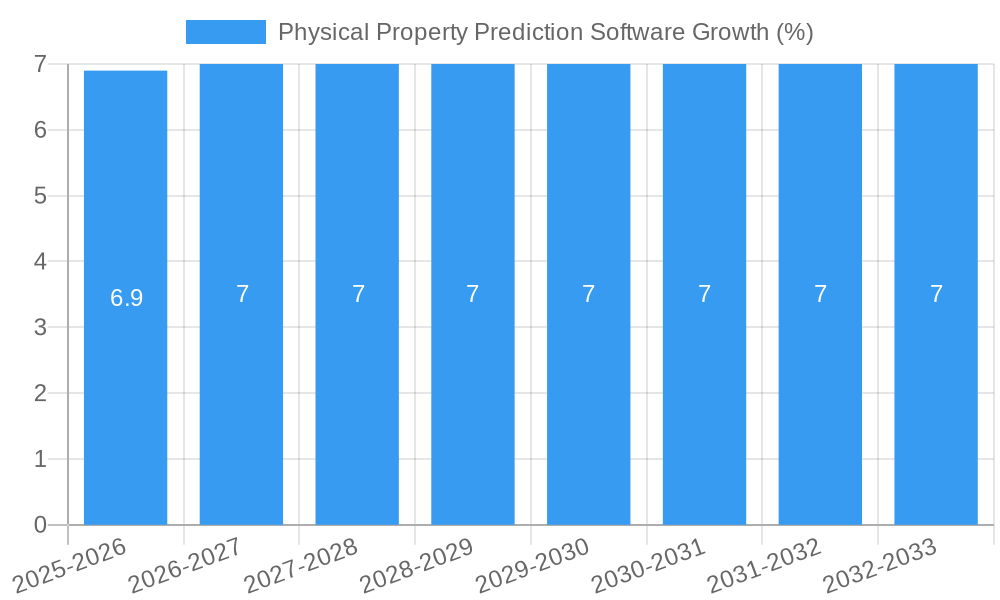
The global Physical Property Prediction Software market is poised for significant expansion, projected to reach an estimated \$2,500 million by 2025, with a robust Compound Annual Growth Rate (CAGR) of 7% anticipated throughout the forecast period of 2025-2033. This growth is propelled by a confluence of critical factors. The burgeoning demand for accurate and efficient prediction of physical properties across diverse applications, including the chemical and pharmaceutical industries, serves as a primary driver. In the chemical sector, precise property predictions are essential for optimizing reaction pathways, designing new materials, and ensuring process safety and efficiency. Similarly, the pharmaceutical industry relies heavily on such software for drug discovery, formulation development, and predicting drug solubility and stability, thereby accelerating the R&D lifecycle. The increasing adoption of cloud-based solutions is further augmenting market growth, offering scalability, accessibility, and cost-effectiveness compared to traditional on-premise installations. Moreover, advancements in computational chemistry, machine learning, and artificial intelligence are continuously enhancing the accuracy and predictive capabilities of these software solutions, making them indispensable tools for researchers and developers.
The market landscape is characterized by intense innovation and strategic collaborations among key industry players. Leading companies such as AspenTech, IBM (Hafnium Labs ApS), and NVIDIA are investing heavily in research and development to create more sophisticated and user-friendly prediction tools. Emerging trends include the integration of quantum chemistry principles, the development of AI-driven predictive models, and the creation of comprehensive databases that can handle complex molecular structures. While the market benefits from these technological advancements and widespread adoption, certain restraints are also observed. The initial high cost of implementation for some advanced software, coupled with the need for specialized expertise to operate them effectively, can pose challenges for smaller enterprises. However, the long-term benefits of improved accuracy, reduced experimental costs, and accelerated innovation are expected to outweigh these initial hurdles, ensuring sustained market expansion. The Asia Pacific region, particularly China and India, is emerging as a high-growth area due to rapid industrialization and increasing investments in research and development across the chemical and pharmaceutical sectors.
Comprehensive Report: Physical Property Prediction Software Market Analysis 2019–2033
This in-depth report provides a meticulous examination of the global Physical Property Prediction Software market. Spanning a Study Period of 2019–2033, with a Base Year of 2025 and a Forecast Period of 2025–2033, it offers critical insights into market structure, industry trends, dominant segments, product innovations, and strategic outlook. The analysis leverages historical data from 2019–2024 to project future market trajectories, making it an indispensable resource for stakeholders in the chemical, pharmacy, and physical thermodynamics industries. We cover both Cloud Based and On-Premise software solutions, identifying key players and their strategic initiatives.
Physical Property Prediction Software Market Structure & Competitive Dynamics
The Physical Property Prediction Software market exhibits a moderate level of concentration, with several key players like AspenTech, IBM (Hafnium Labs ApS), and ProSim holding significant market share. Innovation ecosystems are vibrant, driven by continuous advancements in computational chemistry, machine learning, and AI algorithms, which are crucial for accurate predictive modeling and molecular simulation. Regulatory frameworks, particularly in the pharmacy sector, impose stringent validation requirements for predictive tools, influencing software development and adoption. Product substitutes, including experimental methods and traditional database searches, continue to co-exist, but advanced software offers unparalleled speed and cost-efficiency for physicochemical property prediction. End-user trends are shifting towards more integrated workflows and user-friendly interfaces, driving demand for cloud-based solutions. Merger and acquisition (M&A) activities, while not dominant, are present, with deal values estimated to be in the range of several million to tens of millions of dollars, signaling consolidation and strategic expansion. For instance, acquisitions aimed at bolstering AI-driven drug discovery capabilities are common.
- Market Share: Leading companies are estimated to hold a combined market share of approximately 65%, with a projected market size exceeding several million dollars.
- M&A Deal Values: The average M&A deal value for strategic acquisitions in this space is estimated to be in the range of $5 million to $25 million.
- Innovation Focus: Key areas of innovation include enhanced accuracy of QSAR models, integration with cheminformatics platforms, and development of highly scalable computational fluid dynamics (CFD) modules.
Physical Property Prediction Software Industry Trends & Insights
The Physical Property Prediction Software market is poised for robust growth, driven by several interconnected factors. The increasing demand for faster and more cost-effective research and development cycles in the chemical and pharmaceutical industries is a primary catalyst. Companies are increasingly relying on in silico methods for screening compounds, optimizing formulations, and predicting thermodynamic properties, thereby reducing the need for extensive and costly experimental testing. The advent of advanced machine learning and artificial intelligence algorithms has significantly improved the accuracy and predictive power of these software solutions, making them indispensable tools for drug discovery, materials science, and process optimization. The growing complexity of chemical structures and the sheer volume of data being generated in research laboratories further necessitate sophisticated data analysis and prediction tools.
Furthermore, the shift towards digital transformation across industries, coupled with the proliferation of big data in R&D, is creating a fertile ground for the adoption of cloud-based physical property prediction software. These solutions offer scalability, accessibility, and lower upfront infrastructure costs, making them attractive to a wider range of organizations, including smaller biotech firms and academic institutions. The pharmaceutical industry, in particular, is witnessing a surge in demand for software that can accurately predict drug solubility, permeability, and toxicity, thereby accelerating the drug development pipeline. Similarly, the chemical industry is leveraging these tools for predicting reaction kinetics, equilibrium constants, and material properties to optimize manufacturing processes and develop novel materials.
The physical thermodynamics segment is also experiencing significant growth as researchers seek to understand and predict complex phase behaviors, energy transfers, and chemical equilibria with greater precision. The integration of cheminformatics and computational chemistry functionalities within single platforms is a key trend, enabling seamless workflows from molecular design to property prediction. The increasing emphasis on sustainable chemistry and green processes is also driving the demand for software that can predict the environmental impact and lifecycle assessment of chemicals and materials. The competitive landscape is characterized by continuous innovation, with companies investing heavily in R&D to enhance their predictive algorithms, expand their property databases, and offer more comprehensive solutions. This competitive pressure, while posing challenges for some, ultimately benefits end-users through improved software capabilities and broader accessibility. The CAGR for this market is projected to be in the range of 12-15% over the forecast period, with market penetration expected to exceed 70% in key sectors by 2033.
Dominant Markets & Segments in Physical Property Prediction Software
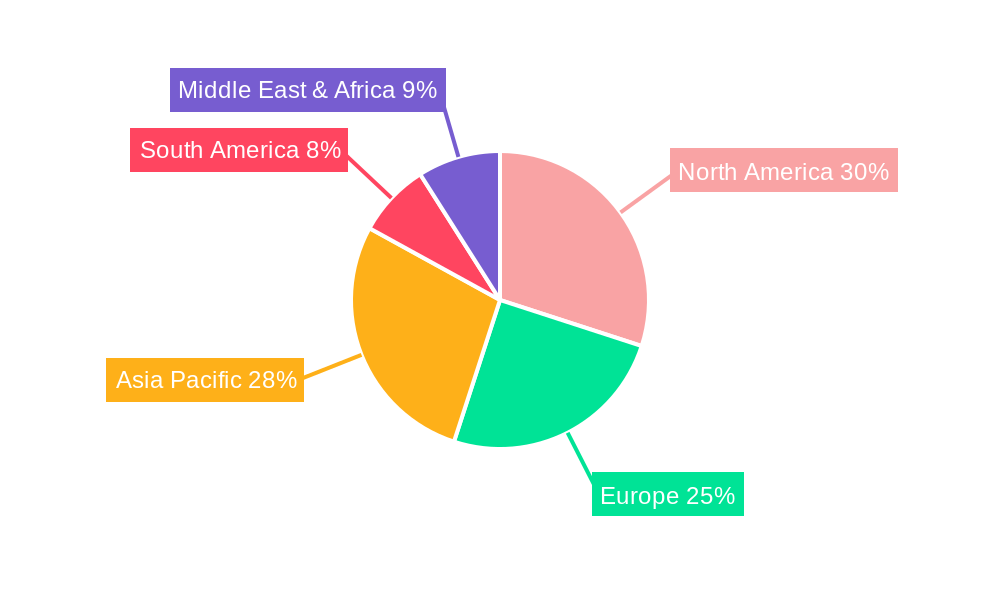
The Physical Property Prediction Software market is dominated by a few key regions and segments, driven by strong R&D investments and established industrial bases. North America and Europe currently hold the largest market shares due to the significant presence of major pharmaceutical and chemical companies, coupled with robust government funding for scientific research.
Dominant Application Segment: The Pharmacy segment stands out as the largest and fastest-growing application. This is primarily attributed to the high stakes involved in drug discovery and development, where accurate prediction of ADMET (Absorption, Distribution, Metabolism, Excretion, Toxicity) properties, solubility, and stability is paramount. The increasing pipeline of new drug candidates and the need to reduce the attrition rate in clinical trials fuel the demand for advanced physicochemical property prediction software. Companies like Simulations Plus and Advanced Chemistry Development, Inc. are key contributors to this segment.
Dominant Type: Cloud Based solutions are increasingly dominating the market. This trend is propelled by the flexibility, scalability, and cost-effectiveness offered by cloud platforms. It allows researchers to access powerful computational chemistry tools and vast databases without significant upfront hardware investments. This is particularly beneficial for smaller enterprises and academic institutions. NVIDIA's advancements in GPU computing for accelerated simulations are also indirectly supporting the growth of cloud-based offerings by enabling faster and more complex calculations.
Key Drivers in the Pharmacy Segment:
- Accelerated Drug Discovery: The need to rapidly identify and optimize drug candidates.
- Reduced R&D Costs: Minimizing experimental testing through accurate in silico predictions.
- Regulatory Compliance: Software aiding in meeting stringent regulatory requirements for drug safety and efficacy.
- Personalized Medicine: Enabling the prediction of drug responses based on individual genetic profiles.
Key Drivers for Cloud-Based Solutions:
- Cost-Effectiveness: Reduced capital expenditure on hardware and IT infrastructure.
- Scalability and Flexibility: Ability to scale computing resources up or down based on project needs.
- Accessibility: Anytime, anywhere access to powerful software and data.
- Collaboration: Facilitating seamless data sharing and collaboration among research teams.
The Chemical application segment also represents a substantial market, driven by the need for optimizing reaction pathways, predicting material properties for new product development, and ensuring process safety. The Physical Thermodynamics segment is crucial for understanding and modeling complex systems, including phase equilibria, heat transfer, and chemical reactions. While On-Premise solutions still hold a significant share, especially for organizations with existing IT infrastructure and strict data security protocols, the trend clearly favors cloud adoption for its agility. Companies like Chemaxon Ltd. and Kintech Lab are actively developing solutions catering to these diverse needs, contributing to the overall market expansion.
Physical Property Prediction Software Product Innovations
Recent product innovations in Physical Property Prediction Software are centered on integrating advanced machine learning algorithms with sophisticated cheminformatics and computational chemistry engines. Companies are focusing on developing predictive models with enhanced accuracy for a wider range of chemical properties, including complex thermodynamic parameters and material characteristics. The applications extend to accelerating drug discovery by predicting ADMET properties and optimizing formulation development. Competitive advantages are being gained through user-friendly interfaces that streamline in silico workflows, faster simulation speeds enabled by GPU computing (e.g., NVIDIA's contributions), and the expansion of comprehensive, validated property databases. The development of tools for predicting green chemistry metrics and sustainability profiles is also gaining traction, aligning with industry-wide environmental goals.
Report Segmentation & Scope
This report meticulously segments the Physical Property Prediction Software market across key parameters to provide granular insights.
Application Segments:
- Chemical: This segment focuses on software utilized for predicting properties relevant to chemical synthesis, process optimization, and material science. Growth projections for this segment are robust, with market sizes expected to reach several million dollars by 2033. Competitive dynamics are driven by the need for accurate reaction modeling and material characterization.
- Pharmacy: Encompassing the prediction of drug properties such as solubility, permeability, stability, and toxicity. This segment is anticipated to exhibit the highest growth rate, with significant market expansion driven by accelerated drug discovery and development.
- Physical Thermodynamics: Dedicated to predicting thermodynamic properties, phase equilibria, and reaction kinetics, crucial for process engineering and fundamental research.
- Other: Including applications in areas like environmental science, food and beverage, and academia.
Type Segments:
- Cloud Based: Characterized by its high scalability, accessibility, and cost-effectiveness. Growth projections indicate a strong upward trend, with this segment poised to capture a larger market share.
- On-Premise: Catering to organizations requiring complete control over their data and infrastructure. Market size remains substantial, though growth is projected to be slower than cloud-based solutions.
Key Drivers of Physical Property Prediction Software Growth
The growth of the Physical Property Prediction Software market is propelled by a confluence of technological, economic, and regulatory factors.
- Technological Advancements: The rapid evolution of machine learning, artificial intelligence, and high-performance computing (HPC) has dramatically improved the accuracy and speed of predictive modeling for chemical and physical properties. The integration of these technologies within software platforms enables more sophisticated in silico analysis and molecular simulations.
- Economic Pressures: The escalating costs associated with experimental R&D in the chemical and pharmaceutical industries are compelling organizations to adopt more efficient computational chemistry tools. Physical property prediction software offers a cost-effective alternative, reducing the need for extensive laboratory work and accelerating product development cycles, thereby enhancing return on investment (ROI).
- Regulatory Landscape: Increasingly stringent regulations, particularly in the pharmacy sector, demand robust data and validation for new drug candidates. Software that accurately predicts drug properties and safety profiles aids companies in meeting these regulatory requirements more efficiently. For instance, the FDA's focus on in silico data for early-stage drug assessment is a significant driver.
- Increasing Data Complexity: The exponential growth in chemical and biological data necessitates advanced tools for analysis and interpretation. Physical property prediction software provides the capabilities to manage and derive insights from these vast datasets.
Challenges in the Physical Property Prediction Software Sector
Despite its promising growth, the Physical Property Prediction Software sector faces several challenges.
- Accuracy and Validation: While advancements are significant, achieving perfect accuracy for all chemical properties and across all compound classes remains a challenge. Robust validation of predictive models against experimental data is crucial but can be time-consuming and resource-intensive. This is especially true for novel or complex molecular structures.
- Integration Complexity: Integrating diverse cheminformatics and computational chemistry tools into seamless workflows can be complex. Users often require specialized expertise to operate and interpret results from sophisticated software, leading to a demand for more user-friendly interfaces and comprehensive training.
- Data Scarcity for Niche Properties: For less common or highly specialized physical properties, limited experimental data may be available, hindering the development and validation of accurate predictive models. This can impact market penetration in specific niche applications.
- Intellectual Property Concerns: For cloud-based solutions, concerns regarding data security and the protection of proprietary R&D information can be a barrier for some organizations, particularly in highly competitive industries like pharmaceuticals. The cost of implementing and maintaining on-premise solutions can also be a deterrent for smaller companies.
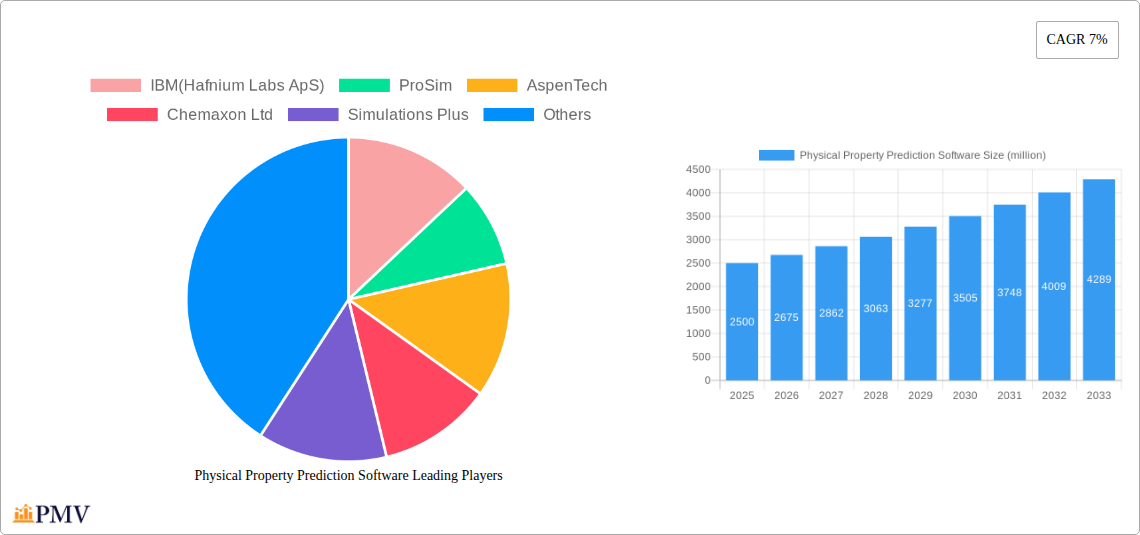
Leading Players in the Physical Property Prediction Software Market
- IBM
- ProSim
- AspenTech
- Chemaxon Ltd
- Simulations Plus
- NVIDIA
- ChemSpider
- Cranium
- Advanced Chemistry Development, Inc.
- Kintech Lab
Key Developments in Physical Property Prediction Software Sector
- 2023: AspenTech launched enhanced AI capabilities for its simulation software, significantly improving physical property prediction accuracy and speed in chemical process modeling.
- 2023: NVIDIA introduced new GPU architectures optimized for scientific computing, enabling researchers to perform more complex molecular simulations and AI-driven predictions in a fraction of the time.
- 2023: Simulations Plus released a new version of its ADMET prediction software, incorporating advanced machine learning models for more accurate drug property forecasting in the pharmacy sector.
- 2024: Chemaxon Ltd. expanded its cheminformatics platform with new modules for predicting thermodynamic properties and reaction outcomes, catering to a broader range of applications.
- 2024: IBM (Hafnium Labs ApS) announced advancements in its quantum computing research, with potential future implications for highly accurate quantum chemical property prediction.
Strategic Physical Property Prediction Software Market Outlook
The future outlook for the Physical Property Prediction Software market is exceptionally strong, driven by the ongoing digital transformation in R&D and the relentless pursuit of innovation across industries. Growth accelerators include the continued integration of AI and machine learning for enhanced predictive accuracy, the increasing adoption of cloud-based solutions for greater accessibility and scalability, and the expanding application scope into emerging fields like sustainable chemistry and advanced materials. Strategic opportunities lie in developing highly specialized predictive models for niche applications, enhancing user interfaces for broader adoption, and fostering collaborations between software providers and research institutions. The market is expected to witness further consolidation and specialized offerings as companies strive to capture market share by delivering cutting-edge in silico solutions that streamline research, reduce costs, and accelerate the discovery of novel compounds and materials. The market's trajectory is indicative of its critical role in modern scientific advancement.
Physical Property Prediction Software Segmentation
-
1. Application
- 1.1. Chemical
- 1.2. Pharmacy
- 1.3. Physical Thermodynamics
- 1.4. Other
-
2. Types
- 2.1. Cloud Based
- 2.2. On-Premise
Physical Property Prediction Software Segmentation By Geography
-
1. North America
- 1.1. United States
- 1.2. Canada
- 1.3. Mexico
-
2. South America
- 2.1. Brazil
- 2.2. Argentina
- 2.3. Rest of South America
-
3. Europe
- 3.1. United Kingdom
- 3.2. Germany
- 3.3. France
- 3.4. Italy
- 3.5. Spain
- 3.6. Russia
- 3.7. Benelux
- 3.8. Nordics
- 3.9. Rest of Europe
-
4. Middle East & Africa
- 4.1. Turkey
- 4.2. Israel
- 4.3. GCC
- 4.4. North Africa
- 4.5. South Africa
- 4.6. Rest of Middle East & Africa
-
5. Asia Pacific
- 5.1. China
- 5.2. India
- 5.3. Japan
- 5.4. South Korea
- 5.5. ASEAN
- 5.6. Oceania
- 5.7. Rest of Asia Pacific
Physical Property Prediction Software REPORT HIGHLIGHTS
| Aspects | Details |
|---|---|
| Study Period | 2019-2033 |
| Base Year | 2024 |
| Estimated Year | 2025 |
| Forecast Period | 2025-2033 |
| Historical Period | 2019-2024 |
| Growth Rate | CAGR of 7% from 2019-2033 |
| Segmentation |
|
Table of Contents
- 1. Introduction
- 1.1. Research Scope
- 1.2. Market Segmentation
- 1.3. Research Methodology
- 1.4. Definitions and Assumptions
- 2. Executive Summary
- 2.1. Introduction
- 3. Market Dynamics
- 3.1. Introduction
- 3.2. Market Drivers
- 3.3. Market Restrains
- 3.4. Market Trends
- 4. Market Factor Analysis
- 4.1. Porters Five Forces
- 4.2. Supply/Value Chain
- 4.3. PESTEL analysis
- 4.4. Market Entropy
- 4.5. Patent/Trademark Analysis
- 5. Global Physical Property Prediction Software Analysis, Insights and Forecast, 2019-2031
- 5.1. Market Analysis, Insights and Forecast - by Application
- 5.1.1. Chemical
- 5.1.2. Pharmacy
- 5.1.3. Physical Thermodynamics
- 5.1.4. Other
- 5.2. Market Analysis, Insights and Forecast - by Types
- 5.2.1. Cloud Based
- 5.2.2. On-Premise
- 5.3. Market Analysis, Insights and Forecast - by Region
- 5.3.1. North America
- 5.3.2. South America
- 5.3.3. Europe
- 5.3.4. Middle East & Africa
- 5.3.5. Asia Pacific
- 5.1. Market Analysis, Insights and Forecast - by Application
- 6. North America Physical Property Prediction Software Analysis, Insights and Forecast, 2019-2031
- 6.1. Market Analysis, Insights and Forecast - by Application
- 6.1.1. Chemical
- 6.1.2. Pharmacy
- 6.1.3. Physical Thermodynamics
- 6.1.4. Other
- 6.2. Market Analysis, Insights and Forecast - by Types
- 6.2.1. Cloud Based
- 6.2.2. On-Premise
- 6.1. Market Analysis, Insights and Forecast - by Application
- 7. South America Physical Property Prediction Software Analysis, Insights and Forecast, 2019-2031
- 7.1. Market Analysis, Insights and Forecast - by Application
- 7.1.1. Chemical
- 7.1.2. Pharmacy
- 7.1.3. Physical Thermodynamics
- 7.1.4. Other
- 7.2. Market Analysis, Insights and Forecast - by Types
- 7.2.1. Cloud Based
- 7.2.2. On-Premise
- 7.1. Market Analysis, Insights and Forecast - by Application
- 8. Europe Physical Property Prediction Software Analysis, Insights and Forecast, 2019-2031
- 8.1. Market Analysis, Insights and Forecast - by Application
- 8.1.1. Chemical
- 8.1.2. Pharmacy
- 8.1.3. Physical Thermodynamics
- 8.1.4. Other
- 8.2. Market Analysis, Insights and Forecast - by Types
- 8.2.1. Cloud Based
- 8.2.2. On-Premise
- 8.1. Market Analysis, Insights and Forecast - by Application
- 9. Middle East & Africa Physical Property Prediction Software Analysis, Insights and Forecast, 2019-2031
- 9.1. Market Analysis, Insights and Forecast - by Application
- 9.1.1. Chemical
- 9.1.2. Pharmacy
- 9.1.3. Physical Thermodynamics
- 9.1.4. Other
- 9.2. Market Analysis, Insights and Forecast - by Types
- 9.2.1. Cloud Based
- 9.2.2. On-Premise
- 9.1. Market Analysis, Insights and Forecast - by Application
- 10. Asia Pacific Physical Property Prediction Software Analysis, Insights and Forecast, 2019-2031
- 10.1. Market Analysis, Insights and Forecast - by Application
- 10.1.1. Chemical
- 10.1.2. Pharmacy
- 10.1.3. Physical Thermodynamics
- 10.1.4. Other
- 10.2. Market Analysis, Insights and Forecast - by Types
- 10.2.1. Cloud Based
- 10.2.2. On-Premise
- 10.1. Market Analysis, Insights and Forecast - by Application
- 11. Competitive Analysis
- 11.1. Global Market Share Analysis 2024
- 11.2. Company Profiles
- 11.2.1 IBM(Hafnium Labs ApS)
- 11.2.1.1. Overview
- 11.2.1.2. Products
- 11.2.1.3. SWOT Analysis
- 11.2.1.4. Recent Developments
- 11.2.1.5. Financials (Based on Availability)
- 11.2.2 ProSim
- 11.2.2.1. Overview
- 11.2.2.2. Products
- 11.2.2.3. SWOT Analysis
- 11.2.2.4. Recent Developments
- 11.2.2.5. Financials (Based on Availability)
- 11.2.3 AspenTech
- 11.2.3.1. Overview
- 11.2.3.2. Products
- 11.2.3.3. SWOT Analysis
- 11.2.3.4. Recent Developments
- 11.2.3.5. Financials (Based on Availability)
- 11.2.4 Chemaxon Ltd
- 11.2.4.1. Overview
- 11.2.4.2. Products
- 11.2.4.3. SWOT Analysis
- 11.2.4.4. Recent Developments
- 11.2.4.5. Financials (Based on Availability)
- 11.2.5 Simulations Plus
- 11.2.5.1. Overview
- 11.2.5.2. Products
- 11.2.5.3. SWOT Analysis
- 11.2.5.4. Recent Developments
- 11.2.5.5. Financials (Based on Availability)
- 11.2.6 NVIDIA
- 11.2.6.1. Overview
- 11.2.6.2. Products
- 11.2.6.3. SWOT Analysis
- 11.2.6.4. Recent Developments
- 11.2.6.5. Financials (Based on Availability)
- 11.2.7 ChemSpider
- 11.2.7.1. Overview
- 11.2.7.2. Products
- 11.2.7.3. SWOT Analysis
- 11.2.7.4. Recent Developments
- 11.2.7.5. Financials (Based on Availability)
- 11.2.8 Cranium
- 11.2.8.1. Overview
- 11.2.8.2. Products
- 11.2.8.3. SWOT Analysis
- 11.2.8.4. Recent Developments
- 11.2.8.5. Financials (Based on Availability)
- 11.2.9 Advanced Chemistry Development
- 11.2.9.1. Overview
- 11.2.9.2. Products
- 11.2.9.3. SWOT Analysis
- 11.2.9.4. Recent Developments
- 11.2.9.5. Financials (Based on Availability)
- 11.2.10 Inc.
- 11.2.10.1. Overview
- 11.2.10.2. Products
- 11.2.10.3. SWOT Analysis
- 11.2.10.4. Recent Developments
- 11.2.10.5. Financials (Based on Availability)
- 11.2.11 Kintech Lab
- 11.2.11.1. Overview
- 11.2.11.2. Products
- 11.2.11.3. SWOT Analysis
- 11.2.11.4. Recent Developments
- 11.2.11.5. Financials (Based on Availability)
- 11.2.1 IBM(Hafnium Labs ApS)
List of Figures
- Figure 1: Global Physical Property Prediction Software Revenue Breakdown (million, %) by Region 2024 & 2032
- Figure 2: North America Physical Property Prediction Software Revenue (million), by Application 2024 & 2032
- Figure 3: North America Physical Property Prediction Software Revenue Share (%), by Application 2024 & 2032
- Figure 4: North America Physical Property Prediction Software Revenue (million), by Types 2024 & 2032
- Figure 5: North America Physical Property Prediction Software Revenue Share (%), by Types 2024 & 2032
- Figure 6: North America Physical Property Prediction Software Revenue (million), by Country 2024 & 2032
- Figure 7: North America Physical Property Prediction Software Revenue Share (%), by Country 2024 & 2032
- Figure 8: South America Physical Property Prediction Software Revenue (million), by Application 2024 & 2032
- Figure 9: South America Physical Property Prediction Software Revenue Share (%), by Application 2024 & 2032
- Figure 10: South America Physical Property Prediction Software Revenue (million), by Types 2024 & 2032
- Figure 11: South America Physical Property Prediction Software Revenue Share (%), by Types 2024 & 2032
- Figure 12: South America Physical Property Prediction Software Revenue (million), by Country 2024 & 2032
- Figure 13: South America Physical Property Prediction Software Revenue Share (%), by Country 2024 & 2032
- Figure 14: Europe Physical Property Prediction Software Revenue (million), by Application 2024 & 2032
- Figure 15: Europe Physical Property Prediction Software Revenue Share (%), by Application 2024 & 2032
- Figure 16: Europe Physical Property Prediction Software Revenue (million), by Types 2024 & 2032
- Figure 17: Europe Physical Property Prediction Software Revenue Share (%), by Types 2024 & 2032
- Figure 18: Europe Physical Property Prediction Software Revenue (million), by Country 2024 & 2032
- Figure 19: Europe Physical Property Prediction Software Revenue Share (%), by Country 2024 & 2032
- Figure 20: Middle East & Africa Physical Property Prediction Software Revenue (million), by Application 2024 & 2032
- Figure 21: Middle East & Africa Physical Property Prediction Software Revenue Share (%), by Application 2024 & 2032
- Figure 22: Middle East & Africa Physical Property Prediction Software Revenue (million), by Types 2024 & 2032
- Figure 23: Middle East & Africa Physical Property Prediction Software Revenue Share (%), by Types 2024 & 2032
- Figure 24: Middle East & Africa Physical Property Prediction Software Revenue (million), by Country 2024 & 2032
- Figure 25: Middle East & Africa Physical Property Prediction Software Revenue Share (%), by Country 2024 & 2032
- Figure 26: Asia Pacific Physical Property Prediction Software Revenue (million), by Application 2024 & 2032
- Figure 27: Asia Pacific Physical Property Prediction Software Revenue Share (%), by Application 2024 & 2032
- Figure 28: Asia Pacific Physical Property Prediction Software Revenue (million), by Types 2024 & 2032
- Figure 29: Asia Pacific Physical Property Prediction Software Revenue Share (%), by Types 2024 & 2032
- Figure 30: Asia Pacific Physical Property Prediction Software Revenue (million), by Country 2024 & 2032
- Figure 31: Asia Pacific Physical Property Prediction Software Revenue Share (%), by Country 2024 & 2032
List of Tables
- Table 1: Global Physical Property Prediction Software Revenue million Forecast, by Region 2019 & 2032
- Table 2: Global Physical Property Prediction Software Revenue million Forecast, by Application 2019 & 2032
- Table 3: Global Physical Property Prediction Software Revenue million Forecast, by Types 2019 & 2032
- Table 4: Global Physical Property Prediction Software Revenue million Forecast, by Region 2019 & 2032
- Table 5: Global Physical Property Prediction Software Revenue million Forecast, by Application 2019 & 2032
- Table 6: Global Physical Property Prediction Software Revenue million Forecast, by Types 2019 & 2032
- Table 7: Global Physical Property Prediction Software Revenue million Forecast, by Country 2019 & 2032
- Table 8: United States Physical Property Prediction Software Revenue (million) Forecast, by Application 2019 & 2032
- Table 9: Canada Physical Property Prediction Software Revenue (million) Forecast, by Application 2019 & 2032
- Table 10: Mexico Physical Property Prediction Software Revenue (million) Forecast, by Application 2019 & 2032
- Table 11: Global Physical Property Prediction Software Revenue million Forecast, by Application 2019 & 2032
- Table 12: Global Physical Property Prediction Software Revenue million Forecast, by Types 2019 & 2032
- Table 13: Global Physical Property Prediction Software Revenue million Forecast, by Country 2019 & 2032
- Table 14: Brazil Physical Property Prediction Software Revenue (million) Forecast, by Application 2019 & 2032
- Table 15: Argentina Physical Property Prediction Software Revenue (million) Forecast, by Application 2019 & 2032
- Table 16: Rest of South America Physical Property Prediction Software Revenue (million) Forecast, by Application 2019 & 2032
- Table 17: Global Physical Property Prediction Software Revenue million Forecast, by Application 2019 & 2032
- Table 18: Global Physical Property Prediction Software Revenue million Forecast, by Types 2019 & 2032
- Table 19: Global Physical Property Prediction Software Revenue million Forecast, by Country 2019 & 2032
- Table 20: United Kingdom Physical Property Prediction Software Revenue (million) Forecast, by Application 2019 & 2032
- Table 21: Germany Physical Property Prediction Software Revenue (million) Forecast, by Application 2019 & 2032
- Table 22: France Physical Property Prediction Software Revenue (million) Forecast, by Application 2019 & 2032
- Table 23: Italy Physical Property Prediction Software Revenue (million) Forecast, by Application 2019 & 2032
- Table 24: Spain Physical Property Prediction Software Revenue (million) Forecast, by Application 2019 & 2032
- Table 25: Russia Physical Property Prediction Software Revenue (million) Forecast, by Application 2019 & 2032
- Table 26: Benelux Physical Property Prediction Software Revenue (million) Forecast, by Application 2019 & 2032
- Table 27: Nordics Physical Property Prediction Software Revenue (million) Forecast, by Application 2019 & 2032
- Table 28: Rest of Europe Physical Property Prediction Software Revenue (million) Forecast, by Application 2019 & 2032
- Table 29: Global Physical Property Prediction Software Revenue million Forecast, by Application 2019 & 2032
- Table 30: Global Physical Property Prediction Software Revenue million Forecast, by Types 2019 & 2032
- Table 31: Global Physical Property Prediction Software Revenue million Forecast, by Country 2019 & 2032
- Table 32: Turkey Physical Property Prediction Software Revenue (million) Forecast, by Application 2019 & 2032
- Table 33: Israel Physical Property Prediction Software Revenue (million) Forecast, by Application 2019 & 2032
- Table 34: GCC Physical Property Prediction Software Revenue (million) Forecast, by Application 2019 & 2032
- Table 35: North Africa Physical Property Prediction Software Revenue (million) Forecast, by Application 2019 & 2032
- Table 36: South Africa Physical Property Prediction Software Revenue (million) Forecast, by Application 2019 & 2032
- Table 37: Rest of Middle East & Africa Physical Property Prediction Software Revenue (million) Forecast, by Application 2019 & 2032
- Table 38: Global Physical Property Prediction Software Revenue million Forecast, by Application 2019 & 2032
- Table 39: Global Physical Property Prediction Software Revenue million Forecast, by Types 2019 & 2032
- Table 40: Global Physical Property Prediction Software Revenue million Forecast, by Country 2019 & 2032
- Table 41: China Physical Property Prediction Software Revenue (million) Forecast, by Application 2019 & 2032
- Table 42: India Physical Property Prediction Software Revenue (million) Forecast, by Application 2019 & 2032
- Table 43: Japan Physical Property Prediction Software Revenue (million) Forecast, by Application 2019 & 2032
- Table 44: South Korea Physical Property Prediction Software Revenue (million) Forecast, by Application 2019 & 2032
- Table 45: ASEAN Physical Property Prediction Software Revenue (million) Forecast, by Application 2019 & 2032
- Table 46: Oceania Physical Property Prediction Software Revenue (million) Forecast, by Application 2019 & 2032
- Table 47: Rest of Asia Pacific Physical Property Prediction Software Revenue (million) Forecast, by Application 2019 & 2032
Frequently Asked Questions
1. What is the projected Compound Annual Growth Rate (CAGR) of the Physical Property Prediction Software?
The projected CAGR is approximately 7%.
2. Which companies are prominent players in the Physical Property Prediction Software?
Key companies in the market include IBM(Hafnium Labs ApS), ProSim, AspenTech, Chemaxon Ltd, Simulations Plus, NVIDIA, ChemSpider, Cranium, Advanced Chemistry Development, Inc., Kintech Lab.
3. What are the main segments of the Physical Property Prediction Software?
The market segments include Application, Types.
4. Can you provide details about the market size?
The market size is estimated to be USD 2500 million as of 2022.
5. What are some drivers contributing to market growth?
N/A
6. What are the notable trends driving market growth?
N/A
7. Are there any restraints impacting market growth?
N/A
8. Can you provide examples of recent developments in the market?
N/A
9. What pricing options are available for accessing the report?
Pricing options include single-user, multi-user, and enterprise licenses priced at USD 4900.00, USD 7350.00, and USD 9800.00 respectively.
10. Is the market size provided in terms of value or volume?
The market size is provided in terms of value, measured in million.
11. Are there any specific market keywords associated with the report?
Yes, the market keyword associated with the report is "Physical Property Prediction Software," which aids in identifying and referencing the specific market segment covered.
12. How do I determine which pricing option suits my needs best?
The pricing options vary based on user requirements and access needs. Individual users may opt for single-user licenses, while businesses requiring broader access may choose multi-user or enterprise licenses for cost-effective access to the report.
13. Are there any additional resources or data provided in the Physical Property Prediction Software report?
While the report offers comprehensive insights, it's advisable to review the specific contents or supplementary materials provided to ascertain if additional resources or data are available.
14. How can I stay updated on further developments or reports in the Physical Property Prediction Software?
To stay informed about further developments, trends, and reports in the Physical Property Prediction Software, consider subscribing to industry newsletters, following relevant companies and organizations, or regularly checking reputable industry news sources and publications.
Methodology
Step 1 - Identification of Relevant Samples Size from Population Database


Step 2 - Approaches for Defining Global Market Size (Value, Volume* & Price*)

Note*: In applicable scenarios
Step 3 - Data Sources
Primary Research
- Web Analytics
- Survey Reports
- Research Institute
- Latest Research Reports
- Opinion Leaders
Secondary Research
- Annual Reports
- White Paper
- Latest Press Release
- Industry Association
- Paid Database
- Investor Presentations

Step 4 - Data Triangulation
Involves using different sources of information in order to increase the validity of a study
These sources are likely to be stakeholders in a program - participants, other researchers, program staff, other community members, and so on.
Then we put all data in single framework & apply various statistical tools to find out the dynamic on the market.
During the analysis stage, feedback from the stakeholder groups would be compared to determine areas of agreement as well as areas of divergence


