
Key Insights
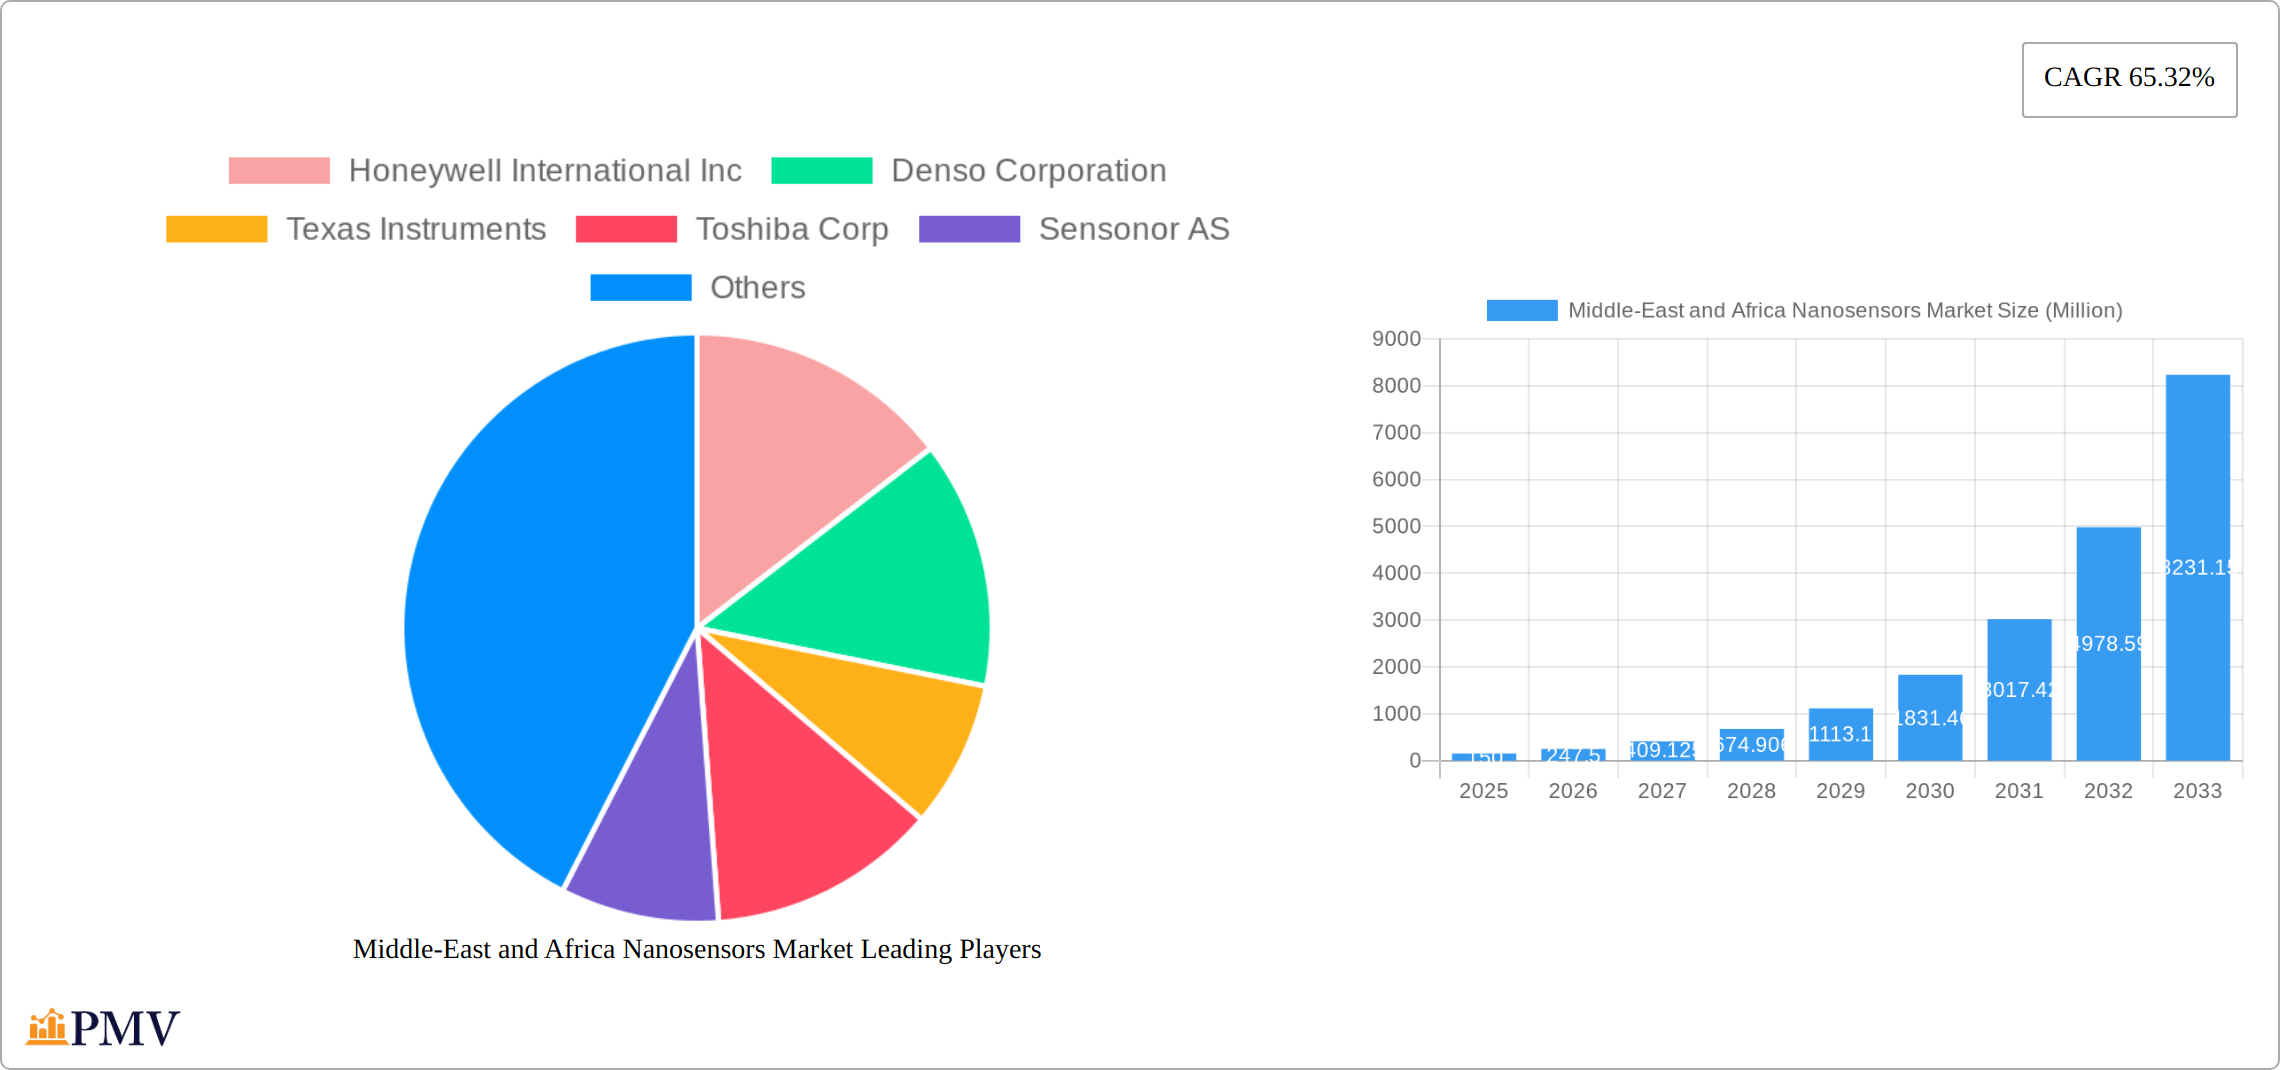
The Middle East and Africa (MEA) nanosensors market is experiencing robust growth, fueled by a 65.32% Compound Annual Growth Rate (CAGR). This surge is driven by increasing investments in healthcare infrastructure, particularly in countries like Saudi Arabia, the UAE, and South Africa, along with the burgeoning consumer electronics and automotive sectors across the region. The demand for advanced sensing technologies in applications ranging from medical diagnostics (biosensors) to environmental monitoring (chemical sensors) and industrial process control (force sensors) is significantly contributing to this expansion. Furthermore, government initiatives promoting technological advancements and diversification of economies in the MEA region are creating a favorable environment for nanosensors adoption. The strong growth is also supported by the increasing adoption of smart devices and the IoT (Internet of Things) in both consumer and industrial applications.
However, challenges remain. High initial investment costs associated with nanosensor technology and the need for specialized expertise can hinder market penetration, especially in smaller economies within the region. Furthermore, regulatory hurdles related to the use and adoption of emerging technologies can act as a restraint. Despite these challenges, the long-term outlook for the MEA nanosensors market remains positive, driven by continuous technological innovation, decreasing production costs, and an increasing awareness of the potential benefits of nanosensors across various sectors. The market segmentation reveals a significant presence of force sensors, biosensors, and chemical sensors across diverse industries, with the healthcare, automotive, and consumer electronics sectors leading the way. The projected growth indicates substantial investment opportunities for companies operating in this dynamic market.
Middle-East and Africa Nanosensors Market: A Comprehensive Report (2019-2033)
This detailed report provides a comprehensive analysis of the Middle East and Africa Nanosensors Market, offering invaluable insights for industry stakeholders, investors, and strategic decision-makers. The study period spans from 2019 to 2033, with 2025 serving as the base and estimated year. The report meticulously examines market dynamics, competitive landscapes, technological advancements, and growth projections, providing a clear roadmap for navigating this rapidly evolving sector. The market is segmented by type (Force Sensor, Biosensors, Radiation Sensors, Chemical Sensors, Thermal Sensors), industry (Consumer Electronics, Power Generation, Automotive, Petrochemical, Aerospace & Defense, Healthcare, Industrial, Other Industries), and country (Saudi Arabia, United Arab Emirates, Israel, South Africa, Other Countries). The projected market value is xx Million by 2033.
Middle-East and Africa Nanosensors Market Market Structure & Competitive Dynamics
The Middle East and Africa nanosensors market exhibits a moderately concentrated structure, with several key players holding significant market share. The competitive landscape is characterized by intense innovation, driving the development of advanced nanosensors with enhanced sensitivity, selectivity, and miniaturization. Regulatory frameworks, while evolving, are increasingly focused on ensuring safety and efficacy, impacting market entry and product development. Product substitutes, such as traditional sensors, pose a competitive challenge, but the superior performance and functionalities of nanosensors are driving adoption. End-user trends reveal a growing preference for sophisticated and integrated solutions, shaping product development strategies. M&A activities, while not overly frequent, are strategically employed by major players to expand their product portfolios and market reach. Deal values vary significantly, ranging from xx Million to xx Million, depending on the scale and strategic objectives of the acquisitions.
- Market Concentration: Moderately concentrated, with top 5 players holding approximately xx% market share in 2025.
- Innovation Ecosystems: Strong presence of research institutions and startups fostering innovation.
- Regulatory Frameworks: Evolving, with increasing focus on safety and standardization.
- M&A Activity: Strategic acquisitions driving market consolidation, with deal values ranging from xx Million to xx Million.
Middle-East and Africa Nanosensors Market Industry Trends & Insights
The Middle East and Africa nanosensors market is experiencing robust growth, driven by increasing demand across diverse sectors such as healthcare, environmental monitoring, automotive, and industrial applications. This dynamic market is projected to achieve a significant compound annual growth rate (CAGR) of [Insert Updated CAGR Percentage]% during the forecast period (2025-2033). This expansion is fueled by several key factors: rapid technological advancements resulting in enhanced sensor performance, miniaturization, and reduced costs; a rising consumer preference for smaller, more efficient, and versatile devices perfectly suited to nanosensor capabilities; and intense competitive innovation, with companies continuously striving to improve sensor sensitivity, selectivity, and integration with larger systems. Market penetration is currently at [Insert Updated Percentage]% in key segments, with considerable untapped potential for future growth, especially within emerging sectors. Government initiatives promoting technological advancements and investments in research and development further contribute to this positive market trajectory.
Dominant Markets & Segments in Middle-East and Africa Nanosensors Market
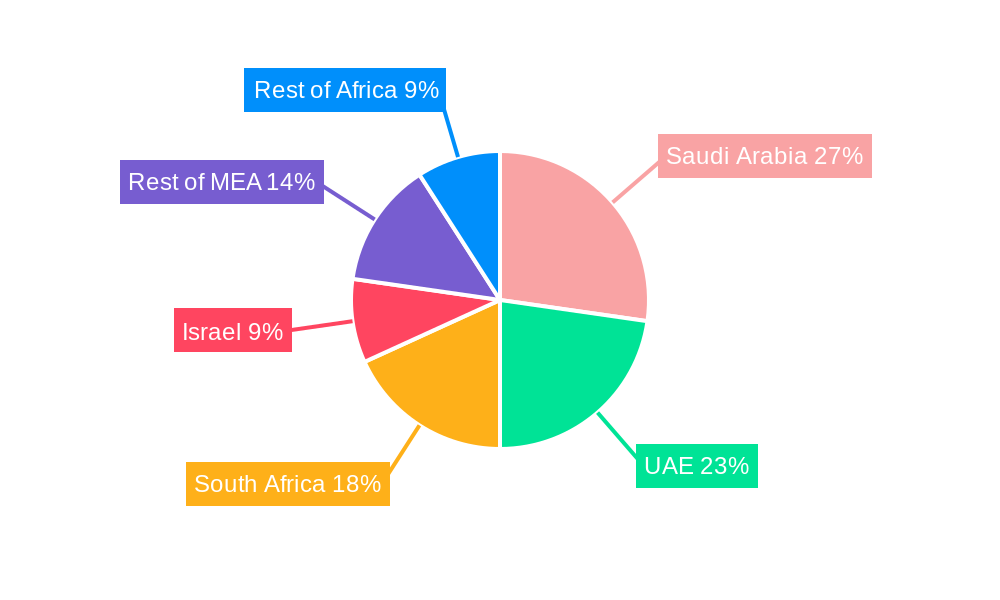
The Automotive and Healthcare sectors are currently the dominant industries for nanosensors in the Middle East and Africa region. Saudi Arabia and the United Arab Emirates lead in terms of market size and adoption rate, driven by robust economic growth, favorable government policies, and significant investments in infrastructure development. Among sensor types, Chemical Sensors and Biosensors are currently experiencing the highest growth rates due to their diverse applications in environmental monitoring, healthcare diagnostics, and food safety.
- Key Drivers in Saudi Arabia and UAE:
- Strong economic growth and government investments in advanced technologies.
- Increasing focus on healthcare infrastructure and environmental monitoring.
- Favorable regulatory environment promoting technological adoption.
- Dominant Segments:
- Industry: Automotive and Healthcare.
- Sensor Type: Chemical and Biosensors.
- Country Dominance: Saudi Arabia and UAE.
Middle-East and Africa Nanosensors Market Product Innovations
Recent product innovations are significantly impacting the market, focusing on enhancing the sensitivity, selectivity, and integration capabilities of nanosensors. The adoption of advanced materials and cutting-edge fabrication techniques is driving the development of smaller, more energy-efficient sensors with superior performance characteristics. These advancements are enabling the creation of groundbreaking applications across various sectors, including precise disease diagnostics, real-time environmental monitoring, and sophisticated industrial process control. A notable trend is the increasing integration of nanosensors into larger systems, leading to the development of more complex and efficient solutions that address diverse industry needs. Furthermore, the focus on miniaturization allows for the development of wearable and implantable sensors, opening up new possibilities in healthcare and personal monitoring.
Report Segmentation & Scope
This report segments the Middle East and Africa nanosensors market by:
Type: Force Sensors, Biosensors, Radiation Sensors, Chemical Sensors, Thermal Sensors. The growth trajectory of each segment is influenced by technological advancements and specific application demands. Market size projections vary considerably across these types, with Biosensors and Chemical sensors anticipated to exhibit the highest growth rates due to their widespread applications in healthcare and environmental monitoring, respectively. Further segmentation within these categories, such as electrochemical vs. optical biosensors, could offer even more granular insights.
Industry: Consumer Electronics, Power Generation, Automotive, Petrochemical, Aerospace & Defense, Healthcare, Industrial, Other Industries. The automotive and healthcare sectors are poised for the most significant growth, driven by increasing demand for advanced safety systems, diagnostic tools, and personalized medicine. The growing awareness of environmental issues is also driving demand for sensors in environmental monitoring applications.
Country: Saudi Arabia, United Arab Emirates, Israel, South Africa, Other Countries. While Saudi Arabia and the UAE currently represent the largest markets, significant growth opportunities exist in other countries across the region, particularly as infrastructure development and technological adoption accelerates.
Key Drivers of Middle-East and Africa Nanosensors Market Growth
Several factors are driving the growth of the Middle East and Africa nanosensors market. Technological advancements leading to improved sensor performance and miniaturization are key. Economic growth in several countries in the region is boosting investments in advanced technologies, while government initiatives promoting technological innovation are creating favorable market conditions.
Challenges in the Middle-East and Africa Nanosensors Market Sector
The market faces challenges including the high cost of nanosensor manufacturing, potential supply chain disruptions, and a scarcity of skilled labor. Regulatory uncertainties in some countries also create hurdles for market expansion. Competition from established sensor technologies also poses a challenge.
Leading Players in the Middle-East and Africa Nanosensors Market Market
- Honeywell International Inc
- Denso Corporation
- Texas Instruments
- Toshiba Corp
- Sensonor AS
- STMicroelectronics
- Robert Bosch GmbH
- Silicon Designs Inc
- Flir Systems Inc
- Analog Devices Inc
- GE Sensing
- Omron Corp
- Agilent Technologies
Key Developments in Middle-East and Africa Nanosensors Market Sector
- May 2021: MS-Tech's successful shipment and installation of EXPLOSCAN and DUOSCAN detectors across Europe, Africa, and the Middle East significantly boosted the market for security and safety nanosensors, highlighting the growing demand for enhanced safety and security measures.
- April 2021: Panasonic Corporation's announcement of a new manufacturable technology improving thermal sensor performance is poised to drive innovation in advanced thermal management solutions across various sectors.
- [Add other key developments with dates and brief descriptions. Focus on collaborations, partnerships, new product launches, regulatory approvals, and significant investments in the MEA nanosensor market.]
Strategic Middle-East and Africa Nanosensors Market Market Outlook
The Middle East and Africa nanosensors market holds significant future potential. Continued technological advancements, coupled with increasing investments in infrastructure and healthcare, will drive market expansion. Strategic partnerships and collaborations between established players and startups will play a key role in accelerating innovation and market penetration. The focus on developing cost-effective and high-performance nanosensors will be crucial for wider adoption across diverse applications.
Middle-East and Africa Nanosensors Market Segmentation
-
1. Type
- 1.1. Force Sensor
- 1.2. Biosensors
- 1.3. Radiation Sensors
- 1.4. Chemical Sensors
- 1.5. Thermal Sensors
-
2. Industry
- 2.1. Consumer Electronics
- 2.2. Power Generation
- 2.3. Automotive
- 2.4. Petrochemical
- 2.5. Aerospace and Defense
- 2.6. Healthcare
- 2.7. Industrial
- 2.8. Other Industries
Middle-East and Africa Nanosensors Market Segmentation By Geography
-
1. Middle East
- 1.1. Saudi Arabia
- 1.2. United Arab Emirates
- 1.3. Israel
- 1.4. Qatar
- 1.5. Kuwait
- 1.6. Oman
- 1.7. Bahrain
- 1.8. Jordan
- 1.9. Lebanon
Middle-East and Africa Nanosensors Market REPORT HIGHLIGHTS
| Aspects | Details |
|---|---|
| Study Period | 2019-2033 |
| Base Year | 2024 |
| Estimated Year | 2025 |
| Forecast Period | 2025-2033 |
| Historical Period | 2019-2024 |
| Growth Rate | CAGR of 65.32% from 2019-2033 |
| Segmentation |
|
Table of Contents
- 1. Introduction
- 1.1. Research Scope
- 1.2. Market Segmentation
- 1.3. Research Methodology
- 1.4. Definitions and Assumptions
- 2. Executive Summary
- 2.1. Introduction
- 3. Market Dynamics
- 3.1. Introduction
- 3.2. Market Drivers
- 3.2.1. Increased R&D Activities in the Nanosensor Industry; Growing Use in Various Applications Such as Automotive and Medical
- 3.3. Market Restrains
- 3.3.1. Manufacturing Complexity of Nanosensors; Detection Limit and Lack of Industry Specification
- 3.4. Market Trends
- 3.4.1. Healthcare to Hold a Significant Market Share
- 4. Market Factor Analysis
- 4.1. Porters Five Forces
- 4.2. Supply/Value Chain
- 4.3. PESTEL analysis
- 4.4. Market Entropy
- 4.5. Patent/Trademark Analysis
- 5. Middle-East and Africa Nanosensors Market Analysis, Insights and Forecast, 2019-2031
- 5.1. Market Analysis, Insights and Forecast - by Type
- 5.1.1. Force Sensor
- 5.1.2. Biosensors
- 5.1.3. Radiation Sensors
- 5.1.4. Chemical Sensors
- 5.1.5. Thermal Sensors
- 5.2. Market Analysis, Insights and Forecast - by Industry
- 5.2.1. Consumer Electronics
- 5.2.2. Power Generation
- 5.2.3. Automotive
- 5.2.4. Petrochemical
- 5.2.5. Aerospace and Defense
- 5.2.6. Healthcare
- 5.2.7. Industrial
- 5.2.8. Other Industries
- 5.3. Market Analysis, Insights and Forecast - by Region
- 5.3.1. Middle East
- 5.1. Market Analysis, Insights and Forecast - by Type
- 6. South Africa Middle-East and Africa Nanosensors Market Analysis, Insights and Forecast, 2019-2031
- 7. Sudan Middle-East and Africa Nanosensors Market Analysis, Insights and Forecast, 2019-2031
- 8. Uganda Middle-East and Africa Nanosensors Market Analysis, Insights and Forecast, 2019-2031
- 9. Tanzania Middle-East and Africa Nanosensors Market Analysis, Insights and Forecast, 2019-2031
- 10. Kenya Middle-East and Africa Nanosensors Market Analysis, Insights and Forecast, 2019-2031
- 11. Rest of Africa Middle-East and Africa Nanosensors Market Analysis, Insights and Forecast, 2019-2031
- 12. Competitive Analysis
- 12.1. Market Share Analysis 2024
- 12.2. Company Profiles
- 12.2.1 Honeywell International Inc
- 12.2.1.1. Overview
- 12.2.1.2. Products
- 12.2.1.3. SWOT Analysis
- 12.2.1.4. Recent Developments
- 12.2.1.5. Financials (Based on Availability)
- 12.2.2 Denso Corporation
- 12.2.2.1. Overview
- 12.2.2.2. Products
- 12.2.2.3. SWOT Analysis
- 12.2.2.4. Recent Developments
- 12.2.2.5. Financials (Based on Availability)
- 12.2.3 Texas Instruments
- 12.2.3.1. Overview
- 12.2.3.2. Products
- 12.2.3.3. SWOT Analysis
- 12.2.3.4. Recent Developments
- 12.2.3.5. Financials (Based on Availability)
- 12.2.4 Toshiba Corp
- 12.2.4.1. Overview
- 12.2.4.2. Products
- 12.2.4.3. SWOT Analysis
- 12.2.4.4. Recent Developments
- 12.2.4.5. Financials (Based on Availability)
- 12.2.5 Sensonor AS
- 12.2.5.1. Overview
- 12.2.5.2. Products
- 12.2.5.3. SWOT Analysis
- 12.2.5.4. Recent Developments
- 12.2.5.5. Financials (Based on Availability)
- 12.2.6 STMicroelectronics
- 12.2.6.1. Overview
- 12.2.6.2. Products
- 12.2.6.3. SWOT Analysis
- 12.2.6.4. Recent Developments
- 12.2.6.5. Financials (Based on Availability)
- 12.2.7 Robert Bosch GmbH
- 12.2.7.1. Overview
- 12.2.7.2. Products
- 12.2.7.3. SWOT Analysis
- 12.2.7.4. Recent Developments
- 12.2.7.5. Financials (Based on Availability)
- 12.2.8 Silicon Designs Inc
- 12.2.8.1. Overview
- 12.2.8.2. Products
- 12.2.8.3. SWOT Analysis
- 12.2.8.4. Recent Developments
- 12.2.8.5. Financials (Based on Availability)
- 12.2.9 Flir Systems Inc
- 12.2.9.1. Overview
- 12.2.9.2. Products
- 12.2.9.3. SWOT Analysis
- 12.2.9.4. Recent Developments
- 12.2.9.5. Financials (Based on Availability)
- 12.2.10 Analog Devices Inc
- 12.2.10.1. Overview
- 12.2.10.2. Products
- 12.2.10.3. SWOT Analysis
- 12.2.10.4. Recent Developments
- 12.2.10.5. Financials (Based on Availability)
- 12.2.11 GE Sensing
- 12.2.11.1. Overview
- 12.2.11.2. Products
- 12.2.11.3. SWOT Analysis
- 12.2.11.4. Recent Developments
- 12.2.11.5. Financials (Based on Availability)
- 12.2.12 Omron Corp
- 12.2.12.1. Overview
- 12.2.12.2. Products
- 12.2.12.3. SWOT Analysis
- 12.2.12.4. Recent Developments
- 12.2.12.5. Financials (Based on Availability)
- 12.2.13 Agilent Technologies
- 12.2.13.1. Overview
- 12.2.13.2. Products
- 12.2.13.3. SWOT Analysis
- 12.2.13.4. Recent Developments
- 12.2.13.5. Financials (Based on Availability)
- 12.2.1 Honeywell International Inc
List of Figures
- Figure 1: Middle-East and Africa Nanosensors Market Revenue Breakdown (Million, %) by Product 2024 & 2032
- Figure 2: Middle-East and Africa Nanosensors Market Share (%) by Company 2024
List of Tables
- Table 1: Middle-East and Africa Nanosensors Market Revenue Million Forecast, by Region 2019 & 2032
- Table 2: Middle-East and Africa Nanosensors Market Volume nanometers Forecast, by Region 2019 & 2032
- Table 3: Middle-East and Africa Nanosensors Market Revenue Million Forecast, by Type 2019 & 2032
- Table 4: Middle-East and Africa Nanosensors Market Volume nanometers Forecast, by Type 2019 & 2032
- Table 5: Middle-East and Africa Nanosensors Market Revenue Million Forecast, by Industry 2019 & 2032
- Table 6: Middle-East and Africa Nanosensors Market Volume nanometers Forecast, by Industry 2019 & 2032
- Table 7: Middle-East and Africa Nanosensors Market Revenue Million Forecast, by Region 2019 & 2032
- Table 8: Middle-East and Africa Nanosensors Market Volume nanometers Forecast, by Region 2019 & 2032
- Table 9: Middle-East and Africa Nanosensors Market Revenue Million Forecast, by Country 2019 & 2032
- Table 10: Middle-East and Africa Nanosensors Market Volume nanometers Forecast, by Country 2019 & 2032
- Table 11: South Africa Middle-East and Africa Nanosensors Market Revenue (Million) Forecast, by Application 2019 & 2032
- Table 12: South Africa Middle-East and Africa Nanosensors Market Volume (nanometers) Forecast, by Application 2019 & 2032
- Table 13: Sudan Middle-East and Africa Nanosensors Market Revenue (Million) Forecast, by Application 2019 & 2032
- Table 14: Sudan Middle-East and Africa Nanosensors Market Volume (nanometers) Forecast, by Application 2019 & 2032
- Table 15: Uganda Middle-East and Africa Nanosensors Market Revenue (Million) Forecast, by Application 2019 & 2032
- Table 16: Uganda Middle-East and Africa Nanosensors Market Volume (nanometers) Forecast, by Application 2019 & 2032
- Table 17: Tanzania Middle-East and Africa Nanosensors Market Revenue (Million) Forecast, by Application 2019 & 2032
- Table 18: Tanzania Middle-East and Africa Nanosensors Market Volume (nanometers) Forecast, by Application 2019 & 2032
- Table 19: Kenya Middle-East and Africa Nanosensors Market Revenue (Million) Forecast, by Application 2019 & 2032
- Table 20: Kenya Middle-East and Africa Nanosensors Market Volume (nanometers) Forecast, by Application 2019 & 2032
- Table 21: Rest of Africa Middle-East and Africa Nanosensors Market Revenue (Million) Forecast, by Application 2019 & 2032
- Table 22: Rest of Africa Middle-East and Africa Nanosensors Market Volume (nanometers) Forecast, by Application 2019 & 2032
- Table 23: Middle-East and Africa Nanosensors Market Revenue Million Forecast, by Type 2019 & 2032
- Table 24: Middle-East and Africa Nanosensors Market Volume nanometers Forecast, by Type 2019 & 2032
- Table 25: Middle-East and Africa Nanosensors Market Revenue Million Forecast, by Industry 2019 & 2032
- Table 26: Middle-East and Africa Nanosensors Market Volume nanometers Forecast, by Industry 2019 & 2032
- Table 27: Middle-East and Africa Nanosensors Market Revenue Million Forecast, by Country 2019 & 2032
- Table 28: Middle-East and Africa Nanosensors Market Volume nanometers Forecast, by Country 2019 & 2032
- Table 29: Saudi Arabia Middle-East and Africa Nanosensors Market Revenue (Million) Forecast, by Application 2019 & 2032
- Table 30: Saudi Arabia Middle-East and Africa Nanosensors Market Volume (nanometers) Forecast, by Application 2019 & 2032
- Table 31: United Arab Emirates Middle-East and Africa Nanosensors Market Revenue (Million) Forecast, by Application 2019 & 2032
- Table 32: United Arab Emirates Middle-East and Africa Nanosensors Market Volume (nanometers) Forecast, by Application 2019 & 2032
- Table 33: Israel Middle-East and Africa Nanosensors Market Revenue (Million) Forecast, by Application 2019 & 2032
- Table 34: Israel Middle-East and Africa Nanosensors Market Volume (nanometers) Forecast, by Application 2019 & 2032
- Table 35: Qatar Middle-East and Africa Nanosensors Market Revenue (Million) Forecast, by Application 2019 & 2032
- Table 36: Qatar Middle-East and Africa Nanosensors Market Volume (nanometers) Forecast, by Application 2019 & 2032
- Table 37: Kuwait Middle-East and Africa Nanosensors Market Revenue (Million) Forecast, by Application 2019 & 2032
- Table 38: Kuwait Middle-East and Africa Nanosensors Market Volume (nanometers) Forecast, by Application 2019 & 2032
- Table 39: Oman Middle-East and Africa Nanosensors Market Revenue (Million) Forecast, by Application 2019 & 2032
- Table 40: Oman Middle-East and Africa Nanosensors Market Volume (nanometers) Forecast, by Application 2019 & 2032
- Table 41: Bahrain Middle-East and Africa Nanosensors Market Revenue (Million) Forecast, by Application 2019 & 2032
- Table 42: Bahrain Middle-East and Africa Nanosensors Market Volume (nanometers) Forecast, by Application 2019 & 2032
- Table 43: Jordan Middle-East and Africa Nanosensors Market Revenue (Million) Forecast, by Application 2019 & 2032
- Table 44: Jordan Middle-East and Africa Nanosensors Market Volume (nanometers) Forecast, by Application 2019 & 2032
- Table 45: Lebanon Middle-East and Africa Nanosensors Market Revenue (Million) Forecast, by Application 2019 & 2032
- Table 46: Lebanon Middle-East and Africa Nanosensors Market Volume (nanometers) Forecast, by Application 2019 & 2032
Frequently Asked Questions
1. What is the projected Compound Annual Growth Rate (CAGR) of the Middle-East and Africa Nanosensors Market?
The projected CAGR is approximately 65.32%.
2. Which companies are prominent players in the Middle-East and Africa Nanosensors Market?
Key companies in the market include Honeywell International Inc, Denso Corporation, Texas Instruments, Toshiba Corp, Sensonor AS, STMicroelectronics, Robert Bosch GmbH, Silicon Designs Inc, Flir Systems Inc, Analog Devices Inc, GE Sensing, Omron Corp, Agilent Technologies.
3. What are the main segments of the Middle-East and Africa Nanosensors Market?
The market segments include Type, Industry.
4. Can you provide details about the market size?
The market size is estimated to be USD XX Million as of 2022.
5. What are some drivers contributing to market growth?
Increased R&D Activities in the Nanosensor Industry; Growing Use in Various Applications Such as Automotive and Medical.
6. What are the notable trends driving market growth?
Healthcare to Hold a Significant Market Share.
7. Are there any restraints impacting market growth?
Manufacturing Complexity of Nanosensors; Detection Limit and Lack of Industry Specification.
8. Can you provide examples of recent developments in the market?
May 2021 - MS-Tech, a global developer, manufacturer, and innovator of nanotechnology detection and diagnostics sensors, announced that its detection division completed shipments and installations of its EXPLOSCAN and DUOSCAN detectors across Europe, Africa, and the Middle East. DUOSCAN is a trace and vapor detection system that detects and identifies minute quantities of narcotics and explosives, as well as improvised explosives, such as TATP and HMTD.
9. What pricing options are available for accessing the report?
Pricing options include single-user, multi-user, and enterprise licenses priced at USD 4750, USD 4950, and USD 6800 respectively.
10. Is the market size provided in terms of value or volume?
The market size is provided in terms of value, measured in Million and volume, measured in nanometers.
11. Are there any specific market keywords associated with the report?
Yes, the market keyword associated with the report is "Middle-East and Africa Nanosensors Market," which aids in identifying and referencing the specific market segment covered.
12. How do I determine which pricing option suits my needs best?
The pricing options vary based on user requirements and access needs. Individual users may opt for single-user licenses, while businesses requiring broader access may choose multi-user or enterprise licenses for cost-effective access to the report.
13. Are there any additional resources or data provided in the Middle-East and Africa Nanosensors Market report?
While the report offers comprehensive insights, it's advisable to review the specific contents or supplementary materials provided to ascertain if additional resources or data are available.
14. How can I stay updated on further developments or reports in the Middle-East and Africa Nanosensors Market?
To stay informed about further developments, trends, and reports in the Middle-East and Africa Nanosensors Market, consider subscribing to industry newsletters, following relevant companies and organizations, or regularly checking reputable industry news sources and publications.
Methodology
Step 1 - Identification of Relevant Samples Size from Population Database


Step 2 - Approaches for Defining Global Market Size (Value, Volume* & Price*)

Note*: In applicable scenarios
Step 3 - Data Sources
Primary Research
- Web Analytics
- Survey Reports
- Research Institute
- Latest Research Reports
- Opinion Leaders
Secondary Research
- Annual Reports
- White Paper
- Latest Press Release
- Industry Association
- Paid Database
- Investor Presentations

Step 4 - Data Triangulation
Involves using different sources of information in order to increase the validity of a study
These sources are likely to be stakeholders in a program - participants, other researchers, program staff, other community members, and so on.
Then we put all data in single framework & apply various statistical tools to find out the dynamic on the market.
During the analysis stage, feedback from the stakeholder groups would be compared to determine areas of agreement as well as areas of divergence


