
Key Insights
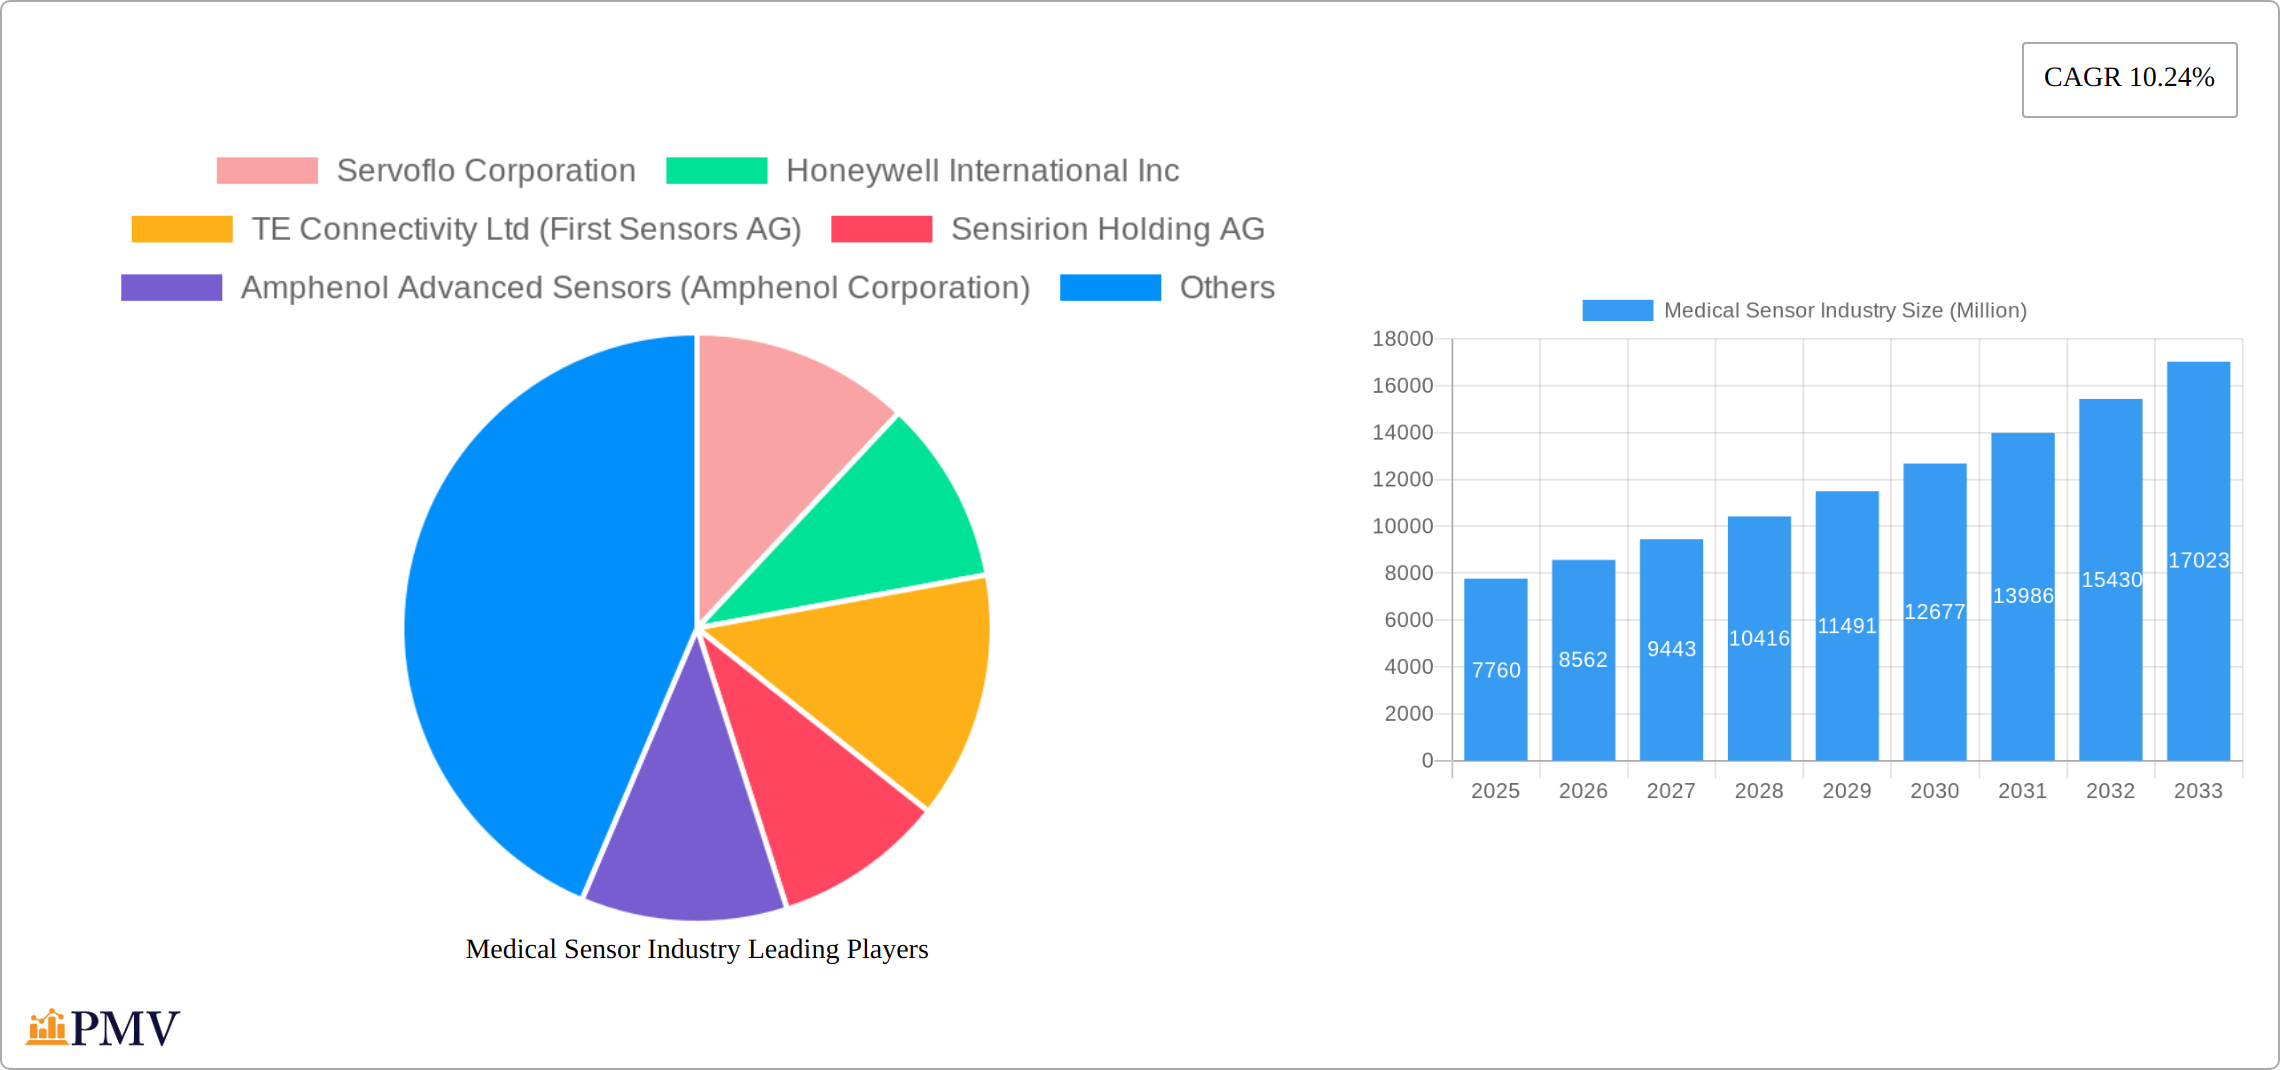
The global medical sensor market, valued at $7.76 billion in 2025, is projected to experience robust growth, exhibiting a Compound Annual Growth Rate (CAGR) of 10.24% from 2025 to 2033. This expansion is fueled by several key factors. The increasing prevalence of chronic diseases necessitates advanced diagnostic and monitoring tools, driving demand for sophisticated medical sensors. Technological advancements, particularly in miniaturization, wireless connectivity, and improved sensor accuracy, are enabling the development of smaller, more efficient, and user-friendly devices. Furthermore, the rising adoption of minimally invasive surgical procedures and remote patient monitoring (RPM) systems further contributes to market growth. The integration of medical sensors into wearable technology and implantable devices is also creating new opportunities. Competition among established players and emerging companies is driving innovation and price reductions, making these technologies more accessible.
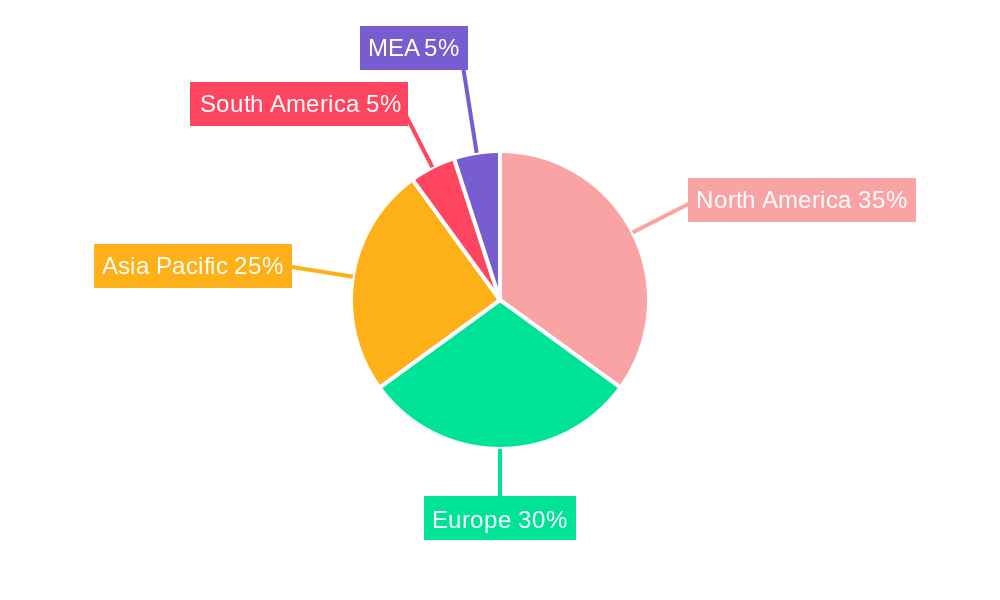
The market segmentation reveals significant opportunities within specific application areas. Clinical applications, encompassing diagnostic imaging, therapeutic devices, and point-of-care diagnostics, represent a substantial portion of the market. The growing consumer demand for health and wellness tracking through wearable fitness trackers and personal health monitors is also boosting the consumer applications segment. Within component types, flow sensors, biosensors, and temperature sensors hold significant market share due to their wide use in various medical applications. Geographically, North America and Europe are currently leading the market due to higher healthcare expenditure and technological advancements. However, the Asia-Pacific region is expected to witness substantial growth in the coming years driven by rising healthcare infrastructure development and increasing adoption of advanced medical technologies in rapidly developing economies. The market faces challenges such as regulatory hurdles for new medical devices and the cost associated with advanced sensor technologies. However, these challenges are likely to be mitigated by continuous innovation and regulatory streamlining.
Medical Sensor Industry Market Report: 2019-2033
This comprehensive report provides a detailed analysis of the Medical Sensor Industry, offering invaluable insights for stakeholders seeking to navigate this rapidly evolving landscape. With a study period spanning 2019-2033, a base year of 2025, and a forecast period of 2025-2033, this report offers a robust understanding of past performance, present status, and future projections, valued at xx Million USD.
Medical Sensor Industry Market Structure & Competitive Dynamics
The medical sensor market is characterized by a moderately concentrated structure with several key players commanding significant market share. The industry's innovation ecosystem is robust, driven by ongoing R&D investments in miniaturization, improved accuracy, and wireless connectivity. Stringent regulatory frameworks, particularly concerning safety and efficacy, shape product development and market entry. The presence of substitute technologies, such as traditional diagnostic methods, poses a competitive challenge. End-user trends, including the increasing adoption of remote patient monitoring and personalized medicine, are major growth drivers. Mergers and acquisitions (M&A) activity is prevalent, with larger players consolidating their market position and acquiring innovative smaller companies. For example, TE Connectivity's acquisition of Toolbox Medical Innovations, Wi Inc., and micro liquid in September 2021 illustrates this trend. While precise market share figures for each company vary annually, major players like Honeywell International Inc. and Siemens AG hold substantial portions of the market. The total value of M&A deals within the industry during the historical period (2019-2024) reached an estimated xx Million USD.
Medical Sensor Industry Industry Trends & Insights
The medical sensor market is experiencing robust growth, fueled by several converging factors. The escalating prevalence of chronic diseases necessitates continuous health monitoring, driving significant demand for both wearable and implantable sensors. This demand is further amplified by an aging global population and the increasing awareness of preventative healthcare. Technological advancements are paramount, with miniaturized, low-power sensors boasting enhanced accuracy and reliability, expanding the applications across diverse medical fields. Consumers increasingly favor convenient, non-invasive diagnostic tools, contributing to this market expansion. A notable shift is underway towards wireless and interconnected sensors, enabling seamless data transmission and facilitating remote patient monitoring. This interconnectedness is powered by advancements in the Internet of Medical Things (IoMT) and sophisticated cloud computing capabilities, allowing for real-time data analysis and improved patient outcomes. The market is projected to experience a substantial Compound Annual Growth Rate (CAGR) of [Insert Projected CAGR]% during the forecast period (2025-2033), with significant market penetration anticipated in both clinical and consumer applications. The competitive landscape is highly dynamic, with companies strategically focusing on innovation, strategic partnerships, mergers, and acquisitions to secure and maintain their market leadership positions.
Dominant Markets & Segments in Medical Sensor Industry
North America currently commands the largest market share in the medical sensor industry, attributable to its robust healthcare infrastructure, widespread adoption of advanced medical technologies, and high per capita healthcare expenditure. Within the component segment, biosensors exhibit exceptional growth potential, driven by the surging demand for point-of-care diagnostics and the personalized medicine revolution. Temperature sensors maintain a strong market presence due to their ubiquitous application across various medical procedures and devices.
- Key Drivers for North American Dominance:
- Advanced healthcare infrastructure and robust regulatory frameworks
- High adoption rate of cutting-edge medical technologies and digital health solutions
- Substantial government and private funding for medical research and development
- Stringent regulatory environment fostering innovation while ensuring safety and efficacy
- Favorable reimbursement policies incentivizing the adoption of advanced medical technologies
Regarding applications, clinical applications, encompassing patient monitoring, diagnostics, and therapeutics, constitute a major segment. The consumer segment is also experiencing remarkable expansion, fueled by the growing awareness of personal health and wellness, particularly amongst younger demographics.
- Key Drivers for Clinical Applications Dominance:
- Rising prevalence of chronic diseases such as diabetes, heart disease, and cancer
- Growing demand for remote patient monitoring to improve patient outcomes and reduce hospital readmissions
- Increasing adoption of minimally invasive procedures, which often rely on advanced sensor technology
- Government initiatives globally promoting telehealth and remote healthcare delivery models
Medical Sensor Industry Product Innovations
Recent innovations in medical sensors focus on enhancing miniaturization, improving accuracy and sensitivity, and integrating advanced functionalities such as wireless connectivity and data analytics. For instance, the development of flexible and implantable biosensors for continuous health monitoring represents a significant advancement. These innovations offer improved patient comfort, real-time data acquisition, and the potential for early disease detection. Such advancements contribute to the increasing market demand for advanced medical sensor technology.
Report Segmentation & Scope
This report segments the medical sensor market by component (flow sensor, biosensor, temperature sensor, pressure sensor, other types) and by application (clinical applications, consumer applications). Each segment undergoes detailed analysis encompassing growth projections, market size (in Million USD), and a comprehensive assessment of the competitive dynamics. The “other types” segment encompasses a diverse range of sensors including optical sensors, electrochemical sensors, and other specialized sensor technologies. The clinical applications segment encompasses medical devices, hospital equipment, and diagnostic tools, while the consumer applications segment includes wearable health trackers, home monitoring devices, and various personal healthcare products. The report provides precise market size estimations and detailed growth projections for each segment, offering valuable insights for market participants.
Key Drivers of Medical Sensor Industry Growth
Several factors drive the growth of the medical sensor industry: Technological advancements, specifically in miniaturization, wireless communication, and data analytics, are expanding the applications of medical sensors. The rising prevalence of chronic diseases and the increasing demand for remote patient monitoring are creating significant demand. Favorable regulatory environments and supportive government initiatives are promoting innovation and market expansion. Finally, increasing investments in medical research and development further fuel market growth.
Challenges in the Medical Sensor Industry Sector
The medical sensor industry navigates several key challenges: Stringent regulatory requirements for medical devices can significantly impede product development timelines and market entry strategies. Supply chain vulnerabilities and potential disruptions can impact the availability of essential components. Intense competition from both established industry players and emerging innovative companies necessitates continuous innovation, cost optimization, and strategic differentiation. These factors collectively influence industry growth and profitability, demanding effective strategies for risk mitigation and operational resilience.
Leading Players in the Medical Sensor Industry Market
- Servoflo Corporation
- Honeywell International Inc. Honeywell
- TE Connectivity Ltd (First Sensors AG) TE Connectivity
- Sensirion Holding AG Sensirion
- Amphenol Advanced Sensors (Amphenol Corporation) Amphenol Advanced Sensors
- Siemens AG Siemens
- Omron Corporation Omron
- STMicroelectronics NV STMicroelectronics
- NXP Semiconductors (Freescale Semiconductor) NXP Semiconductors
- GE Healthcare Inc. GE Healthcare
Key Developments in Medical Sensor Industry Sector
- August 2022: Sibel Health secured USD 33 Million in Series B funding to scale wearable sensors for remote patient monitoring.
- August 2022: Nottingham Trent University and Nottingham University Hospitals NHS Trust developed a new biosensor for chronic wound monitoring.
- September 2021: TE Connectivity Ltd acquired Toolbox Medical Innovations, Wi Inc., and micro liquid, expanding its manufacturing capabilities.
- May 2021: Honeywell expanded its ThermoRebellion temperature monitoring solution deployment at Boston Logan International Airport.
Strategic Medical Sensor Industry Market Outlook
The medical sensor industry is poised for substantial continued growth, driven by several powerful forces: rapid technological advancements, increasing global healthcare expenditure, and the escalating prevalence of chronic diseases. Strategic opportunities abound in developing cutting-edge sensor technologies for remote patient monitoring, point-of-care diagnostics, and the rapidly expanding field of personalized medicine. Companies adept at miniaturization, enhancing sensor accuracy, and integrating robust wireless connectivity will gain a significant competitive advantage. Furthermore, the integration of artificial intelligence (AI) and machine learning (ML) capabilities into medical sensors presents a compelling avenue for growth and market expansion, unlocking new possibilities for predictive diagnostics and proactive healthcare management.
Medical Sensor Industry Segmentation
-
1. Component
- 1.1. Flow Sensor
- 1.2. Biosensor
- 1.3. Temperature Sensor
- 1.4. Pressure Sensor
- 1.5. Other Types
-
2. Application
- 2.1. Clinical Applications
- 2.2. Consumer Applications
Medical Sensor Industry Segmentation By Geography
- 1. North America
- 2. Europe
- 3. Asia
- 4. Australia and New Zealand
- 5. Latin America
- 6. Middle East and Africa
Medical Sensor Industry REPORT HIGHLIGHTS
| Aspects | Details |
|---|---|
| Study Period | 2019-2033 |
| Base Year | 2024 |
| Estimated Year | 2025 |
| Forecast Period | 2025-2033 |
| Historical Period | 2019-2024 |
| Growth Rate | CAGR of 10.24% from 2019-2033 |
| Segmentation |
|
Table of Contents
- 1. Introduction
- 1.1. Research Scope
- 1.2. Market Segmentation
- 1.3. Research Methodology
- 1.4. Definitions and Assumptions
- 2. Executive Summary
- 2.1. Introduction
- 3. Market Dynamics
- 3.1. Introduction
- 3.2. Market Drivers
- 3.2.1. Miniaturization of Sensors Leading to Ease in Integration; Increasing Advancement in Medical Devices and Accessories
- 3.3. Market Restrains
- 3.3.1. Lack of Proper IoT Technology Skills across Healthcare Organizations; High Deployment Cost of Necessary Infrastructure and Connected Medical Devices
- 3.4. Market Trends
- 3.4.1. Pressure Sensors Play a Significant Role in the Medical Sensor Market
- 4. Market Factor Analysis
- 4.1. Porters Five Forces
- 4.2. Supply/Value Chain
- 4.3. PESTEL analysis
- 4.4. Market Entropy
- 4.5. Patent/Trademark Analysis
- 5. Global Medical Sensor Industry Analysis, Insights and Forecast, 2019-2031
- 5.1. Market Analysis, Insights and Forecast - by Component
- 5.1.1. Flow Sensor
- 5.1.2. Biosensor
- 5.1.3. Temperature Sensor
- 5.1.4. Pressure Sensor
- 5.1.5. Other Types
- 5.2. Market Analysis, Insights and Forecast - by Application
- 5.2.1. Clinical Applications
- 5.2.2. Consumer Applications
- 5.3. Market Analysis, Insights and Forecast - by Region
- 5.3.1. North America
- 5.3.2. Europe
- 5.3.3. Asia
- 5.3.4. Australia and New Zealand
- 5.3.5. Latin America
- 5.3.6. Middle East and Africa
- 5.1. Market Analysis, Insights and Forecast - by Component
- 6. North America Medical Sensor Industry Analysis, Insights and Forecast, 2019-2031
- 6.1. Market Analysis, Insights and Forecast - by Component
- 6.1.1. Flow Sensor
- 6.1.2. Biosensor
- 6.1.3. Temperature Sensor
- 6.1.4. Pressure Sensor
- 6.1.5. Other Types
- 6.2. Market Analysis, Insights and Forecast - by Application
- 6.2.1. Clinical Applications
- 6.2.2. Consumer Applications
- 6.1. Market Analysis, Insights and Forecast - by Component
- 7. Europe Medical Sensor Industry Analysis, Insights and Forecast, 2019-2031
- 7.1. Market Analysis, Insights and Forecast - by Component
- 7.1.1. Flow Sensor
- 7.1.2. Biosensor
- 7.1.3. Temperature Sensor
- 7.1.4. Pressure Sensor
- 7.1.5. Other Types
- 7.2. Market Analysis, Insights and Forecast - by Application
- 7.2.1. Clinical Applications
- 7.2.2. Consumer Applications
- 7.1. Market Analysis, Insights and Forecast - by Component
- 8. Asia Medical Sensor Industry Analysis, Insights and Forecast, 2019-2031
- 8.1. Market Analysis, Insights and Forecast - by Component
- 8.1.1. Flow Sensor
- 8.1.2. Biosensor
- 8.1.3. Temperature Sensor
- 8.1.4. Pressure Sensor
- 8.1.5. Other Types
- 8.2. Market Analysis, Insights and Forecast - by Application
- 8.2.1. Clinical Applications
- 8.2.2. Consumer Applications
- 8.1. Market Analysis, Insights and Forecast - by Component
- 9. Australia and New Zealand Medical Sensor Industry Analysis, Insights and Forecast, 2019-2031
- 9.1. Market Analysis, Insights and Forecast - by Component
- 9.1.1. Flow Sensor
- 9.1.2. Biosensor
- 9.1.3. Temperature Sensor
- 9.1.4. Pressure Sensor
- 9.1.5. Other Types
- 9.2. Market Analysis, Insights and Forecast - by Application
- 9.2.1. Clinical Applications
- 9.2.2. Consumer Applications
- 9.1. Market Analysis, Insights and Forecast - by Component
- 10. Latin America Medical Sensor Industry Analysis, Insights and Forecast, 2019-2031
- 10.1. Market Analysis, Insights and Forecast - by Component
- 10.1.1. Flow Sensor
- 10.1.2. Biosensor
- 10.1.3. Temperature Sensor
- 10.1.4. Pressure Sensor
- 10.1.5. Other Types
- 10.2. Market Analysis, Insights and Forecast - by Application
- 10.2.1. Clinical Applications
- 10.2.2. Consumer Applications
- 10.1. Market Analysis, Insights and Forecast - by Component
- 11. Middle East and Africa Medical Sensor Industry Analysis, Insights and Forecast, 2019-2031
- 11.1. Market Analysis, Insights and Forecast - by Component
- 11.1.1. Flow Sensor
- 11.1.2. Biosensor
- 11.1.3. Temperature Sensor
- 11.1.4. Pressure Sensor
- 11.1.5. Other Types
- 11.2. Market Analysis, Insights and Forecast - by Application
- 11.2.1. Clinical Applications
- 11.2.2. Consumer Applications
- 11.1. Market Analysis, Insights and Forecast - by Component
- 12. North America Medical Sensor Industry Analysis, Insights and Forecast, 2019-2031
- 12.1. Market Analysis, Insights and Forecast - By Country/Sub-region
- 12.1.1 United States
- 12.1.2 Canada
- 12.1.3 Mexico
- 13. Europe Medical Sensor Industry Analysis, Insights and Forecast, 2019-2031
- 13.1. Market Analysis, Insights and Forecast - By Country/Sub-region
- 13.1.1 Germany
- 13.1.2 United Kingdom
- 13.1.3 France
- 13.1.4 Spain
- 13.1.5 Italy
- 13.1.6 Spain
- 13.1.7 Belgium
- 13.1.8 Netherland
- 13.1.9 Nordics
- 13.1.10 Rest of Europe
- 14. Asia Pacific Medical Sensor Industry Analysis, Insights and Forecast, 2019-2031
- 14.1. Market Analysis, Insights and Forecast - By Country/Sub-region
- 14.1.1 China
- 14.1.2 Japan
- 14.1.3 India
- 14.1.4 South Korea
- 14.1.5 Southeast Asia
- 14.1.6 Australia
- 14.1.7 Indonesia
- 14.1.8 Phillipes
- 14.1.9 Singapore
- 14.1.10 Thailandc
- 14.1.11 Rest of Asia Pacific
- 15. South America Medical Sensor Industry Analysis, Insights and Forecast, 2019-2031
- 15.1. Market Analysis, Insights and Forecast - By Country/Sub-region
- 15.1.1 Brazil
- 15.1.2 Argentina
- 15.1.3 Peru
- 15.1.4 Chile
- 15.1.5 Colombia
- 15.1.6 Ecuador
- 15.1.7 Venezuela
- 15.1.8 Rest of South America
- 16. North America Medical Sensor Industry Analysis, Insights and Forecast, 2019-2031
- 16.1. Market Analysis, Insights and Forecast - By Country/Sub-region
- 16.1.1 United States
- 16.1.2 Canada
- 16.1.3 Mexico
- 17. MEA Medical Sensor Industry Analysis, Insights and Forecast, 2019-2031
- 17.1. Market Analysis, Insights and Forecast - By Country/Sub-region
- 17.1.1 United Arab Emirates
- 17.1.2 Saudi Arabia
- 17.1.3 South Africa
- 17.1.4 Rest of Middle East and Africa
- 18. Competitive Analysis
- 18.1. Global Market Share Analysis 2024
- 18.2. Company Profiles
- 18.2.1 Servoflo Corporation
- 18.2.1.1. Overview
- 18.2.1.2. Products
- 18.2.1.3. SWOT Analysis
- 18.2.1.4. Recent Developments
- 18.2.1.5. Financials (Based on Availability)
- 18.2.2 Honeywell International Inc
- 18.2.2.1. Overview
- 18.2.2.2. Products
- 18.2.2.3. SWOT Analysis
- 18.2.2.4. Recent Developments
- 18.2.2.5. Financials (Based on Availability)
- 18.2.3 TE Connectivity Ltd (First Sensors AG)
- 18.2.3.1. Overview
- 18.2.3.2. Products
- 18.2.3.3. SWOT Analysis
- 18.2.3.4. Recent Developments
- 18.2.3.5. Financials (Based on Availability)
- 18.2.4 Sensirion Holding AG
- 18.2.4.1. Overview
- 18.2.4.2. Products
- 18.2.4.3. SWOT Analysis
- 18.2.4.4. Recent Developments
- 18.2.4.5. Financials (Based on Availability)
- 18.2.5 Amphenol Advanced Sensors (Amphenol Corporation)
- 18.2.5.1. Overview
- 18.2.5.2. Products
- 18.2.5.3. SWOT Analysis
- 18.2.5.4. Recent Developments
- 18.2.5.5. Financials (Based on Availability)
- 18.2.6 Siemens AG
- 18.2.6.1. Overview
- 18.2.6.2. Products
- 18.2.6.3. SWOT Analysis
- 18.2.6.4. Recent Developments
- 18.2.6.5. Financials (Based on Availability)
- 18.2.7 Omron Corporation
- 18.2.7.1. Overview
- 18.2.7.2. Products
- 18.2.7.3. SWOT Analysis
- 18.2.7.4. Recent Developments
- 18.2.7.5. Financials (Based on Availability)
- 18.2.8 STMicroelectronics NV
- 18.2.8.1. Overview
- 18.2.8.2. Products
- 18.2.8.3. SWOT Analysis
- 18.2.8.4. Recent Developments
- 18.2.8.5. Financials (Based on Availability)
- 18.2.9 NXP Semiconductors (Freescale Semiconductor)
- 18.2.9.1. Overview
- 18.2.9.2. Products
- 18.2.9.3. SWOT Analysis
- 18.2.9.4. Recent Developments
- 18.2.9.5. Financials (Based on Availability)
- 18.2.10 GE Healthcare Inc
- 18.2.10.1. Overview
- 18.2.10.2. Products
- 18.2.10.3. SWOT Analysis
- 18.2.10.4. Recent Developments
- 18.2.10.5. Financials (Based on Availability)
- 18.2.1 Servoflo Corporation
List of Figures
- Figure 1: Global Medical Sensor Industry Revenue Breakdown (Million, %) by Region 2024 & 2032
- Figure 2: Global Medical Sensor Industry Volume Breakdown (K Unit, %) by Region 2024 & 2032
- Figure 3: North America Medical Sensor Industry Revenue (Million), by Country 2024 & 2032
- Figure 4: North America Medical Sensor Industry Volume (K Unit), by Country 2024 & 2032
- Figure 5: North America Medical Sensor Industry Revenue Share (%), by Country 2024 & 2032
- Figure 6: North America Medical Sensor Industry Volume Share (%), by Country 2024 & 2032
- Figure 7: Europe Medical Sensor Industry Revenue (Million), by Country 2024 & 2032
- Figure 8: Europe Medical Sensor Industry Volume (K Unit), by Country 2024 & 2032
- Figure 9: Europe Medical Sensor Industry Revenue Share (%), by Country 2024 & 2032
- Figure 10: Europe Medical Sensor Industry Volume Share (%), by Country 2024 & 2032
- Figure 11: Asia Pacific Medical Sensor Industry Revenue (Million), by Country 2024 & 2032
- Figure 12: Asia Pacific Medical Sensor Industry Volume (K Unit), by Country 2024 & 2032
- Figure 13: Asia Pacific Medical Sensor Industry Revenue Share (%), by Country 2024 & 2032
- Figure 14: Asia Pacific Medical Sensor Industry Volume Share (%), by Country 2024 & 2032
- Figure 15: South America Medical Sensor Industry Revenue (Million), by Country 2024 & 2032
- Figure 16: South America Medical Sensor Industry Volume (K Unit), by Country 2024 & 2032
- Figure 17: South America Medical Sensor Industry Revenue Share (%), by Country 2024 & 2032
- Figure 18: South America Medical Sensor Industry Volume Share (%), by Country 2024 & 2032
- Figure 19: North America Medical Sensor Industry Revenue (Million), by Country 2024 & 2032
- Figure 20: North America Medical Sensor Industry Volume (K Unit), by Country 2024 & 2032
- Figure 21: North America Medical Sensor Industry Revenue Share (%), by Country 2024 & 2032
- Figure 22: North America Medical Sensor Industry Volume Share (%), by Country 2024 & 2032
- Figure 23: MEA Medical Sensor Industry Revenue (Million), by Country 2024 & 2032
- Figure 24: MEA Medical Sensor Industry Volume (K Unit), by Country 2024 & 2032
- Figure 25: MEA Medical Sensor Industry Revenue Share (%), by Country 2024 & 2032
- Figure 26: MEA Medical Sensor Industry Volume Share (%), by Country 2024 & 2032
- Figure 27: North America Medical Sensor Industry Revenue (Million), by Component 2024 & 2032
- Figure 28: North America Medical Sensor Industry Volume (K Unit), by Component 2024 & 2032
- Figure 29: North America Medical Sensor Industry Revenue Share (%), by Component 2024 & 2032
- Figure 30: North America Medical Sensor Industry Volume Share (%), by Component 2024 & 2032
- Figure 31: North America Medical Sensor Industry Revenue (Million), by Application 2024 & 2032
- Figure 32: North America Medical Sensor Industry Volume (K Unit), by Application 2024 & 2032
- Figure 33: North America Medical Sensor Industry Revenue Share (%), by Application 2024 & 2032
- Figure 34: North America Medical Sensor Industry Volume Share (%), by Application 2024 & 2032
- Figure 35: North America Medical Sensor Industry Revenue (Million), by Country 2024 & 2032
- Figure 36: North America Medical Sensor Industry Volume (K Unit), by Country 2024 & 2032
- Figure 37: North America Medical Sensor Industry Revenue Share (%), by Country 2024 & 2032
- Figure 38: North America Medical Sensor Industry Volume Share (%), by Country 2024 & 2032
- Figure 39: Europe Medical Sensor Industry Revenue (Million), by Component 2024 & 2032
- Figure 40: Europe Medical Sensor Industry Volume (K Unit), by Component 2024 & 2032
- Figure 41: Europe Medical Sensor Industry Revenue Share (%), by Component 2024 & 2032
- Figure 42: Europe Medical Sensor Industry Volume Share (%), by Component 2024 & 2032
- Figure 43: Europe Medical Sensor Industry Revenue (Million), by Application 2024 & 2032
- Figure 44: Europe Medical Sensor Industry Volume (K Unit), by Application 2024 & 2032
- Figure 45: Europe Medical Sensor Industry Revenue Share (%), by Application 2024 & 2032
- Figure 46: Europe Medical Sensor Industry Volume Share (%), by Application 2024 & 2032
- Figure 47: Europe Medical Sensor Industry Revenue (Million), by Country 2024 & 2032
- Figure 48: Europe Medical Sensor Industry Volume (K Unit), by Country 2024 & 2032
- Figure 49: Europe Medical Sensor Industry Revenue Share (%), by Country 2024 & 2032
- Figure 50: Europe Medical Sensor Industry Volume Share (%), by Country 2024 & 2032
- Figure 51: Asia Medical Sensor Industry Revenue (Million), by Component 2024 & 2032
- Figure 52: Asia Medical Sensor Industry Volume (K Unit), by Component 2024 & 2032
- Figure 53: Asia Medical Sensor Industry Revenue Share (%), by Component 2024 & 2032
- Figure 54: Asia Medical Sensor Industry Volume Share (%), by Component 2024 & 2032
- Figure 55: Asia Medical Sensor Industry Revenue (Million), by Application 2024 & 2032
- Figure 56: Asia Medical Sensor Industry Volume (K Unit), by Application 2024 & 2032
- Figure 57: Asia Medical Sensor Industry Revenue Share (%), by Application 2024 & 2032
- Figure 58: Asia Medical Sensor Industry Volume Share (%), by Application 2024 & 2032
- Figure 59: Asia Medical Sensor Industry Revenue (Million), by Country 2024 & 2032
- Figure 60: Asia Medical Sensor Industry Volume (K Unit), by Country 2024 & 2032
- Figure 61: Asia Medical Sensor Industry Revenue Share (%), by Country 2024 & 2032
- Figure 62: Asia Medical Sensor Industry Volume Share (%), by Country 2024 & 2032
- Figure 63: Australia and New Zealand Medical Sensor Industry Revenue (Million), by Component 2024 & 2032
- Figure 64: Australia and New Zealand Medical Sensor Industry Volume (K Unit), by Component 2024 & 2032
- Figure 65: Australia and New Zealand Medical Sensor Industry Revenue Share (%), by Component 2024 & 2032
- Figure 66: Australia and New Zealand Medical Sensor Industry Volume Share (%), by Component 2024 & 2032
- Figure 67: Australia and New Zealand Medical Sensor Industry Revenue (Million), by Application 2024 & 2032
- Figure 68: Australia and New Zealand Medical Sensor Industry Volume (K Unit), by Application 2024 & 2032
- Figure 69: Australia and New Zealand Medical Sensor Industry Revenue Share (%), by Application 2024 & 2032
- Figure 70: Australia and New Zealand Medical Sensor Industry Volume Share (%), by Application 2024 & 2032
- Figure 71: Australia and New Zealand Medical Sensor Industry Revenue (Million), by Country 2024 & 2032
- Figure 72: Australia and New Zealand Medical Sensor Industry Volume (K Unit), by Country 2024 & 2032
- Figure 73: Australia and New Zealand Medical Sensor Industry Revenue Share (%), by Country 2024 & 2032
- Figure 74: Australia and New Zealand Medical Sensor Industry Volume Share (%), by Country 2024 & 2032
- Figure 75: Latin America Medical Sensor Industry Revenue (Million), by Component 2024 & 2032
- Figure 76: Latin America Medical Sensor Industry Volume (K Unit), by Component 2024 & 2032
- Figure 77: Latin America Medical Sensor Industry Revenue Share (%), by Component 2024 & 2032
- Figure 78: Latin America Medical Sensor Industry Volume Share (%), by Component 2024 & 2032
- Figure 79: Latin America Medical Sensor Industry Revenue (Million), by Application 2024 & 2032
- Figure 80: Latin America Medical Sensor Industry Volume (K Unit), by Application 2024 & 2032
- Figure 81: Latin America Medical Sensor Industry Revenue Share (%), by Application 2024 & 2032
- Figure 82: Latin America Medical Sensor Industry Volume Share (%), by Application 2024 & 2032
- Figure 83: Latin America Medical Sensor Industry Revenue (Million), by Country 2024 & 2032
- Figure 84: Latin America Medical Sensor Industry Volume (K Unit), by Country 2024 & 2032
- Figure 85: Latin America Medical Sensor Industry Revenue Share (%), by Country 2024 & 2032
- Figure 86: Latin America Medical Sensor Industry Volume Share (%), by Country 2024 & 2032
- Figure 87: Middle East and Africa Medical Sensor Industry Revenue (Million), by Component 2024 & 2032
- Figure 88: Middle East and Africa Medical Sensor Industry Volume (K Unit), by Component 2024 & 2032
- Figure 89: Middle East and Africa Medical Sensor Industry Revenue Share (%), by Component 2024 & 2032
- Figure 90: Middle East and Africa Medical Sensor Industry Volume Share (%), by Component 2024 & 2032
- Figure 91: Middle East and Africa Medical Sensor Industry Revenue (Million), by Application 2024 & 2032
- Figure 92: Middle East and Africa Medical Sensor Industry Volume (K Unit), by Application 2024 & 2032
- Figure 93: Middle East and Africa Medical Sensor Industry Revenue Share (%), by Application 2024 & 2032
- Figure 94: Middle East and Africa Medical Sensor Industry Volume Share (%), by Application 2024 & 2032
- Figure 95: Middle East and Africa Medical Sensor Industry Revenue (Million), by Country 2024 & 2032
- Figure 96: Middle East and Africa Medical Sensor Industry Volume (K Unit), by Country 2024 & 2032
- Figure 97: Middle East and Africa Medical Sensor Industry Revenue Share (%), by Country 2024 & 2032
- Figure 98: Middle East and Africa Medical Sensor Industry Volume Share (%), by Country 2024 & 2032
List of Tables
- Table 1: Global Medical Sensor Industry Revenue Million Forecast, by Region 2019 & 2032
- Table 2: Global Medical Sensor Industry Volume K Unit Forecast, by Region 2019 & 2032
- Table 3: Global Medical Sensor Industry Revenue Million Forecast, by Component 2019 & 2032
- Table 4: Global Medical Sensor Industry Volume K Unit Forecast, by Component 2019 & 2032
- Table 5: Global Medical Sensor Industry Revenue Million Forecast, by Application 2019 & 2032
- Table 6: Global Medical Sensor Industry Volume K Unit Forecast, by Application 2019 & 2032
- Table 7: Global Medical Sensor Industry Revenue Million Forecast, by Region 2019 & 2032
- Table 8: Global Medical Sensor Industry Volume K Unit Forecast, by Region 2019 & 2032
- Table 9: Global Medical Sensor Industry Revenue Million Forecast, by Country 2019 & 2032
- Table 10: Global Medical Sensor Industry Volume K Unit Forecast, by Country 2019 & 2032
- Table 11: United States Medical Sensor Industry Revenue (Million) Forecast, by Application 2019 & 2032
- Table 12: United States Medical Sensor Industry Volume (K Unit) Forecast, by Application 2019 & 2032
- Table 13: Canada Medical Sensor Industry Revenue (Million) Forecast, by Application 2019 & 2032
- Table 14: Canada Medical Sensor Industry Volume (K Unit) Forecast, by Application 2019 & 2032
- Table 15: Mexico Medical Sensor Industry Revenue (Million) Forecast, by Application 2019 & 2032
- Table 16: Mexico Medical Sensor Industry Volume (K Unit) Forecast, by Application 2019 & 2032
- Table 17: Global Medical Sensor Industry Revenue Million Forecast, by Country 2019 & 2032
- Table 18: Global Medical Sensor Industry Volume K Unit Forecast, by Country 2019 & 2032
- Table 19: Germany Medical Sensor Industry Revenue (Million) Forecast, by Application 2019 & 2032
- Table 20: Germany Medical Sensor Industry Volume (K Unit) Forecast, by Application 2019 & 2032
- Table 21: United Kingdom Medical Sensor Industry Revenue (Million) Forecast, by Application 2019 & 2032
- Table 22: United Kingdom Medical Sensor Industry Volume (K Unit) Forecast, by Application 2019 & 2032
- Table 23: France Medical Sensor Industry Revenue (Million) Forecast, by Application 2019 & 2032
- Table 24: France Medical Sensor Industry Volume (K Unit) Forecast, by Application 2019 & 2032
- Table 25: Spain Medical Sensor Industry Revenue (Million) Forecast, by Application 2019 & 2032
- Table 26: Spain Medical Sensor Industry Volume (K Unit) Forecast, by Application 2019 & 2032
- Table 27: Italy Medical Sensor Industry Revenue (Million) Forecast, by Application 2019 & 2032
- Table 28: Italy Medical Sensor Industry Volume (K Unit) Forecast, by Application 2019 & 2032
- Table 29: Spain Medical Sensor Industry Revenue (Million) Forecast, by Application 2019 & 2032
- Table 30: Spain Medical Sensor Industry Volume (K Unit) Forecast, by Application 2019 & 2032
- Table 31: Belgium Medical Sensor Industry Revenue (Million) Forecast, by Application 2019 & 2032
- Table 32: Belgium Medical Sensor Industry Volume (K Unit) Forecast, by Application 2019 & 2032
- Table 33: Netherland Medical Sensor Industry Revenue (Million) Forecast, by Application 2019 & 2032
- Table 34: Netherland Medical Sensor Industry Volume (K Unit) Forecast, by Application 2019 & 2032
- Table 35: Nordics Medical Sensor Industry Revenue (Million) Forecast, by Application 2019 & 2032
- Table 36: Nordics Medical Sensor Industry Volume (K Unit) Forecast, by Application 2019 & 2032
- Table 37: Rest of Europe Medical Sensor Industry Revenue (Million) Forecast, by Application 2019 & 2032
- Table 38: Rest of Europe Medical Sensor Industry Volume (K Unit) Forecast, by Application 2019 & 2032
- Table 39: Global Medical Sensor Industry Revenue Million Forecast, by Country 2019 & 2032
- Table 40: Global Medical Sensor Industry Volume K Unit Forecast, by Country 2019 & 2032
- Table 41: China Medical Sensor Industry Revenue (Million) Forecast, by Application 2019 & 2032
- Table 42: China Medical Sensor Industry Volume (K Unit) Forecast, by Application 2019 & 2032
- Table 43: Japan Medical Sensor Industry Revenue (Million) Forecast, by Application 2019 & 2032
- Table 44: Japan Medical Sensor Industry Volume (K Unit) Forecast, by Application 2019 & 2032
- Table 45: India Medical Sensor Industry Revenue (Million) Forecast, by Application 2019 & 2032
- Table 46: India Medical Sensor Industry Volume (K Unit) Forecast, by Application 2019 & 2032
- Table 47: South Korea Medical Sensor Industry Revenue (Million) Forecast, by Application 2019 & 2032
- Table 48: South Korea Medical Sensor Industry Volume (K Unit) Forecast, by Application 2019 & 2032
- Table 49: Southeast Asia Medical Sensor Industry Revenue (Million) Forecast, by Application 2019 & 2032
- Table 50: Southeast Asia Medical Sensor Industry Volume (K Unit) Forecast, by Application 2019 & 2032
- Table 51: Australia Medical Sensor Industry Revenue (Million) Forecast, by Application 2019 & 2032
- Table 52: Australia Medical Sensor Industry Volume (K Unit) Forecast, by Application 2019 & 2032
- Table 53: Indonesia Medical Sensor Industry Revenue (Million) Forecast, by Application 2019 & 2032
- Table 54: Indonesia Medical Sensor Industry Volume (K Unit) Forecast, by Application 2019 & 2032
- Table 55: Phillipes Medical Sensor Industry Revenue (Million) Forecast, by Application 2019 & 2032
- Table 56: Phillipes Medical Sensor Industry Volume (K Unit) Forecast, by Application 2019 & 2032
- Table 57: Singapore Medical Sensor Industry Revenue (Million) Forecast, by Application 2019 & 2032
- Table 58: Singapore Medical Sensor Industry Volume (K Unit) Forecast, by Application 2019 & 2032
- Table 59: Thailandc Medical Sensor Industry Revenue (Million) Forecast, by Application 2019 & 2032
- Table 60: Thailandc Medical Sensor Industry Volume (K Unit) Forecast, by Application 2019 & 2032
- Table 61: Rest of Asia Pacific Medical Sensor Industry Revenue (Million) Forecast, by Application 2019 & 2032
- Table 62: Rest of Asia Pacific Medical Sensor Industry Volume (K Unit) Forecast, by Application 2019 & 2032
- Table 63: Global Medical Sensor Industry Revenue Million Forecast, by Country 2019 & 2032
- Table 64: Global Medical Sensor Industry Volume K Unit Forecast, by Country 2019 & 2032
- Table 65: Brazil Medical Sensor Industry Revenue (Million) Forecast, by Application 2019 & 2032
- Table 66: Brazil Medical Sensor Industry Volume (K Unit) Forecast, by Application 2019 & 2032
- Table 67: Argentina Medical Sensor Industry Revenue (Million) Forecast, by Application 2019 & 2032
- Table 68: Argentina Medical Sensor Industry Volume (K Unit) Forecast, by Application 2019 & 2032
- Table 69: Peru Medical Sensor Industry Revenue (Million) Forecast, by Application 2019 & 2032
- Table 70: Peru Medical Sensor Industry Volume (K Unit) Forecast, by Application 2019 & 2032
- Table 71: Chile Medical Sensor Industry Revenue (Million) Forecast, by Application 2019 & 2032
- Table 72: Chile Medical Sensor Industry Volume (K Unit) Forecast, by Application 2019 & 2032
- Table 73: Colombia Medical Sensor Industry Revenue (Million) Forecast, by Application 2019 & 2032
- Table 74: Colombia Medical Sensor Industry Volume (K Unit) Forecast, by Application 2019 & 2032
- Table 75: Ecuador Medical Sensor Industry Revenue (Million) Forecast, by Application 2019 & 2032
- Table 76: Ecuador Medical Sensor Industry Volume (K Unit) Forecast, by Application 2019 & 2032
- Table 77: Venezuela Medical Sensor Industry Revenue (Million) Forecast, by Application 2019 & 2032
- Table 78: Venezuela Medical Sensor Industry Volume (K Unit) Forecast, by Application 2019 & 2032
- Table 79: Rest of South America Medical Sensor Industry Revenue (Million) Forecast, by Application 2019 & 2032
- Table 80: Rest of South America Medical Sensor Industry Volume (K Unit) Forecast, by Application 2019 & 2032
- Table 81: Global Medical Sensor Industry Revenue Million Forecast, by Country 2019 & 2032
- Table 82: Global Medical Sensor Industry Volume K Unit Forecast, by Country 2019 & 2032
- Table 83: United States Medical Sensor Industry Revenue (Million) Forecast, by Application 2019 & 2032
- Table 84: United States Medical Sensor Industry Volume (K Unit) Forecast, by Application 2019 & 2032
- Table 85: Canada Medical Sensor Industry Revenue (Million) Forecast, by Application 2019 & 2032
- Table 86: Canada Medical Sensor Industry Volume (K Unit) Forecast, by Application 2019 & 2032
- Table 87: Mexico Medical Sensor Industry Revenue (Million) Forecast, by Application 2019 & 2032
- Table 88: Mexico Medical Sensor Industry Volume (K Unit) Forecast, by Application 2019 & 2032
- Table 89: Global Medical Sensor Industry Revenue Million Forecast, by Country 2019 & 2032
- Table 90: Global Medical Sensor Industry Volume K Unit Forecast, by Country 2019 & 2032
- Table 91: United Arab Emirates Medical Sensor Industry Revenue (Million) Forecast, by Application 2019 & 2032
- Table 92: United Arab Emirates Medical Sensor Industry Volume (K Unit) Forecast, by Application 2019 & 2032
- Table 93: Saudi Arabia Medical Sensor Industry Revenue (Million) Forecast, by Application 2019 & 2032
- Table 94: Saudi Arabia Medical Sensor Industry Volume (K Unit) Forecast, by Application 2019 & 2032
- Table 95: South Africa Medical Sensor Industry Revenue (Million) Forecast, by Application 2019 & 2032
- Table 96: South Africa Medical Sensor Industry Volume (K Unit) Forecast, by Application 2019 & 2032
- Table 97: Rest of Middle East and Africa Medical Sensor Industry Revenue (Million) Forecast, by Application 2019 & 2032
- Table 98: Rest of Middle East and Africa Medical Sensor Industry Volume (K Unit) Forecast, by Application 2019 & 2032
- Table 99: Global Medical Sensor Industry Revenue Million Forecast, by Component 2019 & 2032
- Table 100: Global Medical Sensor Industry Volume K Unit Forecast, by Component 2019 & 2032
- Table 101: Global Medical Sensor Industry Revenue Million Forecast, by Application 2019 & 2032
- Table 102: Global Medical Sensor Industry Volume K Unit Forecast, by Application 2019 & 2032
- Table 103: Global Medical Sensor Industry Revenue Million Forecast, by Country 2019 & 2032
- Table 104: Global Medical Sensor Industry Volume K Unit Forecast, by Country 2019 & 2032
- Table 105: Global Medical Sensor Industry Revenue Million Forecast, by Component 2019 & 2032
- Table 106: Global Medical Sensor Industry Volume K Unit Forecast, by Component 2019 & 2032
- Table 107: Global Medical Sensor Industry Revenue Million Forecast, by Application 2019 & 2032
- Table 108: Global Medical Sensor Industry Volume K Unit Forecast, by Application 2019 & 2032
- Table 109: Global Medical Sensor Industry Revenue Million Forecast, by Country 2019 & 2032
- Table 110: Global Medical Sensor Industry Volume K Unit Forecast, by Country 2019 & 2032
- Table 111: Global Medical Sensor Industry Revenue Million Forecast, by Component 2019 & 2032
- Table 112: Global Medical Sensor Industry Volume K Unit Forecast, by Component 2019 & 2032
- Table 113: Global Medical Sensor Industry Revenue Million Forecast, by Application 2019 & 2032
- Table 114: Global Medical Sensor Industry Volume K Unit Forecast, by Application 2019 & 2032
- Table 115: Global Medical Sensor Industry Revenue Million Forecast, by Country 2019 & 2032
- Table 116: Global Medical Sensor Industry Volume K Unit Forecast, by Country 2019 & 2032
- Table 117: Global Medical Sensor Industry Revenue Million Forecast, by Component 2019 & 2032
- Table 118: Global Medical Sensor Industry Volume K Unit Forecast, by Component 2019 & 2032
- Table 119: Global Medical Sensor Industry Revenue Million Forecast, by Application 2019 & 2032
- Table 120: Global Medical Sensor Industry Volume K Unit Forecast, by Application 2019 & 2032
- Table 121: Global Medical Sensor Industry Revenue Million Forecast, by Country 2019 & 2032
- Table 122: Global Medical Sensor Industry Volume K Unit Forecast, by Country 2019 & 2032
- Table 123: Global Medical Sensor Industry Revenue Million Forecast, by Component 2019 & 2032
- Table 124: Global Medical Sensor Industry Volume K Unit Forecast, by Component 2019 & 2032
- Table 125: Global Medical Sensor Industry Revenue Million Forecast, by Application 2019 & 2032
- Table 126: Global Medical Sensor Industry Volume K Unit Forecast, by Application 2019 & 2032
- Table 127: Global Medical Sensor Industry Revenue Million Forecast, by Country 2019 & 2032
- Table 128: Global Medical Sensor Industry Volume K Unit Forecast, by Country 2019 & 2032
- Table 129: Global Medical Sensor Industry Revenue Million Forecast, by Component 2019 & 2032
- Table 130: Global Medical Sensor Industry Volume K Unit Forecast, by Component 2019 & 2032
- Table 131: Global Medical Sensor Industry Revenue Million Forecast, by Application 2019 & 2032
- Table 132: Global Medical Sensor Industry Volume K Unit Forecast, by Application 2019 & 2032
- Table 133: Global Medical Sensor Industry Revenue Million Forecast, by Country 2019 & 2032
- Table 134: Global Medical Sensor Industry Volume K Unit Forecast, by Country 2019 & 2032
Frequently Asked Questions
1. What is the projected Compound Annual Growth Rate (CAGR) of the Medical Sensor Industry?
The projected CAGR is approximately 10.24%.
2. Which companies are prominent players in the Medical Sensor Industry?
Key companies in the market include Servoflo Corporation, Honeywell International Inc, TE Connectivity Ltd (First Sensors AG), Sensirion Holding AG, Amphenol Advanced Sensors (Amphenol Corporation), Siemens AG, Omron Corporation, STMicroelectronics NV, NXP Semiconductors (Freescale Semiconductor), GE Healthcare Inc.
3. What are the main segments of the Medical Sensor Industry?
The market segments include Component, Application.
4. Can you provide details about the market size?
The market size is estimated to be USD 7.76 Million as of 2022.
5. What are some drivers contributing to market growth?
Miniaturization of Sensors Leading to Ease in Integration; Increasing Advancement in Medical Devices and Accessories.
6. What are the notable trends driving market growth?
Pressure Sensors Play a Significant Role in the Medical Sensor Market.
7. Are there any restraints impacting market growth?
Lack of Proper IoT Technology Skills across Healthcare Organizations; High Deployment Cost of Necessary Infrastructure and Connected Medical Devices.
8. Can you provide examples of recent developments in the market?
August 2022 - Sibel Health announced raising USD 33 million in its Series B financing round. The funding aims to scale wearable sensors for remote monitoring in the hospital.
9. What pricing options are available for accessing the report?
Pricing options include single-user, multi-user, and enterprise licenses priced at USD 4750, USD 5250, and USD 8750 respectively.
10. Is the market size provided in terms of value or volume?
The market size is provided in terms of value, measured in Million and volume, measured in K Unit.
11. Are there any specific market keywords associated with the report?
Yes, the market keyword associated with the report is "Medical Sensor Industry," which aids in identifying and referencing the specific market segment covered.
12. How do I determine which pricing option suits my needs best?
The pricing options vary based on user requirements and access needs. Individual users may opt for single-user licenses, while businesses requiring broader access may choose multi-user or enterprise licenses for cost-effective access to the report.
13. Are there any additional resources or data provided in the Medical Sensor Industry report?
While the report offers comprehensive insights, it's advisable to review the specific contents or supplementary materials provided to ascertain if additional resources or data are available.
14. How can I stay updated on further developments or reports in the Medical Sensor Industry?
To stay informed about further developments, trends, and reports in the Medical Sensor Industry, consider subscribing to industry newsletters, following relevant companies and organizations, or regularly checking reputable industry news sources and publications.
Methodology
Step 1 - Identification of Relevant Samples Size from Population Database


Step 2 - Approaches for Defining Global Market Size (Value, Volume* & Price*)

Note*: In applicable scenarios
Step 3 - Data Sources
Primary Research
- Web Analytics
- Survey Reports
- Research Institute
- Latest Research Reports
- Opinion Leaders
Secondary Research
- Annual Reports
- White Paper
- Latest Press Release
- Industry Association
- Paid Database
- Investor Presentations

Step 4 - Data Triangulation
Involves using different sources of information in order to increase the validity of a study
These sources are likely to be stakeholders in a program - participants, other researchers, program staff, other community members, and so on.
Then we put all data in single framework & apply various statistical tools to find out the dynamic on the market.
During the analysis stage, feedback from the stakeholder groups would be compared to determine areas of agreement as well as areas of divergence


