
Key Insights
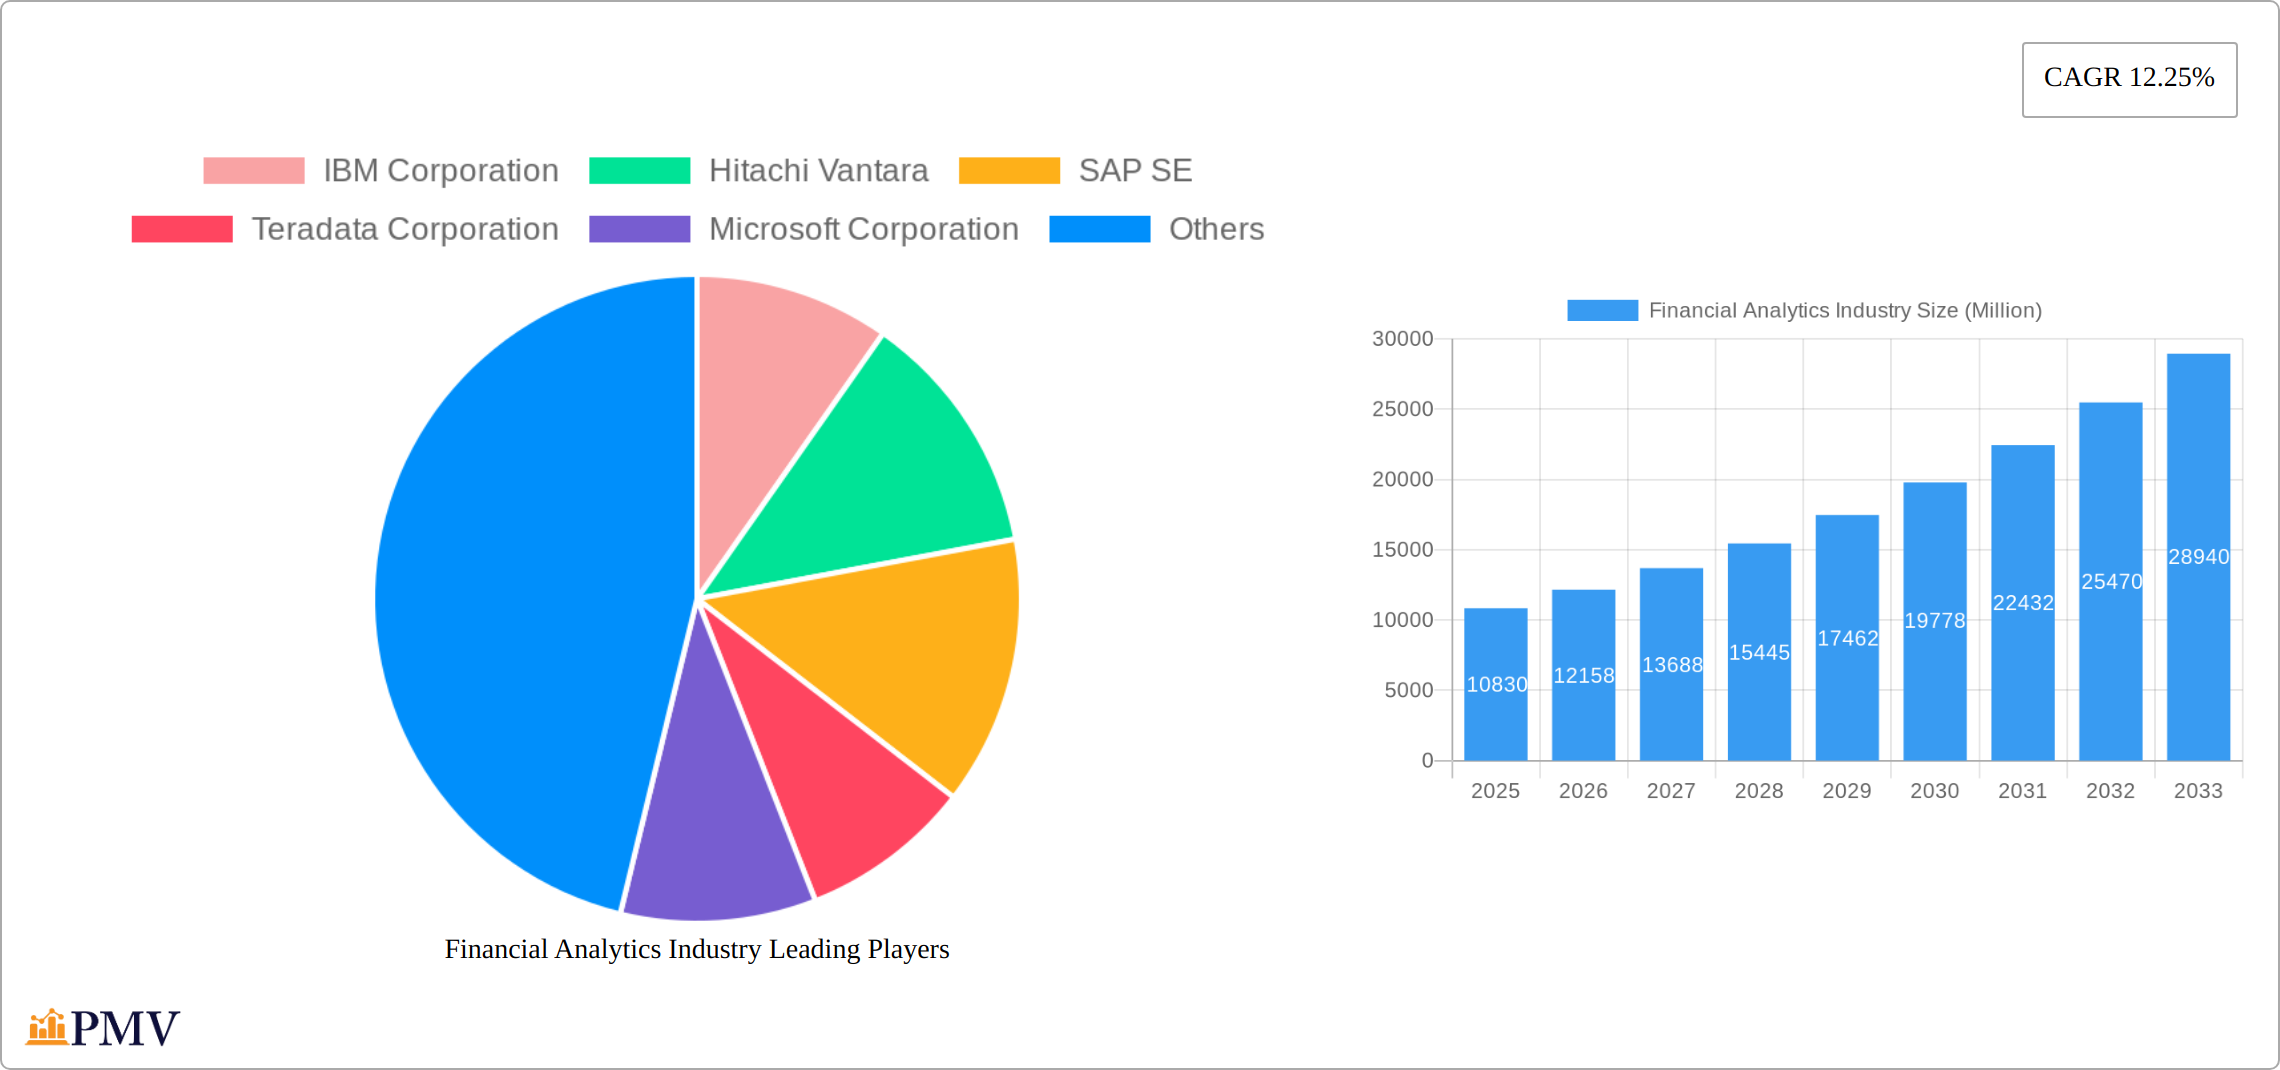
The global financial analytics market, valued at $10.83 billion in 2025, is poised for robust growth, exhibiting a Compound Annual Growth Rate (CAGR) of 12.25% from 2025 to 2033. This expansion is driven by several key factors. Increased regulatory scrutiny and the need for compliance necessitate sophisticated analytics solutions for risk management and fraud detection. Furthermore, the burgeoning adoption of cloud-based solutions offers scalability, cost-effectiveness, and accessibility, fueling market growth. The demand for advanced analytics capabilities, such as predictive modeling and machine learning, to enhance decision-making and improve operational efficiency across various sectors is also a significant driver. Finally, the increasing volume and complexity of financial data require powerful analytical tools capable of processing and interpreting this information effectively. Segmentation reveals strong growth across deployment types (cloud solutions experiencing faster adoption than on-premise), solution types (database management and planning seeing higher demand initially, followed by growth in analysis and reporting), and end-user verticals (BFSI consistently holding a dominant market share, with healthcare and manufacturing sectors showing significant potential).
The market's growth trajectory is expected to be influenced by several trends. The rising adoption of artificial intelligence (AI) and machine learning (ML) is revolutionizing financial analytics, leading to more accurate predictions and improved decision support systems. The integration of big data technologies enhances analytical capabilities, facilitating the processing of larger datasets for more comprehensive insights. However, challenges remain. Data security and privacy concerns continue to be significant restraints, demanding robust security measures. The complexity of implementing and integrating advanced analytics solutions can also pose a barrier to entry for some organizations. Competition among established players like IBM, Hitachi Vantara, SAP, Teradata, Microsoft, SAS Institute, Oracle, and FICO is intensifying, driving innovation and potentially leading to price pressures. The geographical distribution of the market reveals North America as a key market initially, followed by a rise in Asia-Pacific's share due to increasing digitalization and technological advancements.
Financial Analytics Industry Market Report: 2019-2033
This comprehensive report provides a detailed analysis of the Financial Analytics Industry, offering invaluable insights for businesses, investors, and industry professionals. The report covers the period 2019-2033, with a base year of 2025 and a forecast period of 2025-2033. The market is valued at xx Million in 2025 and is projected to reach xx Million by 2033, exhibiting a CAGR of xx%.
Financial Analytics Industry Market Structure & Competitive Dynamics
The Financial Analytics Industry is characterized by a moderately concentrated market structure, with key players like IBM Corporation, Hitachi Vantara, SAP SE, Teradata Corporation, Microsoft Corporation, SAS Institute, Oracle Corporation, and FICO holding significant market share. Market concentration is influenced by factors such as technological advancements, regulatory compliance requirements, and the increasing demand for sophisticated analytics solutions. The industry witnesses continuous innovation, with companies investing heavily in R&D to develop advanced analytics platforms and AI-powered solutions. The regulatory landscape, particularly concerning data privacy and security, plays a crucial role in shaping market dynamics. Product substitutes, including open-source analytics tools and cloud-based solutions, present competitive challenges. End-user trends, particularly the growing adoption of cloud-based solutions and the increasing demand for real-time analytics, are driving market growth. Mergers and acquisitions (M&A) are frequent, with deal values reaching hundreds of Millions, reflecting the industry's consolidation and expansion. For example, in 2024, a significant M&A deal involving two major players resulted in a combined market share of xx%, significantly impacting the competitive landscape.
- Market Share: IBM Corporation holds an estimated xx% market share, followed by SAP SE at xx%, and Microsoft Corporation at xx%.
- M&A Activity: Total M&A deal value in 2024 was estimated at xx Million. Deal sizes vary significantly, ranging from small acquisitions of specialized technology companies to large-scale mergers of established players.
Financial Analytics Industry Industry Trends & Insights
The Financial Analytics Industry is undergoing a period of exceptional growth, propelled by a confluence of transformative forces. The widespread adoption of cloud-based solutions continues to be a primary catalyst, offering unparalleled scalability, cost efficiencies, and enhanced accessibility to sophisticated analytical tools. Concurrently, rapid advancements in Artificial Intelligence (AI), Machine Learning (ML), and big data analytics are fundamentally reshaping the industry's capabilities. These technologies are enabling organizations to derive deeper, more nuanced insights and develop highly accurate predictive models. Consumer demand is also a significant driver, with a pronounced shift towards personalized experiences and a reliance on data-driven decision-making, consequently increasing the demand for advanced analytics solutions. The competitive landscape remains dynamic, characterized by a strong emphasis on innovation, strategic collaborations, and mergers and acquisitions as companies vie for market leadership. Furthermore, increasingly stringent regulatory compliance requirements are necessitating the development and implementation of robust analytics solutions for comprehensive risk management and proactive fraud detection. The market penetration of cloud-based analytics solutions is projected to reach an impressive [XX]% in 2024, underscoring its rapid integration. The sector is witnessing a substantial Compound Annual Growth Rate (CAGR) of [XX]% for the 2019-2024 period, a testament to its vigorous expansion. This upward trajectory is anticipated to persist, fueled by ongoing digital transformation initiatives across diverse industries. The emergence of open finance, exemplified by the recent groundbreaking launch of Dobin, further highlights the pervasive integration of financial data analytics to foster enhanced customer experiences and drive strategic business intelligence.
Dominant Markets & Segments in Financial Analytics Industry
The BFSI (Banking, Financial Services, and Insurance) sector represents the dominant end-user vertical, accounting for xx% of the market share in 2024. This is largely due to the stringent regulatory requirements and the need for risk management and fraud detection solutions. The Cloud deployment type dominates, capturing xx% of the market share, driven by its scalability, accessibility, and cost-effectiveness. Within Solution Types, Analysis and Reporting is the leading segment, representing xx% of the market, fueled by the increasing demand for real-time insights and data visualization.
- Key Drivers for BFSI Dominance:
- Stringent regulatory compliance requirements.
- Need for robust risk management and fraud detection solutions.
- Growing adoption of digital banking and financial services.
- Key Drivers for Cloud Dominance:
- Scalability and flexibility.
- Cost-effectiveness compared to on-premise solutions.
- Enhanced accessibility and collaboration.
- Key Drivers for Analysis and Reporting Dominance:
- Growing demand for real-time insights and data visualization.
- Need for data-driven decision-making across various business functions.
Financial Analytics Industry Product Innovations
Recent product innovations focus on AI-powered solutions, advanced data visualization tools, and cloud-native platforms. These innovations offer improved accuracy, speed, and scalability, catering to the increasing demand for real-time insights and predictive analytics. The integration of AI and ML enhances automated decision-making and fraud detection capabilities. Cloud-native platforms provide seamless integration with existing enterprise systems and scalability to handle massive datasets. These advancements provide significant competitive advantages, enabling companies to offer superior analytics solutions to meet the evolving needs of their clients.
Report Segmentation & Scope
This report segments the Financial Analytics Industry by Deployment Type (On-premise, Cloud), Solution Type (Database Management and Planning, Analysis and Reporting, Other Type), and End-user Vertical (BFSI, Healthcare, Manufacturing, Government, IT and Telecom, Other End-user Verticals). Each segment’s growth projection, market size, and competitive dynamics are analyzed in detail. For instance, the cloud segment is projected to experience the highest growth rate due to its inherent flexibility and scalability advantages. Within solution types, the analysis and reporting segment is expected to maintain a dominant position owing to the growing demand for real-time insights. The BFSI vertical will continue to lead in terms of market size due to the sector’s stringent regulatory needs and increased reliance on data analytics for decision making.
Key Drivers of Financial Analytics Industry Growth
The burgeoning growth of the Financial Analytics Industry is underpinned by a multifaceted set of drivers. A primary contributor is the ever-increasing volume and variety of data generated by businesses, demanding sophisticated tools for interpretation. The imperative for real-time insights to inform agile and improved decision-making is also a critical factor. Furthermore, stringent regulatory mandates emphasizing enhanced data security and comprehensive compliance are propelling the adoption of advanced analytics. Continuous technological advancements, particularly in the realms of AI and cloud computing, are democratizing access to and fostering the adoption of cutting-edge analytics solutions. Supportive government initiatives aimed at promoting data-driven decision-making further stimulate market expansion. The growing consumer preference for personalized experiences and data-informed customer service strategies is creating a robust demand for specialized financial analytics solutions.
Challenges in the Financial Analytics Industry Sector
Despite its robust growth, the Financial Analytics Industry navigates several significant challenges. The high cost associated with implementing and maintaining advanced analytics solutions presents a considerable barrier for some organizations. The persistent shortage of skilled data scientists and analysts capable of extracting meaningful insights from complex datasets remains a critical bottleneck. The intricate nature of integrating diverse and often disparate data sources adds another layer of complexity. Paramount concerns surrounding data security and privacy necessitate the establishment of rigorous data governance frameworks and robust security protocols, posing ongoing hurdles. Competition from versatile open-source tools and agile cloud-based solutions continues to present an evolving challenge for established vendors. Moreover, the escalating complexity and evolving landscape of regulations pertaining to data privacy can impose substantial compliance costs on businesses. While these challenges can impact market dynamics, they are generally not considered impediments to the industry's overall upward trajectory.
Leading Players in the Financial Analytics Industry Market
- IBM Corporation
- Hitachi Vantara
- SAP SE
- Teradata Corporation
- Microsoft Corporation
- SAS Institute
- Oracle Corporation
- FICO
Key Developments in Financial Analytics Industry Sector
- July 2023: Dobin, an innovative AI-powered FinTech solution, made its debut in Southeast Asia. This launch prominently features the synergistic application of open finance principles and advanced data analytics, underscoring the accelerating integration of AI and open finance paradigms within the financial analytics sector.
- Ongoing: Continuous advancements in explainable AI (XAI) are enhancing transparency and trust in AI-driven financial models, making them more accessible and reliable for a wider range of applications.
- Emerging Trend: The increasing focus on ethical AI and responsible data usage is shaping the development of new analytics frameworks and governance structures within the industry.
Strategic Financial Analytics Industry Market Outlook
The Financial Analytics Industry is poised for an era of immense future potential, driven by the relentless pace of technological innovation and the escalating demand for data-driven insights across a multitude of sectors. Strategic opportunities abound in the development of sophisticated AI-powered solutions, the strategic leveraging of cloud computing infrastructure, and a focused approach on identifying and serving lucrative niche market segments. Organizations that demonstrate adeptness in navigating the complexities of data security, proactively addressing regulatory compliance, and effectively acquiring and retaining top-tier talent will be exceptionally well-positioned for substantial growth in the ensuing years. The market is forecasted to experience sustained and strong growth, presenting abundant avenues for groundbreaking innovation and strategic expansion.
Financial Analytics Industry Segmentation
-
1. Deployment Type
- 1.1. On-premise
- 1.2. Cloud
-
2. Solution Type
- 2.1. Database Management and Planning
- 2.2. Analysis and Reporting
- 2.3. Other Type
-
3. End-user Vertical
- 3.1. BFSI
- 3.2. Healthcare
- 3.3. Manufacturing
- 3.4. Government
- 3.5. IT and Telecom
- 3.6. Other End-user Verticals
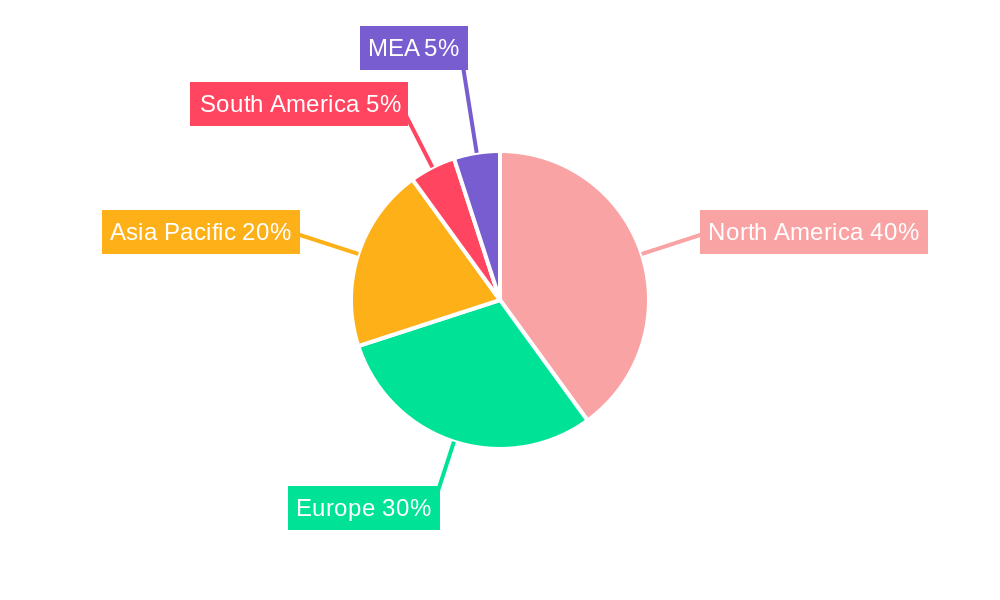
Financial Analytics Industry Segmentation By Geography
-
1. North America
- 1.1. United States
- 1.2. Canada
-
2. Europe
- 2.1. United Kingdom
- 2.2. Germany
- 2.3. France
- 2.4. Rest of Europe
-
3. Asia Pacific
- 3.1. China
- 3.2. Japan
- 3.3. Singapore
- 3.4. India
- 3.5. South Korea
- 3.6. Rest of Asia Pacific
-
4. Latin America
- 4.1. Mexico
- 4.2. Brazil
- 4.3. Rest of Latin America
-
5. Middle East and Africa
- 5.1. United Arab Emirates
- 5.2. South Africa
- 5.3. Rest of Middle East and Africa
Financial Analytics Industry REPORT HIGHLIGHTS
| Aspects | Details |
|---|---|
| Study Period | 2019-2033 |
| Base Year | 2024 |
| Estimated Year | 2025 |
| Forecast Period | 2025-2033 |
| Historical Period | 2019-2024 |
| Growth Rate | CAGR of 12.25% from 2019-2033 |
| Segmentation |
|
Table of Contents
- 1. Introduction
- 1.1. Research Scope
- 1.2. Market Segmentation
- 1.3. Research Methodology
- 1.4. Definitions and Assumptions
- 2. Executive Summary
- 2.1. Introduction
- 3. Market Dynamics
- 3.1. Introduction
- 3.2. Market Drivers
- 3.2.1. Advancement in BI and Business Analytics Tools; Growing Focus on Data Driven Financial Decisions in End Users
- 3.3. Market Restrains
- 3.3.1. Lack of Awareness Regarding Fraud Detection Solutions
- 3.4. Market Trends
- 3.4.1. Cloud Based Solutions are Expected to Gain Significant Traction
- 4. Market Factor Analysis
- 4.1. Porters Five Forces
- 4.2. Supply/Value Chain
- 4.3. PESTEL analysis
- 4.4. Market Entropy
- 4.5. Patent/Trademark Analysis
- 5. Global Financial Analytics Industry Analysis, Insights and Forecast, 2019-2031
- 5.1. Market Analysis, Insights and Forecast - by Deployment Type
- 5.1.1. On-premise
- 5.1.2. Cloud
- 5.2. Market Analysis, Insights and Forecast - by Solution Type
- 5.2.1. Database Management and Planning
- 5.2.2. Analysis and Reporting
- 5.2.3. Other Type
- 5.3. Market Analysis, Insights and Forecast - by End-user Vertical
- 5.3.1. BFSI
- 5.3.2. Healthcare
- 5.3.3. Manufacturing
- 5.3.4. Government
- 5.3.5. IT and Telecom
- 5.3.6. Other End-user Verticals
- 5.4. Market Analysis, Insights and Forecast - by Region
- 5.4.1. North America
- 5.4.2. Europe
- 5.4.3. Asia Pacific
- 5.4.4. Latin America
- 5.4.5. Middle East and Africa
- 5.1. Market Analysis, Insights and Forecast - by Deployment Type
- 6. North America Financial Analytics Industry Analysis, Insights and Forecast, 2019-2031
- 6.1. Market Analysis, Insights and Forecast - by Deployment Type
- 6.1.1. On-premise
- 6.1.2. Cloud
- 6.2. Market Analysis, Insights and Forecast - by Solution Type
- 6.2.1. Database Management and Planning
- 6.2.2. Analysis and Reporting
- 6.2.3. Other Type
- 6.3. Market Analysis, Insights and Forecast - by End-user Vertical
- 6.3.1. BFSI
- 6.3.2. Healthcare
- 6.3.3. Manufacturing
- 6.3.4. Government
- 6.3.5. IT and Telecom
- 6.3.6. Other End-user Verticals
- 6.1. Market Analysis, Insights and Forecast - by Deployment Type
- 7. Europe Financial Analytics Industry Analysis, Insights and Forecast, 2019-2031
- 7.1. Market Analysis, Insights and Forecast - by Deployment Type
- 7.1.1. On-premise
- 7.1.2. Cloud
- 7.2. Market Analysis, Insights and Forecast - by Solution Type
- 7.2.1. Database Management and Planning
- 7.2.2. Analysis and Reporting
- 7.2.3. Other Type
- 7.3. Market Analysis, Insights and Forecast - by End-user Vertical
- 7.3.1. BFSI
- 7.3.2. Healthcare
- 7.3.3. Manufacturing
- 7.3.4. Government
- 7.3.5. IT and Telecom
- 7.3.6. Other End-user Verticals
- 7.1. Market Analysis, Insights and Forecast - by Deployment Type
- 8. Asia Pacific Financial Analytics Industry Analysis, Insights and Forecast, 2019-2031
- 8.1. Market Analysis, Insights and Forecast - by Deployment Type
- 8.1.1. On-premise
- 8.1.2. Cloud
- 8.2. Market Analysis, Insights and Forecast - by Solution Type
- 8.2.1. Database Management and Planning
- 8.2.2. Analysis and Reporting
- 8.2.3. Other Type
- 8.3. Market Analysis, Insights and Forecast - by End-user Vertical
- 8.3.1. BFSI
- 8.3.2. Healthcare
- 8.3.3. Manufacturing
- 8.3.4. Government
- 8.3.5. IT and Telecom
- 8.3.6. Other End-user Verticals
- 8.1. Market Analysis, Insights and Forecast - by Deployment Type
- 9. Latin America Financial Analytics Industry Analysis, Insights and Forecast, 2019-2031
- 9.1. Market Analysis, Insights and Forecast - by Deployment Type
- 9.1.1. On-premise
- 9.1.2. Cloud
- 9.2. Market Analysis, Insights and Forecast - by Solution Type
- 9.2.1. Database Management and Planning
- 9.2.2. Analysis and Reporting
- 9.2.3. Other Type
- 9.3. Market Analysis, Insights and Forecast - by End-user Vertical
- 9.3.1. BFSI
- 9.3.2. Healthcare
- 9.3.3. Manufacturing
- 9.3.4. Government
- 9.3.5. IT and Telecom
- 9.3.6. Other End-user Verticals
- 9.1. Market Analysis, Insights and Forecast - by Deployment Type
- 10. Middle East and Africa Financial Analytics Industry Analysis, Insights and Forecast, 2019-2031
- 10.1. Market Analysis, Insights and Forecast - by Deployment Type
- 10.1.1. On-premise
- 10.1.2. Cloud
- 10.2. Market Analysis, Insights and Forecast - by Solution Type
- 10.2.1. Database Management and Planning
- 10.2.2. Analysis and Reporting
- 10.2.3. Other Type
- 10.3. Market Analysis, Insights and Forecast - by End-user Vertical
- 10.3.1. BFSI
- 10.3.2. Healthcare
- 10.3.3. Manufacturing
- 10.3.4. Government
- 10.3.5. IT and Telecom
- 10.3.6. Other End-user Verticals
- 10.1. Market Analysis, Insights and Forecast - by Deployment Type
- 11. North America Financial Analytics Industry Analysis, Insights and Forecast, 2019-2031
- 11.1. Market Analysis, Insights and Forecast - By Country/Sub-region
- 11.1.1 United States
- 11.1.2 Canada
- 11.1.3 Mexico
- 12. Europe Financial Analytics Industry Analysis, Insights and Forecast, 2019-2031
- 12.1. Market Analysis, Insights and Forecast - By Country/Sub-region
- 12.1.1 Germany
- 12.1.2 United Kingdom
- 12.1.3 France
- 12.1.4 Spain
- 12.1.5 Italy
- 12.1.6 Spain
- 12.1.7 Belgium
- 12.1.8 Netherland
- 12.1.9 Nordics
- 12.1.10 Rest of Europe
- 13. Asia Pacific Financial Analytics Industry Analysis, Insights and Forecast, 2019-2031
- 13.1. Market Analysis, Insights and Forecast - By Country/Sub-region
- 13.1.1 China
- 13.1.2 Japan
- 13.1.3 India
- 13.1.4 South Korea
- 13.1.5 Southeast Asia
- 13.1.6 Australia
- 13.1.7 Indonesia
- 13.1.8 Phillipes
- 13.1.9 Singapore
- 13.1.10 Thailandc
- 13.1.11 Rest of Asia Pacific
- 14. South America Financial Analytics Industry Analysis, Insights and Forecast, 2019-2031
- 14.1. Market Analysis, Insights and Forecast - By Country/Sub-region
- 14.1.1 Brazil
- 14.1.2 Argentina
- 14.1.3 Peru
- 14.1.4 Chile
- 14.1.5 Colombia
- 14.1.6 Ecuador
- 14.1.7 Venezuela
- 14.1.8 Rest of South America
- 15. North America Financial Analytics Industry Analysis, Insights and Forecast, 2019-2031
- 15.1. Market Analysis, Insights and Forecast - By Country/Sub-region
- 15.1.1 United States
- 15.1.2 Canada
- 15.1.3 Mexico
- 16. MEA Financial Analytics Industry Analysis, Insights and Forecast, 2019-2031
- 16.1. Market Analysis, Insights and Forecast - By Country/Sub-region
- 16.1.1 United Arab Emirates
- 16.1.2 Saudi Arabia
- 16.1.3 South Africa
- 16.1.4 Rest of Middle East and Africa
- 17. Competitive Analysis
- 17.1. Global Market Share Analysis 2024
- 17.2. Company Profiles
- 17.2.1 IBM Corporation
- 17.2.1.1. Overview
- 17.2.1.2. Products
- 17.2.1.3. SWOT Analysis
- 17.2.1.4. Recent Developments
- 17.2.1.5. Financials (Based on Availability)
- 17.2.2 Hitachi Vantara
- 17.2.2.1. Overview
- 17.2.2.2. Products
- 17.2.2.3. SWOT Analysis
- 17.2.2.4. Recent Developments
- 17.2.2.5. Financials (Based on Availability)
- 17.2.3 SAP SE
- 17.2.3.1. Overview
- 17.2.3.2. Products
- 17.2.3.3. SWOT Analysis
- 17.2.3.4. Recent Developments
- 17.2.3.5. Financials (Based on Availability)
- 17.2.4 Teradata Corporation
- 17.2.4.1. Overview
- 17.2.4.2. Products
- 17.2.4.3. SWOT Analysis
- 17.2.4.4. Recent Developments
- 17.2.4.5. Financials (Based on Availability)
- 17.2.5 Microsoft Corporation
- 17.2.5.1. Overview
- 17.2.5.2. Products
- 17.2.5.3. SWOT Analysis
- 17.2.5.4. Recent Developments
- 17.2.5.5. Financials (Based on Availability)
- 17.2.6 SAS Institute
- 17.2.6.1. Overview
- 17.2.6.2. Products
- 17.2.6.3. SWOT Analysis
- 17.2.6.4. Recent Developments
- 17.2.6.5. Financials (Based on Availability)
- 17.2.7 Oracle Corporation
- 17.2.7.1. Overview
- 17.2.7.2. Products
- 17.2.7.3. SWOT Analysis
- 17.2.7.4. Recent Developments
- 17.2.7.5. Financials (Based on Availability)
- 17.2.8 FICO
- 17.2.8.1. Overview
- 17.2.8.2. Products
- 17.2.8.3. SWOT Analysis
- 17.2.8.4. Recent Developments
- 17.2.8.5. Financials (Based on Availability)
- 17.2.1 IBM Corporation
List of Figures
- Figure 1: Global Financial Analytics Industry Revenue Breakdown (Million, %) by Region 2024 & 2032
- Figure 2: North America Financial Analytics Industry Revenue (Million), by Country 2024 & 2032
- Figure 3: North America Financial Analytics Industry Revenue Share (%), by Country 2024 & 2032
- Figure 4: Europe Financial Analytics Industry Revenue (Million), by Country 2024 & 2032
- Figure 5: Europe Financial Analytics Industry Revenue Share (%), by Country 2024 & 2032
- Figure 6: Asia Pacific Financial Analytics Industry Revenue (Million), by Country 2024 & 2032
- Figure 7: Asia Pacific Financial Analytics Industry Revenue Share (%), by Country 2024 & 2032
- Figure 8: South America Financial Analytics Industry Revenue (Million), by Country 2024 & 2032
- Figure 9: South America Financial Analytics Industry Revenue Share (%), by Country 2024 & 2032
- Figure 10: North America Financial Analytics Industry Revenue (Million), by Country 2024 & 2032
- Figure 11: North America Financial Analytics Industry Revenue Share (%), by Country 2024 & 2032
- Figure 12: MEA Financial Analytics Industry Revenue (Million), by Country 2024 & 2032
- Figure 13: MEA Financial Analytics Industry Revenue Share (%), by Country 2024 & 2032
- Figure 14: North America Financial Analytics Industry Revenue (Million), by Deployment Type 2024 & 2032
- Figure 15: North America Financial Analytics Industry Revenue Share (%), by Deployment Type 2024 & 2032
- Figure 16: North America Financial Analytics Industry Revenue (Million), by Solution Type 2024 & 2032
- Figure 17: North America Financial Analytics Industry Revenue Share (%), by Solution Type 2024 & 2032
- Figure 18: North America Financial Analytics Industry Revenue (Million), by End-user Vertical 2024 & 2032
- Figure 19: North America Financial Analytics Industry Revenue Share (%), by End-user Vertical 2024 & 2032
- Figure 20: North America Financial Analytics Industry Revenue (Million), by Country 2024 & 2032
- Figure 21: North America Financial Analytics Industry Revenue Share (%), by Country 2024 & 2032
- Figure 22: Europe Financial Analytics Industry Revenue (Million), by Deployment Type 2024 & 2032
- Figure 23: Europe Financial Analytics Industry Revenue Share (%), by Deployment Type 2024 & 2032
- Figure 24: Europe Financial Analytics Industry Revenue (Million), by Solution Type 2024 & 2032
- Figure 25: Europe Financial Analytics Industry Revenue Share (%), by Solution Type 2024 & 2032
- Figure 26: Europe Financial Analytics Industry Revenue (Million), by End-user Vertical 2024 & 2032
- Figure 27: Europe Financial Analytics Industry Revenue Share (%), by End-user Vertical 2024 & 2032
- Figure 28: Europe Financial Analytics Industry Revenue (Million), by Country 2024 & 2032
- Figure 29: Europe Financial Analytics Industry Revenue Share (%), by Country 2024 & 2032
- Figure 30: Asia Pacific Financial Analytics Industry Revenue (Million), by Deployment Type 2024 & 2032
- Figure 31: Asia Pacific Financial Analytics Industry Revenue Share (%), by Deployment Type 2024 & 2032
- Figure 32: Asia Pacific Financial Analytics Industry Revenue (Million), by Solution Type 2024 & 2032
- Figure 33: Asia Pacific Financial Analytics Industry Revenue Share (%), by Solution Type 2024 & 2032
- Figure 34: Asia Pacific Financial Analytics Industry Revenue (Million), by End-user Vertical 2024 & 2032
- Figure 35: Asia Pacific Financial Analytics Industry Revenue Share (%), by End-user Vertical 2024 & 2032
- Figure 36: Asia Pacific Financial Analytics Industry Revenue (Million), by Country 2024 & 2032
- Figure 37: Asia Pacific Financial Analytics Industry Revenue Share (%), by Country 2024 & 2032
- Figure 38: Latin America Financial Analytics Industry Revenue (Million), by Deployment Type 2024 & 2032
- Figure 39: Latin America Financial Analytics Industry Revenue Share (%), by Deployment Type 2024 & 2032
- Figure 40: Latin America Financial Analytics Industry Revenue (Million), by Solution Type 2024 & 2032
- Figure 41: Latin America Financial Analytics Industry Revenue Share (%), by Solution Type 2024 & 2032
- Figure 42: Latin America Financial Analytics Industry Revenue (Million), by End-user Vertical 2024 & 2032
- Figure 43: Latin America Financial Analytics Industry Revenue Share (%), by End-user Vertical 2024 & 2032
- Figure 44: Latin America Financial Analytics Industry Revenue (Million), by Country 2024 & 2032
- Figure 45: Latin America Financial Analytics Industry Revenue Share (%), by Country 2024 & 2032
- Figure 46: Middle East and Africa Financial Analytics Industry Revenue (Million), by Deployment Type 2024 & 2032
- Figure 47: Middle East and Africa Financial Analytics Industry Revenue Share (%), by Deployment Type 2024 & 2032
- Figure 48: Middle East and Africa Financial Analytics Industry Revenue (Million), by Solution Type 2024 & 2032
- Figure 49: Middle East and Africa Financial Analytics Industry Revenue Share (%), by Solution Type 2024 & 2032
- Figure 50: Middle East and Africa Financial Analytics Industry Revenue (Million), by End-user Vertical 2024 & 2032
- Figure 51: Middle East and Africa Financial Analytics Industry Revenue Share (%), by End-user Vertical 2024 & 2032
- Figure 52: Middle East and Africa Financial Analytics Industry Revenue (Million), by Country 2024 & 2032
- Figure 53: Middle East and Africa Financial Analytics Industry Revenue Share (%), by Country 2024 & 2032
List of Tables
- Table 1: Global Financial Analytics Industry Revenue Million Forecast, by Region 2019 & 2032
- Table 2: Global Financial Analytics Industry Revenue Million Forecast, by Deployment Type 2019 & 2032
- Table 3: Global Financial Analytics Industry Revenue Million Forecast, by Solution Type 2019 & 2032
- Table 4: Global Financial Analytics Industry Revenue Million Forecast, by End-user Vertical 2019 & 2032
- Table 5: Global Financial Analytics Industry Revenue Million Forecast, by Region 2019 & 2032
- Table 6: Global Financial Analytics Industry Revenue Million Forecast, by Country 2019 & 2032
- Table 7: United States Financial Analytics Industry Revenue (Million) Forecast, by Application 2019 & 2032
- Table 8: Canada Financial Analytics Industry Revenue (Million) Forecast, by Application 2019 & 2032
- Table 9: Mexico Financial Analytics Industry Revenue (Million) Forecast, by Application 2019 & 2032
- Table 10: Global Financial Analytics Industry Revenue Million Forecast, by Country 2019 & 2032
- Table 11: Germany Financial Analytics Industry Revenue (Million) Forecast, by Application 2019 & 2032
- Table 12: United Kingdom Financial Analytics Industry Revenue (Million) Forecast, by Application 2019 & 2032
- Table 13: France Financial Analytics Industry Revenue (Million) Forecast, by Application 2019 & 2032
- Table 14: Spain Financial Analytics Industry Revenue (Million) Forecast, by Application 2019 & 2032
- Table 15: Italy Financial Analytics Industry Revenue (Million) Forecast, by Application 2019 & 2032
- Table 16: Spain Financial Analytics Industry Revenue (Million) Forecast, by Application 2019 & 2032
- Table 17: Belgium Financial Analytics Industry Revenue (Million) Forecast, by Application 2019 & 2032
- Table 18: Netherland Financial Analytics Industry Revenue (Million) Forecast, by Application 2019 & 2032
- Table 19: Nordics Financial Analytics Industry Revenue (Million) Forecast, by Application 2019 & 2032
- Table 20: Rest of Europe Financial Analytics Industry Revenue (Million) Forecast, by Application 2019 & 2032
- Table 21: Global Financial Analytics Industry Revenue Million Forecast, by Country 2019 & 2032
- Table 22: China Financial Analytics Industry Revenue (Million) Forecast, by Application 2019 & 2032
- Table 23: Japan Financial Analytics Industry Revenue (Million) Forecast, by Application 2019 & 2032
- Table 24: India Financial Analytics Industry Revenue (Million) Forecast, by Application 2019 & 2032
- Table 25: South Korea Financial Analytics Industry Revenue (Million) Forecast, by Application 2019 & 2032
- Table 26: Southeast Asia Financial Analytics Industry Revenue (Million) Forecast, by Application 2019 & 2032
- Table 27: Australia Financial Analytics Industry Revenue (Million) Forecast, by Application 2019 & 2032
- Table 28: Indonesia Financial Analytics Industry Revenue (Million) Forecast, by Application 2019 & 2032
- Table 29: Phillipes Financial Analytics Industry Revenue (Million) Forecast, by Application 2019 & 2032
- Table 30: Singapore Financial Analytics Industry Revenue (Million) Forecast, by Application 2019 & 2032
- Table 31: Thailandc Financial Analytics Industry Revenue (Million) Forecast, by Application 2019 & 2032
- Table 32: Rest of Asia Pacific Financial Analytics Industry Revenue (Million) Forecast, by Application 2019 & 2032
- Table 33: Global Financial Analytics Industry Revenue Million Forecast, by Country 2019 & 2032
- Table 34: Brazil Financial Analytics Industry Revenue (Million) Forecast, by Application 2019 & 2032
- Table 35: Argentina Financial Analytics Industry Revenue (Million) Forecast, by Application 2019 & 2032
- Table 36: Peru Financial Analytics Industry Revenue (Million) Forecast, by Application 2019 & 2032
- Table 37: Chile Financial Analytics Industry Revenue (Million) Forecast, by Application 2019 & 2032
- Table 38: Colombia Financial Analytics Industry Revenue (Million) Forecast, by Application 2019 & 2032
- Table 39: Ecuador Financial Analytics Industry Revenue (Million) Forecast, by Application 2019 & 2032
- Table 40: Venezuela Financial Analytics Industry Revenue (Million) Forecast, by Application 2019 & 2032
- Table 41: Rest of South America Financial Analytics Industry Revenue (Million) Forecast, by Application 2019 & 2032
- Table 42: Global Financial Analytics Industry Revenue Million Forecast, by Country 2019 & 2032
- Table 43: United States Financial Analytics Industry Revenue (Million) Forecast, by Application 2019 & 2032
- Table 44: Canada Financial Analytics Industry Revenue (Million) Forecast, by Application 2019 & 2032
- Table 45: Mexico Financial Analytics Industry Revenue (Million) Forecast, by Application 2019 & 2032
- Table 46: Global Financial Analytics Industry Revenue Million Forecast, by Country 2019 & 2032
- Table 47: United Arab Emirates Financial Analytics Industry Revenue (Million) Forecast, by Application 2019 & 2032
- Table 48: Saudi Arabia Financial Analytics Industry Revenue (Million) Forecast, by Application 2019 & 2032
- Table 49: South Africa Financial Analytics Industry Revenue (Million) Forecast, by Application 2019 & 2032
- Table 50: Rest of Middle East and Africa Financial Analytics Industry Revenue (Million) Forecast, by Application 2019 & 2032
- Table 51: Global Financial Analytics Industry Revenue Million Forecast, by Deployment Type 2019 & 2032
- Table 52: Global Financial Analytics Industry Revenue Million Forecast, by Solution Type 2019 & 2032
- Table 53: Global Financial Analytics Industry Revenue Million Forecast, by End-user Vertical 2019 & 2032
- Table 54: Global Financial Analytics Industry Revenue Million Forecast, by Country 2019 & 2032
- Table 55: United States Financial Analytics Industry Revenue (Million) Forecast, by Application 2019 & 2032
- Table 56: Canada Financial Analytics Industry Revenue (Million) Forecast, by Application 2019 & 2032
- Table 57: Global Financial Analytics Industry Revenue Million Forecast, by Deployment Type 2019 & 2032
- Table 58: Global Financial Analytics Industry Revenue Million Forecast, by Solution Type 2019 & 2032
- Table 59: Global Financial Analytics Industry Revenue Million Forecast, by End-user Vertical 2019 & 2032
- Table 60: Global Financial Analytics Industry Revenue Million Forecast, by Country 2019 & 2032
- Table 61: United Kingdom Financial Analytics Industry Revenue (Million) Forecast, by Application 2019 & 2032
- Table 62: Germany Financial Analytics Industry Revenue (Million) Forecast, by Application 2019 & 2032
- Table 63: France Financial Analytics Industry Revenue (Million) Forecast, by Application 2019 & 2032
- Table 64: Rest of Europe Financial Analytics Industry Revenue (Million) Forecast, by Application 2019 & 2032
- Table 65: Global Financial Analytics Industry Revenue Million Forecast, by Deployment Type 2019 & 2032
- Table 66: Global Financial Analytics Industry Revenue Million Forecast, by Solution Type 2019 & 2032
- Table 67: Global Financial Analytics Industry Revenue Million Forecast, by End-user Vertical 2019 & 2032
- Table 68: Global Financial Analytics Industry Revenue Million Forecast, by Country 2019 & 2032
- Table 69: China Financial Analytics Industry Revenue (Million) Forecast, by Application 2019 & 2032
- Table 70: Japan Financial Analytics Industry Revenue (Million) Forecast, by Application 2019 & 2032
- Table 71: Singapore Financial Analytics Industry Revenue (Million) Forecast, by Application 2019 & 2032
- Table 72: India Financial Analytics Industry Revenue (Million) Forecast, by Application 2019 & 2032
- Table 73: South Korea Financial Analytics Industry Revenue (Million) Forecast, by Application 2019 & 2032
- Table 74: Rest of Asia Pacific Financial Analytics Industry Revenue (Million) Forecast, by Application 2019 & 2032
- Table 75: Global Financial Analytics Industry Revenue Million Forecast, by Deployment Type 2019 & 2032
- Table 76: Global Financial Analytics Industry Revenue Million Forecast, by Solution Type 2019 & 2032
- Table 77: Global Financial Analytics Industry Revenue Million Forecast, by End-user Vertical 2019 & 2032
- Table 78: Global Financial Analytics Industry Revenue Million Forecast, by Country 2019 & 2032
- Table 79: Mexico Financial Analytics Industry Revenue (Million) Forecast, by Application 2019 & 2032
- Table 80: Brazil Financial Analytics Industry Revenue (Million) Forecast, by Application 2019 & 2032
- Table 81: Rest of Latin America Financial Analytics Industry Revenue (Million) Forecast, by Application 2019 & 2032
- Table 82: Global Financial Analytics Industry Revenue Million Forecast, by Deployment Type 2019 & 2032
- Table 83: Global Financial Analytics Industry Revenue Million Forecast, by Solution Type 2019 & 2032
- Table 84: Global Financial Analytics Industry Revenue Million Forecast, by End-user Vertical 2019 & 2032
- Table 85: Global Financial Analytics Industry Revenue Million Forecast, by Country 2019 & 2032
- Table 86: United Arab Emirates Financial Analytics Industry Revenue (Million) Forecast, by Application 2019 & 2032
- Table 87: South Africa Financial Analytics Industry Revenue (Million) Forecast, by Application 2019 & 2032
- Table 88: Rest of Middle East and Africa Financial Analytics Industry Revenue (Million) Forecast, by Application 2019 & 2032
Frequently Asked Questions
1. What is the projected Compound Annual Growth Rate (CAGR) of the Financial Analytics Industry?
The projected CAGR is approximately 12.25%.
2. Which companies are prominent players in the Financial Analytics Industry?
Key companies in the market include IBM Corporation, Hitachi Vantara, SAP SE, Teradata Corporation, Microsoft Corporation, SAS Institute, Oracle Corporation, FICO.
3. What are the main segments of the Financial Analytics Industry?
The market segments include Deployment Type, Solution Type, End-user Vertical.
4. Can you provide details about the market size?
The market size is estimated to be USD 10.83 Million as of 2022.
5. What are some drivers contributing to market growth?
Advancement in BI and Business Analytics Tools; Growing Focus on Data Driven Financial Decisions in End Users.
6. What are the notable trends driving market growth?
Cloud Based Solutions are Expected to Gain Significant Traction.
7. Are there any restraints impacting market growth?
Lack of Awareness Regarding Fraud Detection Solutions.
8. Can you provide examples of recent developments in the market?
July 2023 - Dobin, an AI-powered FinTech solution, announced its launch. Dobin is the first Southeast Asian company to use open finance and advanced data analytics to give users a single view of their finances, create unique anonymized customer insights, and empower users to get value from their financial data.
9. What pricing options are available for accessing the report?
Pricing options include single-user, multi-user, and enterprise licenses priced at USD 4750, USD 5250, and USD 8750 respectively.
10. Is the market size provided in terms of value or volume?
The market size is provided in terms of value, measured in Million.
11. Are there any specific market keywords associated with the report?
Yes, the market keyword associated with the report is "Financial Analytics Industry," which aids in identifying and referencing the specific market segment covered.
12. How do I determine which pricing option suits my needs best?
The pricing options vary based on user requirements and access needs. Individual users may opt for single-user licenses, while businesses requiring broader access may choose multi-user or enterprise licenses for cost-effective access to the report.
13. Are there any additional resources or data provided in the Financial Analytics Industry report?
While the report offers comprehensive insights, it's advisable to review the specific contents or supplementary materials provided to ascertain if additional resources or data are available.
14. How can I stay updated on further developments or reports in the Financial Analytics Industry?
To stay informed about further developments, trends, and reports in the Financial Analytics Industry, consider subscribing to industry newsletters, following relevant companies and organizations, or regularly checking reputable industry news sources and publications.
Methodology
Step 1 - Identification of Relevant Samples Size from Population Database


Step 2 - Approaches for Defining Global Market Size (Value, Volume* & Price*)

Note*: In applicable scenarios
Step 3 - Data Sources
Primary Research
- Web Analytics
- Survey Reports
- Research Institute
- Latest Research Reports
- Opinion Leaders
Secondary Research
- Annual Reports
- White Paper
- Latest Press Release
- Industry Association
- Paid Database
- Investor Presentations

Step 4 - Data Triangulation
Involves using different sources of information in order to increase the validity of a study
These sources are likely to be stakeholders in a program - participants, other researchers, program staff, other community members, and so on.
Then we put all data in single framework & apply various statistical tools to find out the dynamic on the market.
During the analysis stage, feedback from the stakeholder groups would be compared to determine areas of agreement as well as areas of divergence


