
Key Insights
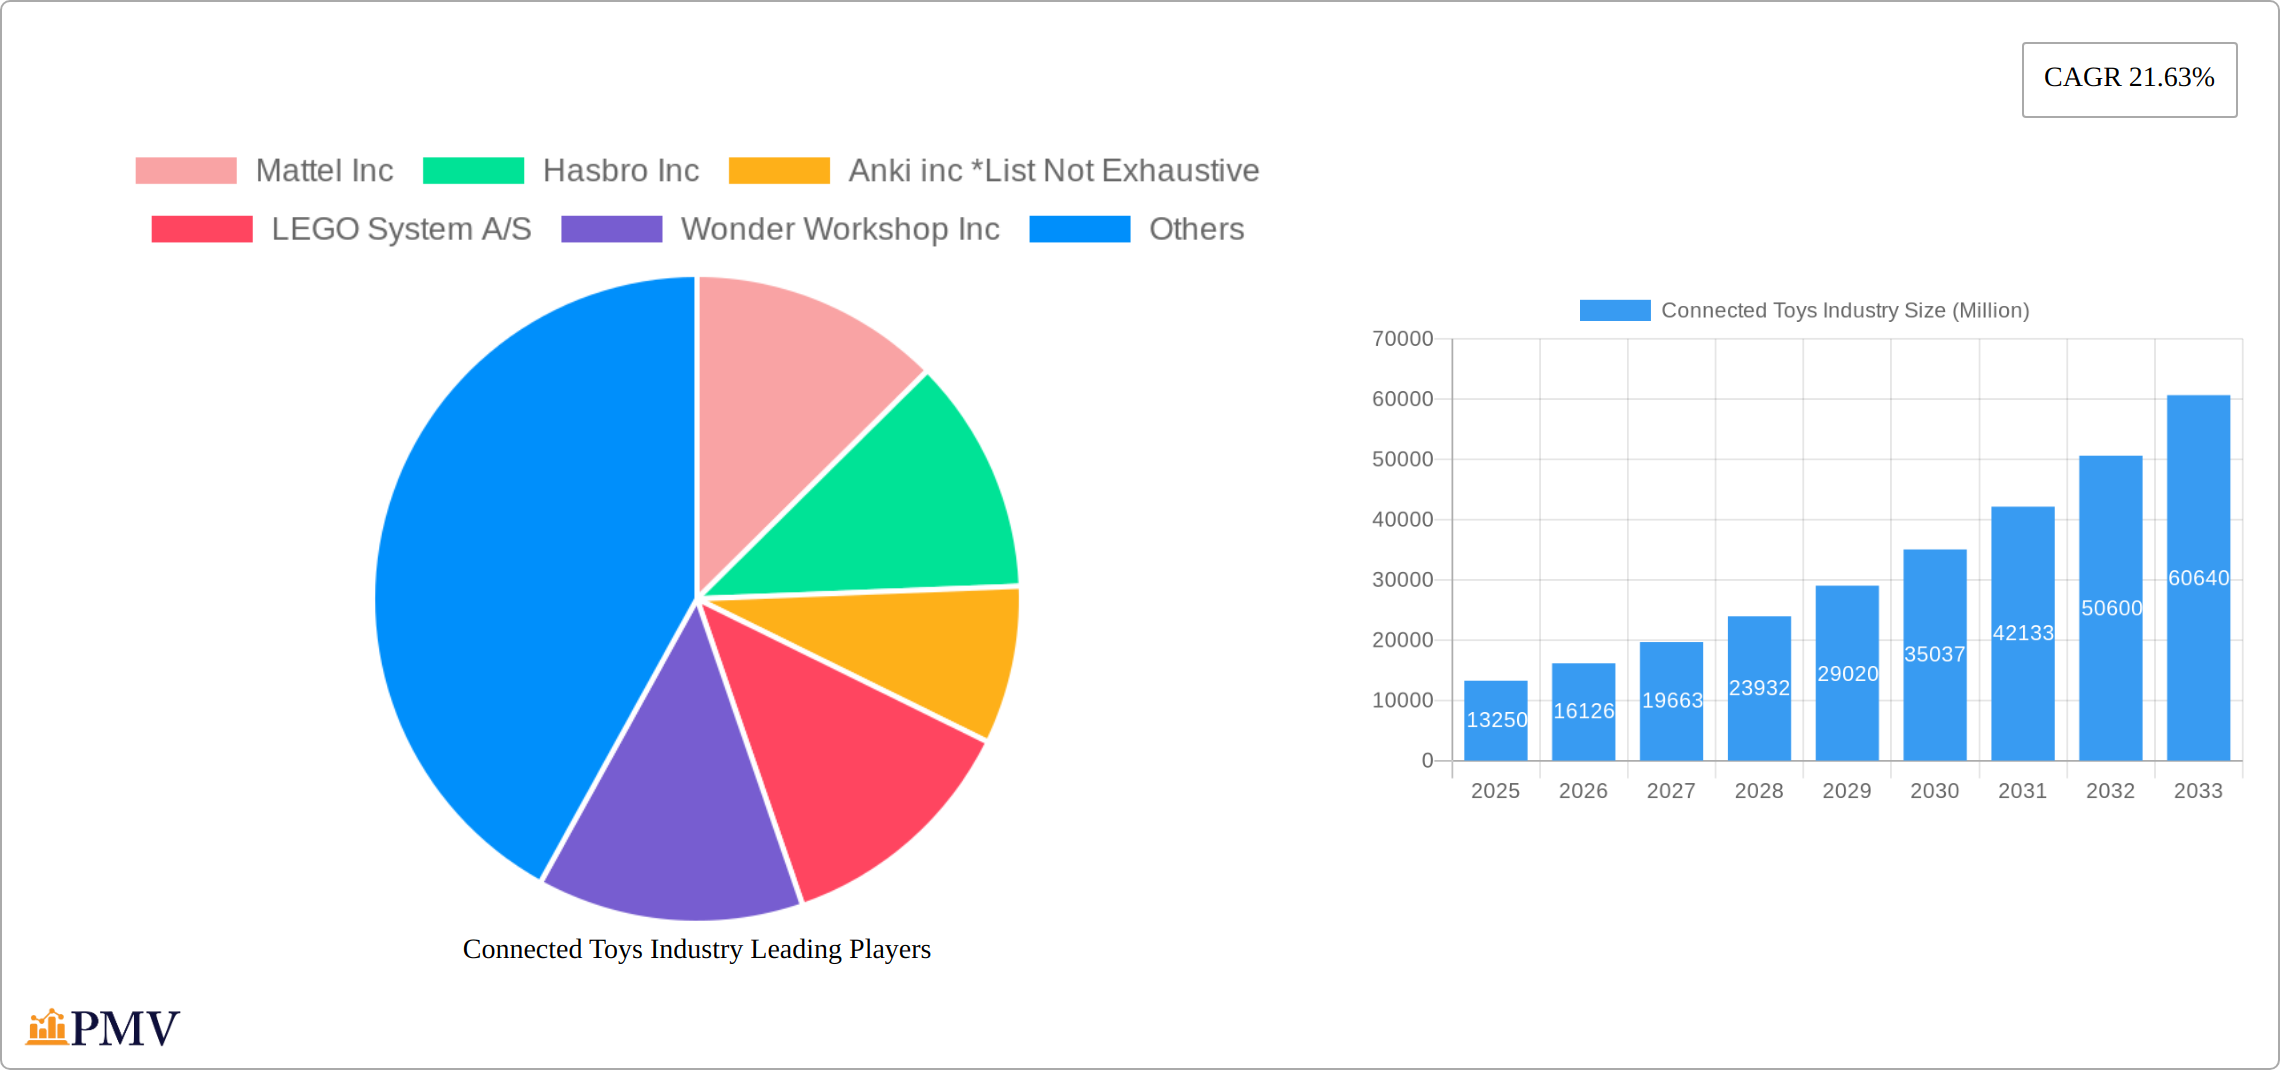
The connected toys market, valued at $13.25 billion in 2025, is poised for substantial growth, exhibiting a Compound Annual Growth Rate (CAGR) of 21.63% from 2025 to 2033. This robust expansion is driven by several key factors. Firstly, the increasing penetration of smartphones, tablets, and gaming consoles in households globally provides a readily available infrastructure for connectivity. Secondly, the integration of advanced technologies such as Artificial Intelligence (AI), augmented reality (AR), and the Internet of Things (IoT) enhances the interactive capabilities of toys, creating more engaging and educational play experiences. Parents are increasingly seeking toys that stimulate cognitive development and offer educational benefits, fueling the demand for sophisticated connected toys. Furthermore, the rise of digital native children accustomed to screen-based interactions naturally gravitates towards these technologically advanced playthings. The market segmentation reveals a diverse landscape, with smartphone-connected toys currently holding the largest share, followed by console and tablet connected toys. However, as technology evolves, the lines between these segments may blur, with toys potentially offering cross-platform compatibility. Competitive pressures are significant, with established players like Mattel and Hasbro alongside innovative startups continually vying for market share. Geographic distribution shows a strong presence in North America and Europe, but rapidly growing markets in Asia and other regions present significant opportunities for future expansion.
The connected toys market's growth isn't without challenges. Concerns regarding data privacy and security related to children's data collected by connected toys represent a significant restraint. High manufacturing costs and the potential for rapid technological obsolescence could also impede market expansion. Addressing these concerns through robust security measures, ethical data handling practices, and durable product designs is crucial for sustained growth. Further market penetration will depend on overcoming affordability barriers in developing markets and ensuring the widespread availability of high-speed internet access. The continued innovation in artificial intelligence, particularly in areas of natural language processing and personalized learning experiences, presents a significant growth opportunity for the industry. The market will likely see further diversification within segments, such as the emergence of specialized toys tailored to specific age groups and learning needs.
Connected Toys Industry Market Report: 2019-2033
This comprehensive report provides a detailed analysis of the Connected Toys Industry, covering the period from 2019 to 2033. With a focus on market structure, competitive dynamics, technological advancements, and future growth projections, this report offers invaluable insights for industry stakeholders, investors, and businesses seeking to understand and capitalize on this dynamic market. The report includes detailed segmentation by toy type (Smartphone Connected Toys, Console Connected Toys, Tablet Connected Toys), reveals key market drivers and challenges, and profiles leading players like Mattel Inc, Hasbro Inc, and LEGO System A/S. The base year for this report is 2025, with estimations for 2025 and a forecast period extending to 2033. The historical period analyzed is 2019-2024. The total market size is estimated at xx Million in 2025 and projected to reach xx Million by 2033.
Connected Toys Industry Market Structure & Competitive Dynamics
The Connected Toys industry exhibits a moderately concentrated market structure, with a few dominant players commanding significant market share. Mattel Inc, Hasbro Inc, and LEGO System A/S hold substantial portions of the market, while several other players contribute to the remaining share. The competitive landscape is characterized by intense innovation, with companies constantly striving to develop new and engaging connected toys that leverage technological advancements. This leads to a dynamic landscape with frequent product launches and updates. The regulatory framework varies across different regions, influencing product development and market access. Substitutes for connected toys include traditional toys and other forms of entertainment, but the unique interactive and digital experiences offered by connected toys contribute to its sustained growth. End-user trends lean towards preference for educational and interactive toys, fueling the demand for connected toys with learning capabilities. M&A activity in the sector has been moderate, with deal values ranging from xx Million to xx Million in recent years, indicating strategic consolidation efforts within the industry. For example, the acquisition of smaller, specialized toy companies by larger players enables them to expand their product portfolios and target specific market niches.
Connected Toys Industry Industry Trends & Insights
The connected toys industry is experiencing robust growth, fueled by several converging factors. Technological advancements, including sophisticated AI integration, seamless connectivity, and intuitive user interfaces, continuously elevate the user experience, driving increased adoption. Consumer preferences are shifting decisively towards interactive and educational toys offering rich digital experiences for children. This trend is amplified by the ubiquitous presence of smartphones and tablets, expanding the addressable market exponentially. A paramount concern driving innovation is safety and security; companies are implementing stringent measures to safeguard children's data and privacy, building consumer trust. Market analysts project a compound annual growth rate (CAGR) of xx% for the industry during the forecast period (2025-2033), signaling substantial future growth. Market penetration is steadily increasing, driven by rising disposable incomes and a growing awareness of the educational benefits these toys provide. The competitive landscape is dynamic, shaped by relentless innovation, powerful branding, and strategic distribution channel management. The increasing popularity of subscription-based models is fundamentally reshaping revenue streams within the sector, creating new opportunities and challenges.
Dominant Markets & Segments in Connected Toys Industry
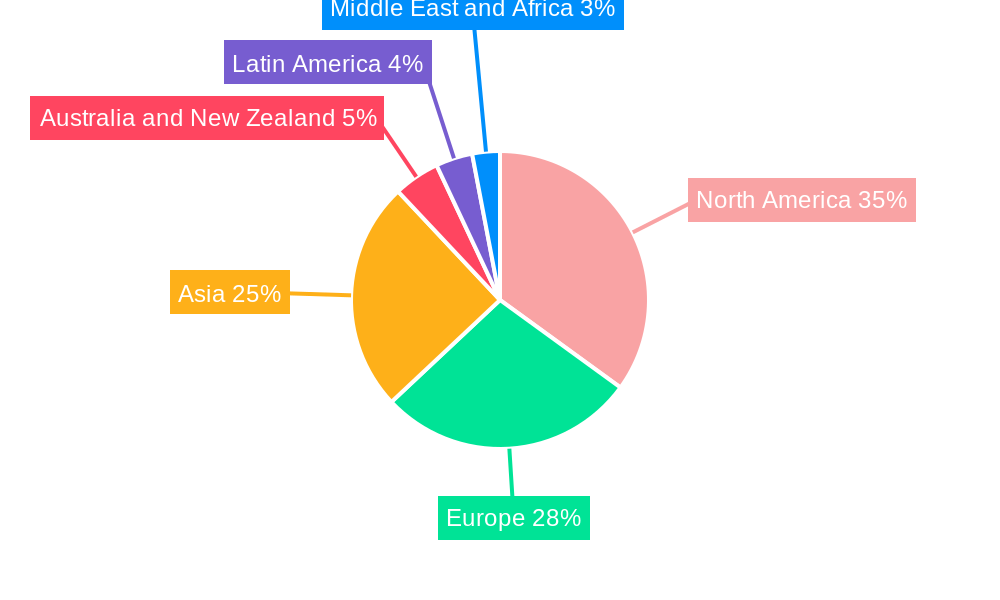
The North American market currently dominates the Connected Toys industry, driven by high disposable incomes, early adoption of new technologies, and a strong presence of major players. Within the segment breakdown:
Smartphone Connected Toys: This segment holds the largest market share due to the widespread adoption of smartphones, ease of connectivity, and the vast potential for app-based interactions. Key drivers include the increasing affordability of smartphones, widespread mobile internet penetration, and the growing preference for mobile-centric experiences.
Tablet Connected Toys: This segment experiences significant growth due to the large screen size and enhanced processing capabilities of tablets, which facilitate more complex and immersive gameplay experiences. Market drivers include the growing popularity of tablets as educational tools, the increase in screen time for children, and the availability of educational apps and games.
Console Connected Toys: While smaller than other segments, the console connected toys segment is growing due to the immersive gaming experiences they offer. Key drivers here are the popularity of gaming consoles among children and families, advancements in console technology, and the development of innovative connected toy experiences that leverage console capabilities.
Further, economic policies promoting technological advancement and infrastructure investments in digital connectivity contribute to market growth in dominant regions. The dominance of North America is challenged by the rapidly expanding markets in Asia-Pacific and Europe, where increasing disposable incomes and expanding internet penetration drive growth in connected toy adoption.
Connected Toys Industry Product Innovations
Recent product innovations highlight a strong focus on integrating advanced technologies such as artificial intelligence (AI), augmented reality (AR), and virtual reality (VR) to create deeply immersive and interactive experiences. This includes toys with sophisticated voice recognition capabilities, personalized learning pathways, and seamless integration with smart home ecosystems. The competitive advantage hinges on delivering unique, engaging, and educational experiences tailored to evolving consumer preferences, with a paramount emphasis on robust safety and data privacy features. This includes proactive measures to address potential concerns around screen time and its impact on child development.
Report Segmentation & Scope
This report segments the Connected Toys market primarily by type:
Smartphone Connected Toys: This segment includes toys that connect directly to smartphones via Bluetooth or other wireless technologies, offering interactive experiences controlled via dedicated mobile applications. Market size is estimated at xx Million in 2025 and is projected to grow to xx Million by 2033.
Console Connected Toys: This segment encompasses toys designed to connect with gaming consoles, enhancing gaming experiences through physical interaction and expanded gameplay possibilities. The market is expected to grow steadily at a CAGR of xx%.
Tablet Connected Toys: This segment comprises toys that connect and interact with tablets, offering a wider range of interactive experiences through larger screens and increased processing power. The market is expected to grow at a CAGR of xx%, driven by increasing tablet penetration and the educational applications of connected toys.
Each segment’s competitive dynamics are analyzed based on market share, innovation, pricing strategies, and distribution channels.
Key Drivers of Connected Toys Industry Growth
Several key factors are propelling the growth of the connected toys industry. Rapid technological advancements, particularly in AI, AR, and enhanced connectivity, continuously enhance the interactive and educational value proposition of these toys. The rise in disposable incomes, especially in emerging economies, significantly expands the potential customer base. Supportive regulatory frameworks that encourage innovation and the adoption of new technologies further fuel this growth. Finally, the increasing demand for engaging and educational toys that cater to the evolving needs of children is a primary driver of industry expansion.
Challenges in the Connected Toys Industry Sector
The connected toys industry faces significant challenges. Stringent data privacy and security regulations impose substantial compliance costs and can potentially hinder market expansion. Supply chain disruptions and escalating raw material costs increase production expenses and impact profitability. The fiercely competitive landscape necessitates continuous innovation and product differentiation to maintain market share. Furthermore, addressing parental concerns regarding screen time and the potential negative impact on children's development remains a critical hurdle that requires proactive solutions and transparent communication.
Leading Players in the Connected Toys Industry Market
- Mattel Inc
- Hasbro Inc
- Anki inc
- LEGO System A/S
- Wonder Workshop Inc
- Sphero
- WowWee Group Limited
- Leka SAS
- Sony Corporation
- Bandai Namco Entertainment Inc
Key Developments in Connected Toys Industry Sector
- March 2023: The Lego Group reported a substantial profit increase and expanded its retail presence by opening 155 new stores, demonstrating robust market demand and the company's continued commitment to growth and market leadership.
- January 2022: LEGO's decision to discontinue its VIDIYO product line underscores the dynamic nature of the market and the imperative for companies to adapt and innovate to meet ever-evolving consumer preferences and technological advancements.
- [Add another recent development here with date and brief description]
Strategic Connected Toys Industry Market Outlook
The future of the Connected Toys industry looks bright. Continued technological innovation, the expansion of the digital infrastructure, and rising consumer demand will drive substantial market growth. Strategic opportunities lie in developing educational and interactive toys that address the growing needs for personalized learning experiences and promoting the positive use of technology in children's lives. A focus on enhancing safety features and addressing data privacy concerns will be crucial for maintaining consumer trust and fostering market expansion.
Connected Toys Industry Segmentation
-
1. Type
- 1.1. Smartphone Connected Toys
- 1.2. Console Connected Toys
- 1.3. Tablet Connected Toys
Connected Toys Industry Segmentation By Geography
- 1. North America
- 2. Europe
- 3. Asia
- 4. Australia and New Zealand
- 5. Latin America
- 6. Middle East and Africa
Connected Toys Industry REPORT HIGHLIGHTS
| Aspects | Details |
|---|---|
| Study Period | 2019-2033 |
| Base Year | 2024 |
| Estimated Year | 2025 |
| Forecast Period | 2025-2033 |
| Historical Period | 2019-2024 |
| Growth Rate | CAGR of 21.63% from 2019-2033 |
| Segmentation |
|
Table of Contents
- 1. Introduction
- 1.1. Research Scope
- 1.2. Market Segmentation
- 1.3. Research Methodology
- 1.4. Definitions and Assumptions
- 2. Executive Summary
- 2.1. Introduction
- 3. Market Dynamics
- 3.1. Introduction
- 3.2. Market Drivers
- 3.2.1. Easy Availability of Connected Platforms
- 3.3. Market Restrains
- 3.3.1. Fragmented Market with Several Local Vendors
- 3.4. Market Trends
- 3.4.1. Smartphone Connected Toys are Expected to Witness Significant Growth
- 4. Market Factor Analysis
- 4.1. Porters Five Forces
- 4.2. Supply/Value Chain
- 4.3. PESTEL analysis
- 4.4. Market Entropy
- 4.5. Patent/Trademark Analysis
- 5. Global Connected Toys Industry Analysis, Insights and Forecast, 2019-2031
- 5.1. Market Analysis, Insights and Forecast - by Type
- 5.1.1. Smartphone Connected Toys
- 5.1.2. Console Connected Toys
- 5.1.3. Tablet Connected Toys
- 5.2. Market Analysis, Insights and Forecast - by Region
- 5.2.1. North America
- 5.2.2. Europe
- 5.2.3. Asia
- 5.2.4. Australia and New Zealand
- 5.2.5. Latin America
- 5.2.6. Middle East and Africa
- 5.1. Market Analysis, Insights and Forecast - by Type
- 6. North America Connected Toys Industry Analysis, Insights and Forecast, 2019-2031
- 6.1. Market Analysis, Insights and Forecast - by Type
- 6.1.1. Smartphone Connected Toys
- 6.1.2. Console Connected Toys
- 6.1.3. Tablet Connected Toys
- 6.1. Market Analysis, Insights and Forecast - by Type
- 7. Europe Connected Toys Industry Analysis, Insights and Forecast, 2019-2031
- 7.1. Market Analysis, Insights and Forecast - by Type
- 7.1.1. Smartphone Connected Toys
- 7.1.2. Console Connected Toys
- 7.1.3. Tablet Connected Toys
- 7.1. Market Analysis, Insights and Forecast - by Type
- 8. Asia Connected Toys Industry Analysis, Insights and Forecast, 2019-2031
- 8.1. Market Analysis, Insights and Forecast - by Type
- 8.1.1. Smartphone Connected Toys
- 8.1.2. Console Connected Toys
- 8.1.3. Tablet Connected Toys
- 8.1. Market Analysis, Insights and Forecast - by Type
- 9. Australia and New Zealand Connected Toys Industry Analysis, Insights and Forecast, 2019-2031
- 9.1. Market Analysis, Insights and Forecast - by Type
- 9.1.1. Smartphone Connected Toys
- 9.1.2. Console Connected Toys
- 9.1.3. Tablet Connected Toys
- 9.1. Market Analysis, Insights and Forecast - by Type
- 10. Latin America Connected Toys Industry Analysis, Insights and Forecast, 2019-2031
- 10.1. Market Analysis, Insights and Forecast - by Type
- 10.1.1. Smartphone Connected Toys
- 10.1.2. Console Connected Toys
- 10.1.3. Tablet Connected Toys
- 10.1. Market Analysis, Insights and Forecast - by Type
- 11. Middle East and Africa Connected Toys Industry Analysis, Insights and Forecast, 2019-2031
- 11.1. Market Analysis, Insights and Forecast - by Type
- 11.1.1. Smartphone Connected Toys
- 11.1.2. Console Connected Toys
- 11.1.3. Tablet Connected Toys
- 11.1. Market Analysis, Insights and Forecast - by Type
- 12. North America Connected Toys Industry Analysis, Insights and Forecast, 2019-2031
- 12.1. Market Analysis, Insights and Forecast - By Country/Sub-region
- 12.1.1.
- 13. Europe Connected Toys Industry Analysis, Insights and Forecast, 2019-2031
- 13.1. Market Analysis, Insights and Forecast - By Country/Sub-region
- 13.1.1.
- 14. Asia Connected Toys Industry Analysis, Insights and Forecast, 2019-2031
- 14.1. Market Analysis, Insights and Forecast - By Country/Sub-region
- 14.1.1.
- 15. Australia and New Zealand Connected Toys Industry Analysis, Insights and Forecast, 2019-2031
- 15.1. Market Analysis, Insights and Forecast - By Country/Sub-region
- 15.1.1.
- 16. Latin America Connected Toys Industry Analysis, Insights and Forecast, 2019-2031
- 16.1. Market Analysis, Insights and Forecast - By Country/Sub-region
- 16.1.1.
- 17. Middle East and Africa Connected Toys Industry Analysis, Insights and Forecast, 2019-2031
- 17.1. Market Analysis, Insights and Forecast - By Country/Sub-region
- 17.1.1.
- 18. Competitive Analysis
- 18.1. Global Market Share Analysis 2024
- 18.2. Company Profiles
- 18.2.1 Mattel Inc
- 18.2.1.1. Overview
- 18.2.1.2. Products
- 18.2.1.3. SWOT Analysis
- 18.2.1.4. Recent Developments
- 18.2.1.5. Financials (Based on Availability)
- 18.2.2 Hasbro Inc
- 18.2.2.1. Overview
- 18.2.2.2. Products
- 18.2.2.3. SWOT Analysis
- 18.2.2.4. Recent Developments
- 18.2.2.5. Financials (Based on Availability)
- 18.2.3 Anki inc *List Not Exhaustive
- 18.2.3.1. Overview
- 18.2.3.2. Products
- 18.2.3.3. SWOT Analysis
- 18.2.3.4. Recent Developments
- 18.2.3.5. Financials (Based on Availability)
- 18.2.4 LEGO System A/S
- 18.2.4.1. Overview
- 18.2.4.2. Products
- 18.2.4.3. SWOT Analysis
- 18.2.4.4. Recent Developments
- 18.2.4.5. Financials (Based on Availability)
- 18.2.5 Wonder Workshop Inc
- 18.2.5.1. Overview
- 18.2.5.2. Products
- 18.2.5.3. SWOT Analysis
- 18.2.5.4. Recent Developments
- 18.2.5.5. Financials (Based on Availability)
- 18.2.6 Sphero
- 18.2.6.1. Overview
- 18.2.6.2. Products
- 18.2.6.3. SWOT Analysis
- 18.2.6.4. Recent Developments
- 18.2.6.5. Financials (Based on Availability)
- 18.2.7 WowWee Group Limited
- 18.2.7.1. Overview
- 18.2.7.2. Products
- 18.2.7.3. SWOT Analysis
- 18.2.7.4. Recent Developments
- 18.2.7.5. Financials (Based on Availability)
- 18.2.8 Leka SAS
- 18.2.8.1. Overview
- 18.2.8.2. Products
- 18.2.8.3. SWOT Analysis
- 18.2.8.4. Recent Developments
- 18.2.8.5. Financials (Based on Availability)
- 18.2.9 Sony Corporation
- 18.2.9.1. Overview
- 18.2.9.2. Products
- 18.2.9.3. SWOT Analysis
- 18.2.9.4. Recent Developments
- 18.2.9.5. Financials (Based on Availability)
- 18.2.10 Bandai Namco Entertainment Inc
- 18.2.10.1. Overview
- 18.2.10.2. Products
- 18.2.10.3. SWOT Analysis
- 18.2.10.4. Recent Developments
- 18.2.10.5. Financials (Based on Availability)
- 18.2.1 Mattel Inc
List of Figures
- Figure 1: Global Connected Toys Industry Revenue Breakdown (Million, %) by Region 2024 & 2032
- Figure 2: North America Connected Toys Industry Revenue (Million), by Country 2024 & 2032
- Figure 3: North America Connected Toys Industry Revenue Share (%), by Country 2024 & 2032
- Figure 4: Europe Connected Toys Industry Revenue (Million), by Country 2024 & 2032
- Figure 5: Europe Connected Toys Industry Revenue Share (%), by Country 2024 & 2032
- Figure 6: Asia Connected Toys Industry Revenue (Million), by Country 2024 & 2032
- Figure 7: Asia Connected Toys Industry Revenue Share (%), by Country 2024 & 2032
- Figure 8: Australia and New Zealand Connected Toys Industry Revenue (Million), by Country 2024 & 2032
- Figure 9: Australia and New Zealand Connected Toys Industry Revenue Share (%), by Country 2024 & 2032
- Figure 10: Latin America Connected Toys Industry Revenue (Million), by Country 2024 & 2032
- Figure 11: Latin America Connected Toys Industry Revenue Share (%), by Country 2024 & 2032
- Figure 12: Middle East and Africa Connected Toys Industry Revenue (Million), by Country 2024 & 2032
- Figure 13: Middle East and Africa Connected Toys Industry Revenue Share (%), by Country 2024 & 2032
- Figure 14: North America Connected Toys Industry Revenue (Million), by Type 2024 & 2032
- Figure 15: North America Connected Toys Industry Revenue Share (%), by Type 2024 & 2032
- Figure 16: North America Connected Toys Industry Revenue (Million), by Country 2024 & 2032
- Figure 17: North America Connected Toys Industry Revenue Share (%), by Country 2024 & 2032
- Figure 18: Europe Connected Toys Industry Revenue (Million), by Type 2024 & 2032
- Figure 19: Europe Connected Toys Industry Revenue Share (%), by Type 2024 & 2032
- Figure 20: Europe Connected Toys Industry Revenue (Million), by Country 2024 & 2032
- Figure 21: Europe Connected Toys Industry Revenue Share (%), by Country 2024 & 2032
- Figure 22: Asia Connected Toys Industry Revenue (Million), by Type 2024 & 2032
- Figure 23: Asia Connected Toys Industry Revenue Share (%), by Type 2024 & 2032
- Figure 24: Asia Connected Toys Industry Revenue (Million), by Country 2024 & 2032
- Figure 25: Asia Connected Toys Industry Revenue Share (%), by Country 2024 & 2032
- Figure 26: Australia and New Zealand Connected Toys Industry Revenue (Million), by Type 2024 & 2032
- Figure 27: Australia and New Zealand Connected Toys Industry Revenue Share (%), by Type 2024 & 2032
- Figure 28: Australia and New Zealand Connected Toys Industry Revenue (Million), by Country 2024 & 2032
- Figure 29: Australia and New Zealand Connected Toys Industry Revenue Share (%), by Country 2024 & 2032
- Figure 30: Latin America Connected Toys Industry Revenue (Million), by Type 2024 & 2032
- Figure 31: Latin America Connected Toys Industry Revenue Share (%), by Type 2024 & 2032
- Figure 32: Latin America Connected Toys Industry Revenue (Million), by Country 2024 & 2032
- Figure 33: Latin America Connected Toys Industry Revenue Share (%), by Country 2024 & 2032
- Figure 34: Middle East and Africa Connected Toys Industry Revenue (Million), by Type 2024 & 2032
- Figure 35: Middle East and Africa Connected Toys Industry Revenue Share (%), by Type 2024 & 2032
- Figure 36: Middle East and Africa Connected Toys Industry Revenue (Million), by Country 2024 & 2032
- Figure 37: Middle East and Africa Connected Toys Industry Revenue Share (%), by Country 2024 & 2032
List of Tables
- Table 1: Global Connected Toys Industry Revenue Million Forecast, by Region 2019 & 2032
- Table 2: Global Connected Toys Industry Revenue Million Forecast, by Type 2019 & 2032
- Table 3: Global Connected Toys Industry Revenue Million Forecast, by Region 2019 & 2032
- Table 4: Global Connected Toys Industry Revenue Million Forecast, by Country 2019 & 2032
- Table 5: Connected Toys Industry Revenue (Million) Forecast, by Application 2019 & 2032
- Table 6: Global Connected Toys Industry Revenue Million Forecast, by Country 2019 & 2032
- Table 7: Connected Toys Industry Revenue (Million) Forecast, by Application 2019 & 2032
- Table 8: Global Connected Toys Industry Revenue Million Forecast, by Country 2019 & 2032
- Table 9: Connected Toys Industry Revenue (Million) Forecast, by Application 2019 & 2032
- Table 10: Global Connected Toys Industry Revenue Million Forecast, by Country 2019 & 2032
- Table 11: Connected Toys Industry Revenue (Million) Forecast, by Application 2019 & 2032
- Table 12: Global Connected Toys Industry Revenue Million Forecast, by Country 2019 & 2032
- Table 13: Connected Toys Industry Revenue (Million) Forecast, by Application 2019 & 2032
- Table 14: Global Connected Toys Industry Revenue Million Forecast, by Country 2019 & 2032
- Table 15: Connected Toys Industry Revenue (Million) Forecast, by Application 2019 & 2032
- Table 16: Global Connected Toys Industry Revenue Million Forecast, by Type 2019 & 2032
- Table 17: Global Connected Toys Industry Revenue Million Forecast, by Country 2019 & 2032
- Table 18: Global Connected Toys Industry Revenue Million Forecast, by Type 2019 & 2032
- Table 19: Global Connected Toys Industry Revenue Million Forecast, by Country 2019 & 2032
- Table 20: Global Connected Toys Industry Revenue Million Forecast, by Type 2019 & 2032
- Table 21: Global Connected Toys Industry Revenue Million Forecast, by Country 2019 & 2032
- Table 22: Global Connected Toys Industry Revenue Million Forecast, by Type 2019 & 2032
- Table 23: Global Connected Toys Industry Revenue Million Forecast, by Country 2019 & 2032
- Table 24: Global Connected Toys Industry Revenue Million Forecast, by Type 2019 & 2032
- Table 25: Global Connected Toys Industry Revenue Million Forecast, by Country 2019 & 2032
- Table 26: Global Connected Toys Industry Revenue Million Forecast, by Type 2019 & 2032
- Table 27: Global Connected Toys Industry Revenue Million Forecast, by Country 2019 & 2032
Frequently Asked Questions
1. What is the projected Compound Annual Growth Rate (CAGR) of the Connected Toys Industry?
The projected CAGR is approximately 21.63%.
2. Which companies are prominent players in the Connected Toys Industry?
Key companies in the market include Mattel Inc, Hasbro Inc, Anki inc *List Not Exhaustive, LEGO System A/S, Wonder Workshop Inc, Sphero, WowWee Group Limited, Leka SAS, Sony Corporation, Bandai Namco Entertainment Inc.
3. What are the main segments of the Connected Toys Industry?
The market segments include Type.
4. Can you provide details about the market size?
The market size is estimated to be USD 13.25 Million as of 2022.
5. What are some drivers contributing to market growth?
Easy Availability of Connected Platforms.
6. What are the notable trends driving market growth?
Smartphone Connected Toys are Expected to Witness Significant Growth.
7. Are there any restraints impacting market growth?
Fragmented Market with Several Local Vendors.
8. Can you provide examples of recent developments in the market?
March 2023: The Lego Group recently announced a significant increase in profit after three years, despite experiencing a surge in demand. To meet the growing demand, the company made substantial investments in production capabilities and expanded its reach by opening 155 new branded stores in the previous year. Additionally, the company ramped up production at three of its five factories to ensure an adequate supply of Lego products.
9. What pricing options are available for accessing the report?
Pricing options include single-user, multi-user, and enterprise licenses priced at USD 4750, USD 5250, and USD 8750 respectively.
10. Is the market size provided in terms of value or volume?
The market size is provided in terms of value, measured in Million.
11. Are there any specific market keywords associated with the report?
Yes, the market keyword associated with the report is "Connected Toys Industry," which aids in identifying and referencing the specific market segment covered.
12. How do I determine which pricing option suits my needs best?
The pricing options vary based on user requirements and access needs. Individual users may opt for single-user licenses, while businesses requiring broader access may choose multi-user or enterprise licenses for cost-effective access to the report.
13. Are there any additional resources or data provided in the Connected Toys Industry report?
While the report offers comprehensive insights, it's advisable to review the specific contents or supplementary materials provided to ascertain if additional resources or data are available.
14. How can I stay updated on further developments or reports in the Connected Toys Industry?
To stay informed about further developments, trends, and reports in the Connected Toys Industry, consider subscribing to industry newsletters, following relevant companies and organizations, or regularly checking reputable industry news sources and publications.
Methodology
Step 1 - Identification of Relevant Samples Size from Population Database


Step 2 - Approaches for Defining Global Market Size (Value, Volume* & Price*)

Note*: In applicable scenarios
Step 3 - Data Sources
Primary Research
- Web Analytics
- Survey Reports
- Research Institute
- Latest Research Reports
- Opinion Leaders
Secondary Research
- Annual Reports
- White Paper
- Latest Press Release
- Industry Association
- Paid Database
- Investor Presentations

Step 4 - Data Triangulation
Involves using different sources of information in order to increase the validity of a study
These sources are likely to be stakeholders in a program - participants, other researchers, program staff, other community members, and so on.
Then we put all data in single framework & apply various statistical tools to find out the dynamic on the market.
During the analysis stage, feedback from the stakeholder groups would be compared to determine areas of agreement as well as areas of divergence


