
Key Insights
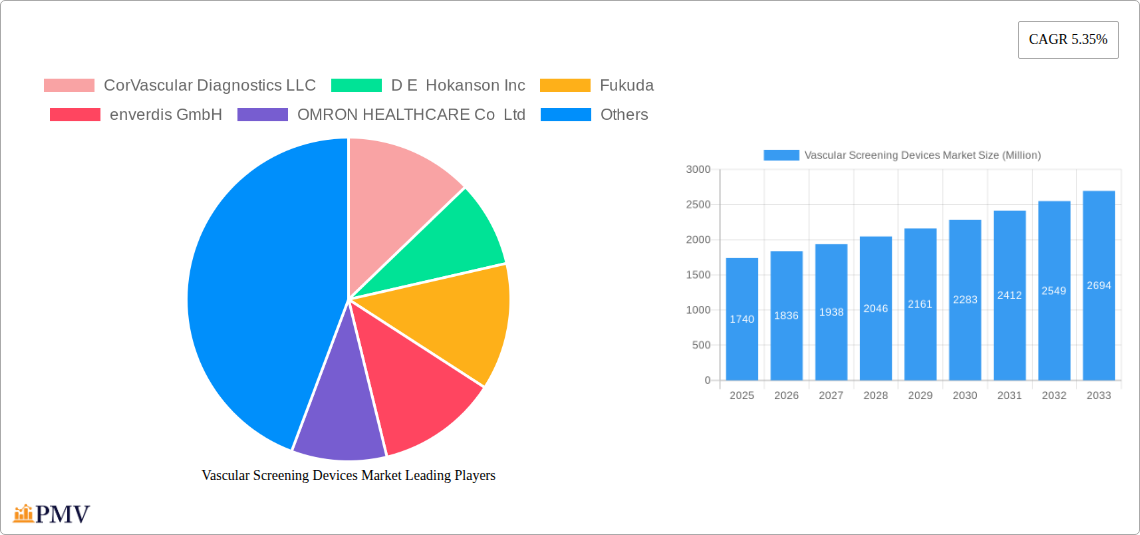
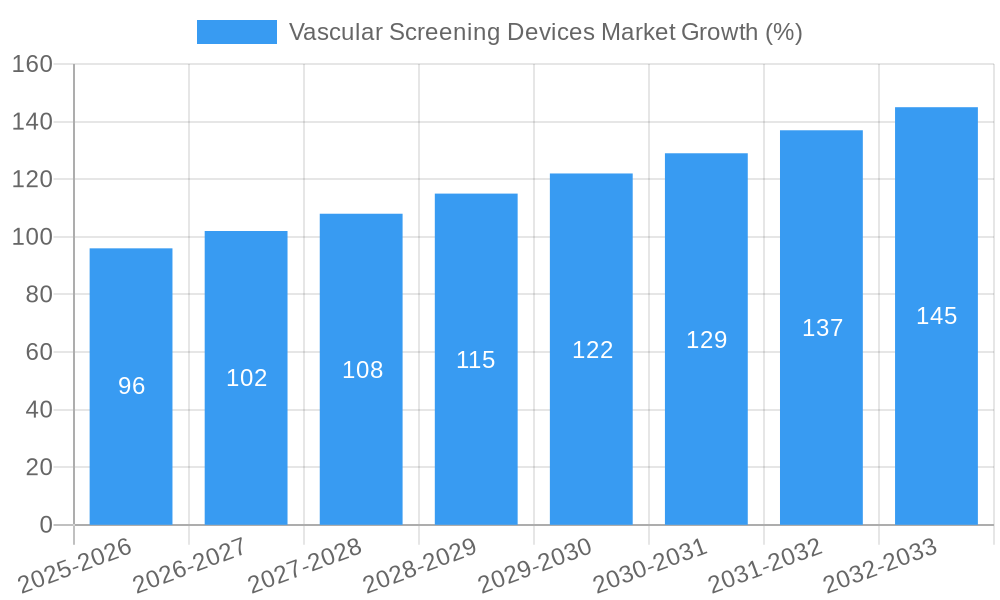
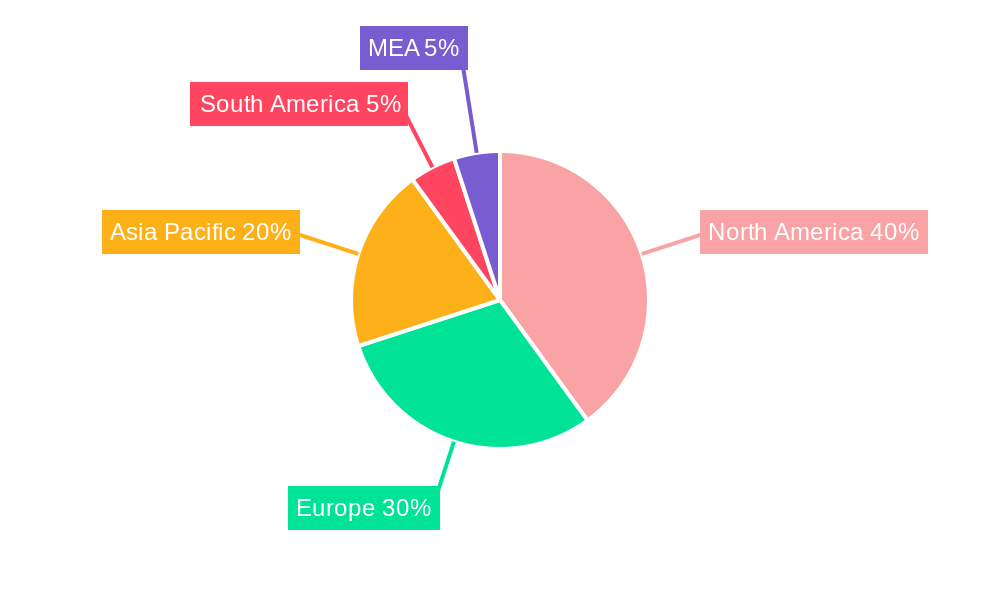
The global vascular screening devices market, valued at $1.74 billion in 2025, is projected to experience robust growth, exhibiting a compound annual growth rate (CAGR) of 5.35% from 2025 to 2033. This expansion is driven by several key factors. Increasing prevalence of cardiovascular diseases, a rising geriatric population susceptible to vascular conditions, and advancements in minimally invasive diagnostic techniques are major contributors. Furthermore, the growing adoption of point-of-care testing and the increasing demand for early disease detection are fueling market growth. Technological advancements leading to the development of portable and user-friendly devices are also significantly impacting market penetration, particularly in remote areas with limited access to advanced healthcare facilities. The market is segmented by product type (portable, standalone) and end-user (hospitals, diagnostic centers/clinics, other end-users). Hospitals and diagnostic centers currently represent the largest segment, driven by their established infrastructure and expertise in vascular diagnostics. However, the portable segment is anticipated to witness faster growth due to its convenience and accessibility. Geographical distribution reveals strong market presence in North America and Europe, attributed to well-established healthcare infrastructure and high healthcare expenditure. However, Asia-Pacific is expected to emerge as a high-growth region, driven by rising healthcare awareness, increasing disposable incomes, and expanding healthcare infrastructure in developing economies.
Competition in the vascular screening devices market is intense, with both established players like OMRON HEALTHCARE Co Ltd and Mindray, and emerging companies vying for market share. While the market faces constraints such as high costs associated with advanced devices and stringent regulatory approvals, the overall outlook remains positive. The continuous development of innovative technologies, coupled with increasing awareness regarding vascular health and the benefits of early detection, are anticipated to significantly propel market expansion throughout the forecast period. Companies are focusing on strategic partnerships, product innovation, and expansion into emerging markets to maintain a competitive edge. The ongoing demand for improved accuracy, portability, and affordability of vascular screening devices will shape the future landscape of this rapidly evolving market.
Vascular Screening Devices Market: A Comprehensive Report (2019-2033)
This in-depth report provides a comprehensive analysis of the global Vascular Screening Devices Market, covering the period from 2019 to 2033. With a focus on market size, segmentation, competitive landscape, and future growth projections, this report is an essential resource for industry stakeholders, investors, and researchers seeking actionable insights into this dynamic market. The base year for this analysis is 2025, with estimates for 2025 and a forecast period extending to 2033. The historical period covered is 2019-2024. The market is segmented by product type (Portable, Standalone) and end-user (Hospitals, Diagnostic Centers/Clinics, Other End Users). Expected market value in Million is provided throughout.
Vascular Screening Devices Market Market Structure & Competitive Dynamics
The Vascular Screening Devices market exhibits a moderately concentrated structure, with a few key players holding significant market share. The xx% market share held by the top 5 companies reflects ongoing consolidation and strategic partnerships. The innovative ecosystem is robust, driven by advancements in sensor technology, miniaturization, and telehealth integration. Stringent regulatory frameworks, particularly concerning device safety and efficacy, significantly influence market entry and product development. Substitutes for vascular screening devices include traditional diagnostic methods, but their limitations in terms of speed, accuracy, and portability drive demand for advanced screening solutions. End-user trends show a growing preference for portable and user-friendly devices, especially in diagnostic centers and clinics. Mergers and acquisitions (M&A) activities are frequent, with deal values averaging xx Million in recent years, further shaping the competitive landscape. Examples include [Specific M&A examples with deal values if available, otherwise use "xx Million" as placeholder]. The market is characterized by intense competition, with companies focusing on product differentiation, technological innovation, and strategic partnerships to maintain a competitive edge.
Vascular Screening Devices Market Industry Trends & Insights
The global Vascular Screening Devices market is experiencing robust growth, projected to reach xx Million by 2033, exhibiting a CAGR of xx% during the forecast period (2025-2033). Several factors drive this expansion. The rising prevalence of cardiovascular diseases globally fuels the demand for early and accurate screening solutions. Technological advancements, including the integration of AI and machine learning for improved diagnostic accuracy, are reshaping the market. Consumer preferences are shifting towards non-invasive, portable, and user-friendly devices. The competitive dynamics are characterized by product innovation, strategic alliances, and the expansion of distribution networks. Market penetration is increasing, particularly in emerging economies, driven by growing healthcare awareness and investment in healthcare infrastructure. Specific market segments, like portable vascular screening devices, are witnessing particularly high growth due to their convenience and portability, facilitating point-of-care diagnostics. The increasing adoption of telehealth and remote patient monitoring further contributes to the market expansion.
Dominant Markets & Segments in Vascular Screening Devices Market
The North American region currently dominates the Vascular Screening Devices market, accounting for xx% of the global market share in 2025. This dominance is primarily attributed to:
- Robust healthcare infrastructure: Extensive hospital networks and well-established diagnostic centers provide a strong foundation for market growth.
- High healthcare expenditure: Significant investments in healthcare technology and a high prevalence of cardiovascular diseases contribute to strong demand.
- Favorable regulatory environment: A relatively streamlined regulatory process for medical device approvals facilitates market entry.
The Standalone segment holds the largest share within the product type category, followed by the portable segment, largely due to its higher accuracy and comprehensive features. Among end-users, Hospitals and Diagnostic Centers/Clinics together account for the majority of market share, reflecting the crucial role of these settings in vascular screening and diagnosis. Other end-users, including smaller clinics and home-use devices, represent a growing segment.
Vascular Screening Devices Market Product Innovations
Recent years have witnessed significant advancements in vascular screening device technology. Miniaturization has led to the development of portable and handheld devices, improving accessibility and usability. The integration of advanced imaging techniques and sophisticated algorithms has enhanced diagnostic accuracy and speed. Wireless connectivity features enable remote monitoring and data sharing, improving patient management and care. These innovations cater to evolving market needs, improving patient experience and efficiency within healthcare settings. Competitive advantages are increasingly driven by technological superiority, ease of use, and integration with existing healthcare information systems.
Report Segmentation & Scope
This report segments the Vascular Screening Devices market based on product type and end-user.
Product Type:
- Portable: This segment is experiencing rapid growth, driven by the increasing demand for point-of-care diagnostics and home healthcare applications. The market size is projected to reach xx Million by 2033.
- Standalone: This segment maintains a significant market share due to its high accuracy and comprehensive features. The market size is estimated to reach xx Million by 2033.
End-User:
- Hospitals: This remains the largest segment, driven by high patient volume and the need for accurate and reliable screening tools. Market size is projected at xx Million by 2033.
- Diagnostic Centers/Clinics: This segment shows robust growth due to increasing outsourcing of diagnostic services. Projected market size is xx Million by 2033.
- Other End Users: This includes smaller clinics and home-use devices and represents a growing market segment projected at xx Million by 2033.
Key Drivers of Vascular Screening Devices Market Growth
Several key factors fuel the growth of the Vascular Screening Devices market:
- Rising prevalence of cardiovascular diseases: The global increase in cardiovascular diseases necessitates early detection and screening.
- Technological advancements: Innovations in sensor technology, AI, and miniaturization enhance diagnostic capabilities and user experience.
- Government initiatives: Government support for preventive healthcare and investment in healthcare infrastructure create a favorable market environment.
- Increasing healthcare expenditure: Higher spending on healthcare globally boosts the demand for advanced medical devices.
Challenges in the Vascular Screening Devices Market Sector
The Vascular Screening Devices market faces several challenges:
- Stringent regulatory approvals: The rigorous regulatory processes for medical device approval can delay product launches and increase costs.
- High initial investment costs: The development and manufacturing of advanced vascular screening devices requires significant upfront investment.
- Competition from established players: The market is characterized by intense competition among established companies and new entrants, impacting pricing and market share.
- Reimbursement challenges: Securing reimbursement from insurance providers can be complex, affecting market access and adoption.
Leading Players in the Vascular Screening Devices Market Market
- CorVascular Diagnostics LLC
- D E Hokanson Inc
- Fukuda
- enverdis GmbH
- OMRON HEALTHCARE Co Ltd
- Viasonix
- SMT Medical Technology GmbH
- Koven Technology Inc
- Advin Healthcare
- Collaborative Care Diagnostics LLC (Biomedix)
- Unetixs Vascular Inc
- Shenzhen Mindray Bio-Medical Electronics Co Ltd
Key Developments in Vascular Screening Devices Market Sector
- June 2022: Remington Medical introduced VascuChek, a new wireless, handheld vascular Doppler instrument, expanding the range of available portable devices.
- September 2022: Certific and PocDoc collaborated to develop a remote patient monitoring system for cardiovascular disease, leveraging telehealth for improved patient care.
Strategic Vascular Screening Devices Market Market Outlook
The Vascular Screening Devices market presents significant growth opportunities. Continued technological advancements, increasing demand for point-of-care diagnostics, and the growing adoption of telehealth are major growth accelerators. Strategic partnerships and collaborations will play a vital role in shaping the future of the market. Companies focusing on innovative product development, strong regulatory compliance, and effective distribution networks are well-positioned for success. Expansion into emerging markets and the development of cost-effective solutions will be crucial for capturing significant market share in the years to come.
Vascular Screening Devices Market Segmentation
-
1. Product Type
- 1.1. Portable
- 1.2. Standalone
-
2. End User
- 2.1. Hospitals
- 2.2. Diagnostic Centres/Clinics
- 2.3. Other End Users
Vascular Screening Devices Market Segmentation By Geography
-
1. North America
- 1.1. United States
- 1.2. Canada
- 1.3. Mexico
-
2. Europe
- 2.1. Germany
- 2.2. United Kingdom
- 2.3. France
- 2.4. Italy
- 2.5. Spain
- 2.6. Rest of Europe
-
3. Asia Pacific
- 3.1. China
- 3.2. Japan
- 3.3. India
- 3.4. Australia
- 3.5. South Korea
- 3.6. Rest of Asia Pacific
- 4. Rest of the World
Vascular Screening Devices Market REPORT HIGHLIGHTS
| Aspects | Details |
|---|---|
| Study Period | 2019-2033 |
| Base Year | 2024 |
| Estimated Year | 2025 |
| Forecast Period | 2025-2033 |
| Historical Period | 2019-2024 |
| Growth Rate | CAGR of 5.35% from 2019-2033 |
| Segmentation |
|
Table of Contents
- 1. Introduction
- 1.1. Research Scope
- 1.2. Market Segmentation
- 1.3. Research Methodology
- 1.4. Definitions and Assumptions
- 2. Executive Summary
- 2.1. Introduction
- 3. Market Dynamics
- 3.1. Introduction
- 3.2. Market Drivers
- 3.2.1. Growing Burden of Vascular Diseases; Increasing Aging Population
- 3.3. Market Restrains
- 3.3.1. Reimbursement Issues
- 3.4. Market Trends
- 3.4.1. Hospital Segment is Expected to Hold a Major Market Share in the Vascular Screening Devices Market
- 4. Market Factor Analysis
- 4.1. Porters Five Forces
- 4.2. Supply/Value Chain
- 4.3. PESTEL analysis
- 4.4. Market Entropy
- 4.5. Patent/Trademark Analysis
- 5. Global Vascular Screening Devices Market Analysis, Insights and Forecast, 2019-2031
- 5.1. Market Analysis, Insights and Forecast - by Product Type
- 5.1.1. Portable
- 5.1.2. Standalone
- 5.2. Market Analysis, Insights and Forecast - by End User
- 5.2.1. Hospitals
- 5.2.2. Diagnostic Centres/Clinics
- 5.2.3. Other End Users
- 5.3. Market Analysis, Insights and Forecast - by Region
- 5.3.1. North America
- 5.3.2. Europe
- 5.3.3. Asia Pacific
- 5.3.4. Rest of the World
- 5.1. Market Analysis, Insights and Forecast - by Product Type
- 6. North America Vascular Screening Devices Market Analysis, Insights and Forecast, 2019-2031
- 6.1. Market Analysis, Insights and Forecast - by Product Type
- 6.1.1. Portable
- 6.1.2. Standalone
- 6.2. Market Analysis, Insights and Forecast - by End User
- 6.2.1. Hospitals
- 6.2.2. Diagnostic Centres/Clinics
- 6.2.3. Other End Users
- 6.1. Market Analysis, Insights and Forecast - by Product Type
- 7. Europe Vascular Screening Devices Market Analysis, Insights and Forecast, 2019-2031
- 7.1. Market Analysis, Insights and Forecast - by Product Type
- 7.1.1. Portable
- 7.1.2. Standalone
- 7.2. Market Analysis, Insights and Forecast - by End User
- 7.2.1. Hospitals
- 7.2.2. Diagnostic Centres/Clinics
- 7.2.3. Other End Users
- 7.1. Market Analysis, Insights and Forecast - by Product Type
- 8. Asia Pacific Vascular Screening Devices Market Analysis, Insights and Forecast, 2019-2031
- 8.1. Market Analysis, Insights and Forecast - by Product Type
- 8.1.1. Portable
- 8.1.2. Standalone
- 8.2. Market Analysis, Insights and Forecast - by End User
- 8.2.1. Hospitals
- 8.2.2. Diagnostic Centres/Clinics
- 8.2.3. Other End Users
- 8.1. Market Analysis, Insights and Forecast - by Product Type
- 9. Rest of the World Vascular Screening Devices Market Analysis, Insights and Forecast, 2019-2031
- 9.1. Market Analysis, Insights and Forecast - by Product Type
- 9.1.1. Portable
- 9.1.2. Standalone
- 9.2. Market Analysis, Insights and Forecast - by End User
- 9.2.1. Hospitals
- 9.2.2. Diagnostic Centres/Clinics
- 9.2.3. Other End Users
- 9.1. Market Analysis, Insights and Forecast - by Product Type
- 10. North America Vascular Screening Devices Market Analysis, Insights and Forecast, 2019-2031
- 10.1. Market Analysis, Insights and Forecast - By Country/Sub-region
- 10.1.1 United States
- 10.1.2 Canada
- 10.1.3 Mexico
- 11. Europe Vascular Screening Devices Market Analysis, Insights and Forecast, 2019-2031
- 11.1. Market Analysis, Insights and Forecast - By Country/Sub-region
- 11.1.1 Germany
- 11.1.2 United Kingdom
- 11.1.3 France
- 11.1.4 Spain
- 11.1.5 Italy
- 11.1.6 Spain
- 11.1.7 Belgium
- 11.1.8 Netherland
- 11.1.9 Nordics
- 11.1.10 Rest of Europe
- 12. Asia Pacific Vascular Screening Devices Market Analysis, Insights and Forecast, 2019-2031
- 12.1. Market Analysis, Insights and Forecast - By Country/Sub-region
- 12.1.1 China
- 12.1.2 Japan
- 12.1.3 India
- 12.1.4 South Korea
- 12.1.5 Southeast Asia
- 12.1.6 Australia
- 12.1.7 Indonesia
- 12.1.8 Phillipes
- 12.1.9 Singapore
- 12.1.10 Thailandc
- 12.1.11 Rest of Asia Pacific
- 13. South America Vascular Screening Devices Market Analysis, Insights and Forecast, 2019-2031
- 13.1. Market Analysis, Insights and Forecast - By Country/Sub-region
- 13.1.1 Brazil
- 13.1.2 Argentina
- 13.1.3 Peru
- 13.1.4 Chile
- 13.1.5 Colombia
- 13.1.6 Ecuador
- 13.1.7 Venezuela
- 13.1.8 Rest of South America
- 14. MEA Vascular Screening Devices Market Analysis, Insights and Forecast, 2019-2031
- 14.1. Market Analysis, Insights and Forecast - By Country/Sub-region
- 14.1.1 United Arab Emirates
- 14.1.2 Saudi Arabia
- 14.1.3 South Africa
- 14.1.4 Rest of Middle East and Africa
- 15. Competitive Analysis
- 15.1. Global Market Share Analysis 2024
- 15.2. Company Profiles
- 15.2.1 CorVascular Diagnostics LLC
- 15.2.1.1. Overview
- 15.2.1.2. Products
- 15.2.1.3. SWOT Analysis
- 15.2.1.4. Recent Developments
- 15.2.1.5. Financials (Based on Availability)
- 15.2.2 D E Hokanson Inc
- 15.2.2.1. Overview
- 15.2.2.2. Products
- 15.2.2.3. SWOT Analysis
- 15.2.2.4. Recent Developments
- 15.2.2.5. Financials (Based on Availability)
- 15.2.3 Fukuda
- 15.2.3.1. Overview
- 15.2.3.2. Products
- 15.2.3.3. SWOT Analysis
- 15.2.3.4. Recent Developments
- 15.2.3.5. Financials (Based on Availability)
- 15.2.4 enverdis GmbH
- 15.2.4.1. Overview
- 15.2.4.2. Products
- 15.2.4.3. SWOT Analysis
- 15.2.4.4. Recent Developments
- 15.2.4.5. Financials (Based on Availability)
- 15.2.5 OMRON HEALTHCARE Co Ltd
- 15.2.5.1. Overview
- 15.2.5.2. Products
- 15.2.5.3. SWOT Analysis
- 15.2.5.4. Recent Developments
- 15.2.5.5. Financials (Based on Availability)
- 15.2.6 Viasonix
- 15.2.6.1. Overview
- 15.2.6.2. Products
- 15.2.6.3. SWOT Analysis
- 15.2.6.4. Recent Developments
- 15.2.6.5. Financials (Based on Availability)
- 15.2.7 SMT Medical Technology GmbH
- 15.2.7.1. Overview
- 15.2.7.2. Products
- 15.2.7.3. SWOT Analysis
- 15.2.7.4. Recent Developments
- 15.2.7.5. Financials (Based on Availability)
- 15.2.8 Koven Technology Inc
- 15.2.8.1. Overview
- 15.2.8.2. Products
- 15.2.8.3. SWOT Analysis
- 15.2.8.4. Recent Developments
- 15.2.8.5. Financials (Based on Availability)
- 15.2.9 Advin Healthcare
- 15.2.9.1. Overview
- 15.2.9.2. Products
- 15.2.9.3. SWOT Analysis
- 15.2.9.4. Recent Developments
- 15.2.9.5. Financials (Based on Availability)
- 15.2.10 Collaborative Care Diagnostics LLC (Biomedix)
- 15.2.10.1. Overview
- 15.2.10.2. Products
- 15.2.10.3. SWOT Analysis
- 15.2.10.4. Recent Developments
- 15.2.10.5. Financials (Based on Availability)
- 15.2.11 Unetixs Vascular Inc
- 15.2.11.1. Overview
- 15.2.11.2. Products
- 15.2.11.3. SWOT Analysis
- 15.2.11.4. Recent Developments
- 15.2.11.5. Financials (Based on Availability)
- 15.2.12 Shenzhen Mindray Bio-Medical Electronics Co Ltd
- 15.2.12.1. Overview
- 15.2.12.2. Products
- 15.2.12.3. SWOT Analysis
- 15.2.12.4. Recent Developments
- 15.2.12.5. Financials (Based on Availability)
- 15.2.1 CorVascular Diagnostics LLC
List of Figures
- Figure 1: Global Vascular Screening Devices Market Revenue Breakdown (Million, %) by Region 2024 & 2032
- Figure 2: Global Vascular Screening Devices Market Volume Breakdown (K Unit, %) by Region 2024 & 2032
- Figure 3: North America Vascular Screening Devices Market Revenue (Million), by Country 2024 & 2032
- Figure 4: North America Vascular Screening Devices Market Volume (K Unit), by Country 2024 & 2032
- Figure 5: North America Vascular Screening Devices Market Revenue Share (%), by Country 2024 & 2032
- Figure 6: North America Vascular Screening Devices Market Volume Share (%), by Country 2024 & 2032
- Figure 7: Europe Vascular Screening Devices Market Revenue (Million), by Country 2024 & 2032
- Figure 8: Europe Vascular Screening Devices Market Volume (K Unit), by Country 2024 & 2032
- Figure 9: Europe Vascular Screening Devices Market Revenue Share (%), by Country 2024 & 2032
- Figure 10: Europe Vascular Screening Devices Market Volume Share (%), by Country 2024 & 2032
- Figure 11: Asia Pacific Vascular Screening Devices Market Revenue (Million), by Country 2024 & 2032
- Figure 12: Asia Pacific Vascular Screening Devices Market Volume (K Unit), by Country 2024 & 2032
- Figure 13: Asia Pacific Vascular Screening Devices Market Revenue Share (%), by Country 2024 & 2032
- Figure 14: Asia Pacific Vascular Screening Devices Market Volume Share (%), by Country 2024 & 2032
- Figure 15: South America Vascular Screening Devices Market Revenue (Million), by Country 2024 & 2032
- Figure 16: South America Vascular Screening Devices Market Volume (K Unit), by Country 2024 & 2032
- Figure 17: South America Vascular Screening Devices Market Revenue Share (%), by Country 2024 & 2032
- Figure 18: South America Vascular Screening Devices Market Volume Share (%), by Country 2024 & 2032
- Figure 19: MEA Vascular Screening Devices Market Revenue (Million), by Country 2024 & 2032
- Figure 20: MEA Vascular Screening Devices Market Volume (K Unit), by Country 2024 & 2032
- Figure 21: MEA Vascular Screening Devices Market Revenue Share (%), by Country 2024 & 2032
- Figure 22: MEA Vascular Screening Devices Market Volume Share (%), by Country 2024 & 2032
- Figure 23: North America Vascular Screening Devices Market Revenue (Million), by Product Type 2024 & 2032
- Figure 24: North America Vascular Screening Devices Market Volume (K Unit), by Product Type 2024 & 2032
- Figure 25: North America Vascular Screening Devices Market Revenue Share (%), by Product Type 2024 & 2032
- Figure 26: North America Vascular Screening Devices Market Volume Share (%), by Product Type 2024 & 2032
- Figure 27: North America Vascular Screening Devices Market Revenue (Million), by End User 2024 & 2032
- Figure 28: North America Vascular Screening Devices Market Volume (K Unit), by End User 2024 & 2032
- Figure 29: North America Vascular Screening Devices Market Revenue Share (%), by End User 2024 & 2032
- Figure 30: North America Vascular Screening Devices Market Volume Share (%), by End User 2024 & 2032
- Figure 31: North America Vascular Screening Devices Market Revenue (Million), by Country 2024 & 2032
- Figure 32: North America Vascular Screening Devices Market Volume (K Unit), by Country 2024 & 2032
- Figure 33: North America Vascular Screening Devices Market Revenue Share (%), by Country 2024 & 2032
- Figure 34: North America Vascular Screening Devices Market Volume Share (%), by Country 2024 & 2032
- Figure 35: Europe Vascular Screening Devices Market Revenue (Million), by Product Type 2024 & 2032
- Figure 36: Europe Vascular Screening Devices Market Volume (K Unit), by Product Type 2024 & 2032
- Figure 37: Europe Vascular Screening Devices Market Revenue Share (%), by Product Type 2024 & 2032
- Figure 38: Europe Vascular Screening Devices Market Volume Share (%), by Product Type 2024 & 2032
- Figure 39: Europe Vascular Screening Devices Market Revenue (Million), by End User 2024 & 2032
- Figure 40: Europe Vascular Screening Devices Market Volume (K Unit), by End User 2024 & 2032
- Figure 41: Europe Vascular Screening Devices Market Revenue Share (%), by End User 2024 & 2032
- Figure 42: Europe Vascular Screening Devices Market Volume Share (%), by End User 2024 & 2032
- Figure 43: Europe Vascular Screening Devices Market Revenue (Million), by Country 2024 & 2032
- Figure 44: Europe Vascular Screening Devices Market Volume (K Unit), by Country 2024 & 2032
- Figure 45: Europe Vascular Screening Devices Market Revenue Share (%), by Country 2024 & 2032
- Figure 46: Europe Vascular Screening Devices Market Volume Share (%), by Country 2024 & 2032
- Figure 47: Asia Pacific Vascular Screening Devices Market Revenue (Million), by Product Type 2024 & 2032
- Figure 48: Asia Pacific Vascular Screening Devices Market Volume (K Unit), by Product Type 2024 & 2032
- Figure 49: Asia Pacific Vascular Screening Devices Market Revenue Share (%), by Product Type 2024 & 2032
- Figure 50: Asia Pacific Vascular Screening Devices Market Volume Share (%), by Product Type 2024 & 2032
- Figure 51: Asia Pacific Vascular Screening Devices Market Revenue (Million), by End User 2024 & 2032
- Figure 52: Asia Pacific Vascular Screening Devices Market Volume (K Unit), by End User 2024 & 2032
- Figure 53: Asia Pacific Vascular Screening Devices Market Revenue Share (%), by End User 2024 & 2032
- Figure 54: Asia Pacific Vascular Screening Devices Market Volume Share (%), by End User 2024 & 2032
- Figure 55: Asia Pacific Vascular Screening Devices Market Revenue (Million), by Country 2024 & 2032
- Figure 56: Asia Pacific Vascular Screening Devices Market Volume (K Unit), by Country 2024 & 2032
- Figure 57: Asia Pacific Vascular Screening Devices Market Revenue Share (%), by Country 2024 & 2032
- Figure 58: Asia Pacific Vascular Screening Devices Market Volume Share (%), by Country 2024 & 2032
- Figure 59: Rest of the World Vascular Screening Devices Market Revenue (Million), by Product Type 2024 & 2032
- Figure 60: Rest of the World Vascular Screening Devices Market Volume (K Unit), by Product Type 2024 & 2032
- Figure 61: Rest of the World Vascular Screening Devices Market Revenue Share (%), by Product Type 2024 & 2032
- Figure 62: Rest of the World Vascular Screening Devices Market Volume Share (%), by Product Type 2024 & 2032
- Figure 63: Rest of the World Vascular Screening Devices Market Revenue (Million), by End User 2024 & 2032
- Figure 64: Rest of the World Vascular Screening Devices Market Volume (K Unit), by End User 2024 & 2032
- Figure 65: Rest of the World Vascular Screening Devices Market Revenue Share (%), by End User 2024 & 2032
- Figure 66: Rest of the World Vascular Screening Devices Market Volume Share (%), by End User 2024 & 2032
- Figure 67: Rest of the World Vascular Screening Devices Market Revenue (Million), by Country 2024 & 2032
- Figure 68: Rest of the World Vascular Screening Devices Market Volume (K Unit), by Country 2024 & 2032
- Figure 69: Rest of the World Vascular Screening Devices Market Revenue Share (%), by Country 2024 & 2032
- Figure 70: Rest of the World Vascular Screening Devices Market Volume Share (%), by Country 2024 & 2032
List of Tables
- Table 1: Global Vascular Screening Devices Market Revenue Million Forecast, by Region 2019 & 2032
- Table 2: Global Vascular Screening Devices Market Volume K Unit Forecast, by Region 2019 & 2032
- Table 3: Global Vascular Screening Devices Market Revenue Million Forecast, by Product Type 2019 & 2032
- Table 4: Global Vascular Screening Devices Market Volume K Unit Forecast, by Product Type 2019 & 2032
- Table 5: Global Vascular Screening Devices Market Revenue Million Forecast, by End User 2019 & 2032
- Table 6: Global Vascular Screening Devices Market Volume K Unit Forecast, by End User 2019 & 2032
- Table 7: Global Vascular Screening Devices Market Revenue Million Forecast, by Region 2019 & 2032
- Table 8: Global Vascular Screening Devices Market Volume K Unit Forecast, by Region 2019 & 2032
- Table 9: Global Vascular Screening Devices Market Revenue Million Forecast, by Country 2019 & 2032
- Table 10: Global Vascular Screening Devices Market Volume K Unit Forecast, by Country 2019 & 2032
- Table 11: United States Vascular Screening Devices Market Revenue (Million) Forecast, by Application 2019 & 2032
- Table 12: United States Vascular Screening Devices Market Volume (K Unit) Forecast, by Application 2019 & 2032
- Table 13: Canada Vascular Screening Devices Market Revenue (Million) Forecast, by Application 2019 & 2032
- Table 14: Canada Vascular Screening Devices Market Volume (K Unit) Forecast, by Application 2019 & 2032
- Table 15: Mexico Vascular Screening Devices Market Revenue (Million) Forecast, by Application 2019 & 2032
- Table 16: Mexico Vascular Screening Devices Market Volume (K Unit) Forecast, by Application 2019 & 2032
- Table 17: Global Vascular Screening Devices Market Revenue Million Forecast, by Country 2019 & 2032
- Table 18: Global Vascular Screening Devices Market Volume K Unit Forecast, by Country 2019 & 2032
- Table 19: Germany Vascular Screening Devices Market Revenue (Million) Forecast, by Application 2019 & 2032
- Table 20: Germany Vascular Screening Devices Market Volume (K Unit) Forecast, by Application 2019 & 2032
- Table 21: United Kingdom Vascular Screening Devices Market Revenue (Million) Forecast, by Application 2019 & 2032
- Table 22: United Kingdom Vascular Screening Devices Market Volume (K Unit) Forecast, by Application 2019 & 2032
- Table 23: France Vascular Screening Devices Market Revenue (Million) Forecast, by Application 2019 & 2032
- Table 24: France Vascular Screening Devices Market Volume (K Unit) Forecast, by Application 2019 & 2032
- Table 25: Spain Vascular Screening Devices Market Revenue (Million) Forecast, by Application 2019 & 2032
- Table 26: Spain Vascular Screening Devices Market Volume (K Unit) Forecast, by Application 2019 & 2032
- Table 27: Italy Vascular Screening Devices Market Revenue (Million) Forecast, by Application 2019 & 2032
- Table 28: Italy Vascular Screening Devices Market Volume (K Unit) Forecast, by Application 2019 & 2032
- Table 29: Spain Vascular Screening Devices Market Revenue (Million) Forecast, by Application 2019 & 2032
- Table 30: Spain Vascular Screening Devices Market Volume (K Unit) Forecast, by Application 2019 & 2032
- Table 31: Belgium Vascular Screening Devices Market Revenue (Million) Forecast, by Application 2019 & 2032
- Table 32: Belgium Vascular Screening Devices Market Volume (K Unit) Forecast, by Application 2019 & 2032
- Table 33: Netherland Vascular Screening Devices Market Revenue (Million) Forecast, by Application 2019 & 2032
- Table 34: Netherland Vascular Screening Devices Market Volume (K Unit) Forecast, by Application 2019 & 2032
- Table 35: Nordics Vascular Screening Devices Market Revenue (Million) Forecast, by Application 2019 & 2032
- Table 36: Nordics Vascular Screening Devices Market Volume (K Unit) Forecast, by Application 2019 & 2032
- Table 37: Rest of Europe Vascular Screening Devices Market Revenue (Million) Forecast, by Application 2019 & 2032
- Table 38: Rest of Europe Vascular Screening Devices Market Volume (K Unit) Forecast, by Application 2019 & 2032
- Table 39: Global Vascular Screening Devices Market Revenue Million Forecast, by Country 2019 & 2032
- Table 40: Global Vascular Screening Devices Market Volume K Unit Forecast, by Country 2019 & 2032
- Table 41: China Vascular Screening Devices Market Revenue (Million) Forecast, by Application 2019 & 2032
- Table 42: China Vascular Screening Devices Market Volume (K Unit) Forecast, by Application 2019 & 2032
- Table 43: Japan Vascular Screening Devices Market Revenue (Million) Forecast, by Application 2019 & 2032
- Table 44: Japan Vascular Screening Devices Market Volume (K Unit) Forecast, by Application 2019 & 2032
- Table 45: India Vascular Screening Devices Market Revenue (Million) Forecast, by Application 2019 & 2032
- Table 46: India Vascular Screening Devices Market Volume (K Unit) Forecast, by Application 2019 & 2032
- Table 47: South Korea Vascular Screening Devices Market Revenue (Million) Forecast, by Application 2019 & 2032
- Table 48: South Korea Vascular Screening Devices Market Volume (K Unit) Forecast, by Application 2019 & 2032
- Table 49: Southeast Asia Vascular Screening Devices Market Revenue (Million) Forecast, by Application 2019 & 2032
- Table 50: Southeast Asia Vascular Screening Devices Market Volume (K Unit) Forecast, by Application 2019 & 2032
- Table 51: Australia Vascular Screening Devices Market Revenue (Million) Forecast, by Application 2019 & 2032
- Table 52: Australia Vascular Screening Devices Market Volume (K Unit) Forecast, by Application 2019 & 2032
- Table 53: Indonesia Vascular Screening Devices Market Revenue (Million) Forecast, by Application 2019 & 2032
- Table 54: Indonesia Vascular Screening Devices Market Volume (K Unit) Forecast, by Application 2019 & 2032
- Table 55: Phillipes Vascular Screening Devices Market Revenue (Million) Forecast, by Application 2019 & 2032
- Table 56: Phillipes Vascular Screening Devices Market Volume (K Unit) Forecast, by Application 2019 & 2032
- Table 57: Singapore Vascular Screening Devices Market Revenue (Million) Forecast, by Application 2019 & 2032
- Table 58: Singapore Vascular Screening Devices Market Volume (K Unit) Forecast, by Application 2019 & 2032
- Table 59: Thailandc Vascular Screening Devices Market Revenue (Million) Forecast, by Application 2019 & 2032
- Table 60: Thailandc Vascular Screening Devices Market Volume (K Unit) Forecast, by Application 2019 & 2032
- Table 61: Rest of Asia Pacific Vascular Screening Devices Market Revenue (Million) Forecast, by Application 2019 & 2032
- Table 62: Rest of Asia Pacific Vascular Screening Devices Market Volume (K Unit) Forecast, by Application 2019 & 2032
- Table 63: Global Vascular Screening Devices Market Revenue Million Forecast, by Country 2019 & 2032
- Table 64: Global Vascular Screening Devices Market Volume K Unit Forecast, by Country 2019 & 2032
- Table 65: Brazil Vascular Screening Devices Market Revenue (Million) Forecast, by Application 2019 & 2032
- Table 66: Brazil Vascular Screening Devices Market Volume (K Unit) Forecast, by Application 2019 & 2032
- Table 67: Argentina Vascular Screening Devices Market Revenue (Million) Forecast, by Application 2019 & 2032
- Table 68: Argentina Vascular Screening Devices Market Volume (K Unit) Forecast, by Application 2019 & 2032
- Table 69: Peru Vascular Screening Devices Market Revenue (Million) Forecast, by Application 2019 & 2032
- Table 70: Peru Vascular Screening Devices Market Volume (K Unit) Forecast, by Application 2019 & 2032
- Table 71: Chile Vascular Screening Devices Market Revenue (Million) Forecast, by Application 2019 & 2032
- Table 72: Chile Vascular Screening Devices Market Volume (K Unit) Forecast, by Application 2019 & 2032
- Table 73: Colombia Vascular Screening Devices Market Revenue (Million) Forecast, by Application 2019 & 2032
- Table 74: Colombia Vascular Screening Devices Market Volume (K Unit) Forecast, by Application 2019 & 2032
- Table 75: Ecuador Vascular Screening Devices Market Revenue (Million) Forecast, by Application 2019 & 2032
- Table 76: Ecuador Vascular Screening Devices Market Volume (K Unit) Forecast, by Application 2019 & 2032
- Table 77: Venezuela Vascular Screening Devices Market Revenue (Million) Forecast, by Application 2019 & 2032
- Table 78: Venezuela Vascular Screening Devices Market Volume (K Unit) Forecast, by Application 2019 & 2032
- Table 79: Rest of South America Vascular Screening Devices Market Revenue (Million) Forecast, by Application 2019 & 2032
- Table 80: Rest of South America Vascular Screening Devices Market Volume (K Unit) Forecast, by Application 2019 & 2032
- Table 81: Global Vascular Screening Devices Market Revenue Million Forecast, by Country 2019 & 2032
- Table 82: Global Vascular Screening Devices Market Volume K Unit Forecast, by Country 2019 & 2032
- Table 83: United Arab Emirates Vascular Screening Devices Market Revenue (Million) Forecast, by Application 2019 & 2032
- Table 84: United Arab Emirates Vascular Screening Devices Market Volume (K Unit) Forecast, by Application 2019 & 2032
- Table 85: Saudi Arabia Vascular Screening Devices Market Revenue (Million) Forecast, by Application 2019 & 2032
- Table 86: Saudi Arabia Vascular Screening Devices Market Volume (K Unit) Forecast, by Application 2019 & 2032
- Table 87: South Africa Vascular Screening Devices Market Revenue (Million) Forecast, by Application 2019 & 2032
- Table 88: South Africa Vascular Screening Devices Market Volume (K Unit) Forecast, by Application 2019 & 2032
- Table 89: Rest of Middle East and Africa Vascular Screening Devices Market Revenue (Million) Forecast, by Application 2019 & 2032
- Table 90: Rest of Middle East and Africa Vascular Screening Devices Market Volume (K Unit) Forecast, by Application 2019 & 2032
- Table 91: Global Vascular Screening Devices Market Revenue Million Forecast, by Product Type 2019 & 2032
- Table 92: Global Vascular Screening Devices Market Volume K Unit Forecast, by Product Type 2019 & 2032
- Table 93: Global Vascular Screening Devices Market Revenue Million Forecast, by End User 2019 & 2032
- Table 94: Global Vascular Screening Devices Market Volume K Unit Forecast, by End User 2019 & 2032
- Table 95: Global Vascular Screening Devices Market Revenue Million Forecast, by Country 2019 & 2032
- Table 96: Global Vascular Screening Devices Market Volume K Unit Forecast, by Country 2019 & 2032
- Table 97: United States Vascular Screening Devices Market Revenue (Million) Forecast, by Application 2019 & 2032
- Table 98: United States Vascular Screening Devices Market Volume (K Unit) Forecast, by Application 2019 & 2032
- Table 99: Canada Vascular Screening Devices Market Revenue (Million) Forecast, by Application 2019 & 2032
- Table 100: Canada Vascular Screening Devices Market Volume (K Unit) Forecast, by Application 2019 & 2032
- Table 101: Mexico Vascular Screening Devices Market Revenue (Million) Forecast, by Application 2019 & 2032
- Table 102: Mexico Vascular Screening Devices Market Volume (K Unit) Forecast, by Application 2019 & 2032
- Table 103: Global Vascular Screening Devices Market Revenue Million Forecast, by Product Type 2019 & 2032
- Table 104: Global Vascular Screening Devices Market Volume K Unit Forecast, by Product Type 2019 & 2032
- Table 105: Global Vascular Screening Devices Market Revenue Million Forecast, by End User 2019 & 2032
- Table 106: Global Vascular Screening Devices Market Volume K Unit Forecast, by End User 2019 & 2032
- Table 107: Global Vascular Screening Devices Market Revenue Million Forecast, by Country 2019 & 2032
- Table 108: Global Vascular Screening Devices Market Volume K Unit Forecast, by Country 2019 & 2032
- Table 109: Germany Vascular Screening Devices Market Revenue (Million) Forecast, by Application 2019 & 2032
- Table 110: Germany Vascular Screening Devices Market Volume (K Unit) Forecast, by Application 2019 & 2032
- Table 111: United Kingdom Vascular Screening Devices Market Revenue (Million) Forecast, by Application 2019 & 2032
- Table 112: United Kingdom Vascular Screening Devices Market Volume (K Unit) Forecast, by Application 2019 & 2032
- Table 113: France Vascular Screening Devices Market Revenue (Million) Forecast, by Application 2019 & 2032
- Table 114: France Vascular Screening Devices Market Volume (K Unit) Forecast, by Application 2019 & 2032
- Table 115: Italy Vascular Screening Devices Market Revenue (Million) Forecast, by Application 2019 & 2032
- Table 116: Italy Vascular Screening Devices Market Volume (K Unit) Forecast, by Application 2019 & 2032
- Table 117: Spain Vascular Screening Devices Market Revenue (Million) Forecast, by Application 2019 & 2032
- Table 118: Spain Vascular Screening Devices Market Volume (K Unit) Forecast, by Application 2019 & 2032
- Table 119: Rest of Europe Vascular Screening Devices Market Revenue (Million) Forecast, by Application 2019 & 2032
- Table 120: Rest of Europe Vascular Screening Devices Market Volume (K Unit) Forecast, by Application 2019 & 2032
- Table 121: Global Vascular Screening Devices Market Revenue Million Forecast, by Product Type 2019 & 2032
- Table 122: Global Vascular Screening Devices Market Volume K Unit Forecast, by Product Type 2019 & 2032
- Table 123: Global Vascular Screening Devices Market Revenue Million Forecast, by End User 2019 & 2032
- Table 124: Global Vascular Screening Devices Market Volume K Unit Forecast, by End User 2019 & 2032
- Table 125: Global Vascular Screening Devices Market Revenue Million Forecast, by Country 2019 & 2032
- Table 126: Global Vascular Screening Devices Market Volume K Unit Forecast, by Country 2019 & 2032
- Table 127: China Vascular Screening Devices Market Revenue (Million) Forecast, by Application 2019 & 2032
- Table 128: China Vascular Screening Devices Market Volume (K Unit) Forecast, by Application 2019 & 2032
- Table 129: Japan Vascular Screening Devices Market Revenue (Million) Forecast, by Application 2019 & 2032
- Table 130: Japan Vascular Screening Devices Market Volume (K Unit) Forecast, by Application 2019 & 2032
- Table 131: India Vascular Screening Devices Market Revenue (Million) Forecast, by Application 2019 & 2032
- Table 132: India Vascular Screening Devices Market Volume (K Unit) Forecast, by Application 2019 & 2032
- Table 133: Australia Vascular Screening Devices Market Revenue (Million) Forecast, by Application 2019 & 2032
- Table 134: Australia Vascular Screening Devices Market Volume (K Unit) Forecast, by Application 2019 & 2032
- Table 135: South Korea Vascular Screening Devices Market Revenue (Million) Forecast, by Application 2019 & 2032
- Table 136: South Korea Vascular Screening Devices Market Volume (K Unit) Forecast, by Application 2019 & 2032
- Table 137: Rest of Asia Pacific Vascular Screening Devices Market Revenue (Million) Forecast, by Application 2019 & 2032
- Table 138: Rest of Asia Pacific Vascular Screening Devices Market Volume (K Unit) Forecast, by Application 2019 & 2032
- Table 139: Global Vascular Screening Devices Market Revenue Million Forecast, by Product Type 2019 & 2032
- Table 140: Global Vascular Screening Devices Market Volume K Unit Forecast, by Product Type 2019 & 2032
- Table 141: Global Vascular Screening Devices Market Revenue Million Forecast, by End User 2019 & 2032
- Table 142: Global Vascular Screening Devices Market Volume K Unit Forecast, by End User 2019 & 2032
- Table 143: Global Vascular Screening Devices Market Revenue Million Forecast, by Country 2019 & 2032
- Table 144: Global Vascular Screening Devices Market Volume K Unit Forecast, by Country 2019 & 2032
Frequently Asked Questions
1. What is the projected Compound Annual Growth Rate (CAGR) of the Vascular Screening Devices Market?
The projected CAGR is approximately 5.35%.
2. Which companies are prominent players in the Vascular Screening Devices Market?
Key companies in the market include CorVascular Diagnostics LLC, D E Hokanson Inc, Fukuda, enverdis GmbH, OMRON HEALTHCARE Co Ltd, Viasonix, SMT Medical Technology GmbH, Koven Technology Inc, Advin Healthcare, Collaborative Care Diagnostics LLC (Biomedix), Unetixs Vascular Inc, Shenzhen Mindray Bio-Medical Electronics Co Ltd.
3. What are the main segments of the Vascular Screening Devices Market?
The market segments include Product Type, End User.
4. Can you provide details about the market size?
The market size is estimated to be USD 1.74 Million as of 2022.
5. What are some drivers contributing to market growth?
Growing Burden of Vascular Diseases; Increasing Aging Population.
6. What are the notable trends driving market growth?
Hospital Segment is Expected to Hold a Major Market Share in the Vascular Screening Devices Market.
7. Are there any restraints impacting market growth?
Reimbursement Issues.
8. Can you provide examples of recent developments in the market?
September 2022: Certific and PocDoc, two health tech startups, launched a collaboration to combat cardiovascular disease. The partnership will enable patients to remotely monitor their blood pressure, body mass index (BMI), and quantitative cholesterol levels using the same user interface.
9. What pricing options are available for accessing the report?
Pricing options include single-user, multi-user, and enterprise licenses priced at USD 4750, USD 5250, and USD 8750 respectively.
10. Is the market size provided in terms of value or volume?
The market size is provided in terms of value, measured in Million and volume, measured in K Unit.
11. Are there any specific market keywords associated with the report?
Yes, the market keyword associated with the report is "Vascular Screening Devices Market," which aids in identifying and referencing the specific market segment covered.
12. How do I determine which pricing option suits my needs best?
The pricing options vary based on user requirements and access needs. Individual users may opt for single-user licenses, while businesses requiring broader access may choose multi-user or enterprise licenses for cost-effective access to the report.
13. Are there any additional resources or data provided in the Vascular Screening Devices Market report?
While the report offers comprehensive insights, it's advisable to review the specific contents or supplementary materials provided to ascertain if additional resources or data are available.
14. How can I stay updated on further developments or reports in the Vascular Screening Devices Market?
To stay informed about further developments, trends, and reports in the Vascular Screening Devices Market, consider subscribing to industry newsletters, following relevant companies and organizations, or regularly checking reputable industry news sources and publications.
Methodology
Step 1 - Identification of Relevant Samples Size from Population Database


Step 2 - Approaches for Defining Global Market Size (Value, Volume* & Price*)

Note*: In applicable scenarios
Step 3 - Data Sources
Primary Research
- Web Analytics
- Survey Reports
- Research Institute
- Latest Research Reports
- Opinion Leaders
Secondary Research
- Annual Reports
- White Paper
- Latest Press Release
- Industry Association
- Paid Database
- Investor Presentations

Step 4 - Data Triangulation
Involves using different sources of information in order to increase the validity of a study
These sources are likely to be stakeholders in a program - participants, other researchers, program staff, other community members, and so on.
Then we put all data in single framework & apply various statistical tools to find out the dynamic on the market.
During the analysis stage, feedback from the stakeholder groups would be compared to determine areas of agreement as well as areas of divergence


