

Key Insights
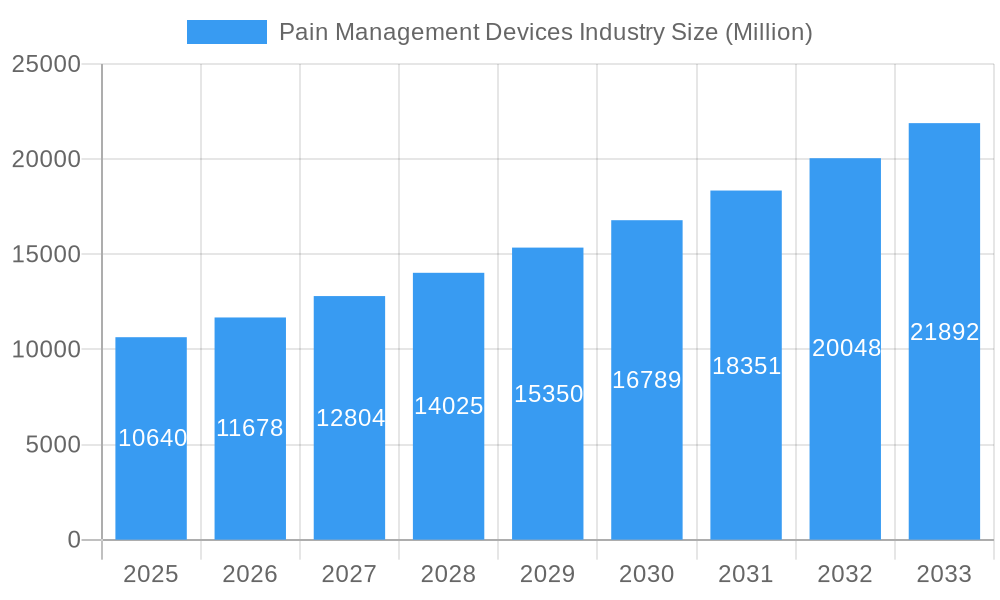
The global Pain Management Devices market is poised for robust expansion, projected to reach a significant valuation of $10.64 billion with an impressive Compound Annual Growth Rate (CAGR) of 9.70% during the forecast period of 2025-2033. This substantial growth is primarily fueled by an increasing prevalence of chronic pain conditions, including musculoskeletal disorders, neuropathic pain, and cancer-related pain, driven by an aging global population and rising lifestyle-related health issues. Advancements in medical technology are continuously introducing innovative and minimally invasive pain management solutions, such as sophisticated neurostimulation devices and advanced ablation technologies, which are further stimulating market demand. The growing awareness among patients and healthcare providers regarding the efficacy of these devices in improving quality of life and reducing reliance on opioid medications is a critical market driver. Furthermore, expanding healthcare infrastructure and increased healthcare spending in emerging economies are creating new avenues for market penetration and growth for pain management device manufacturers.
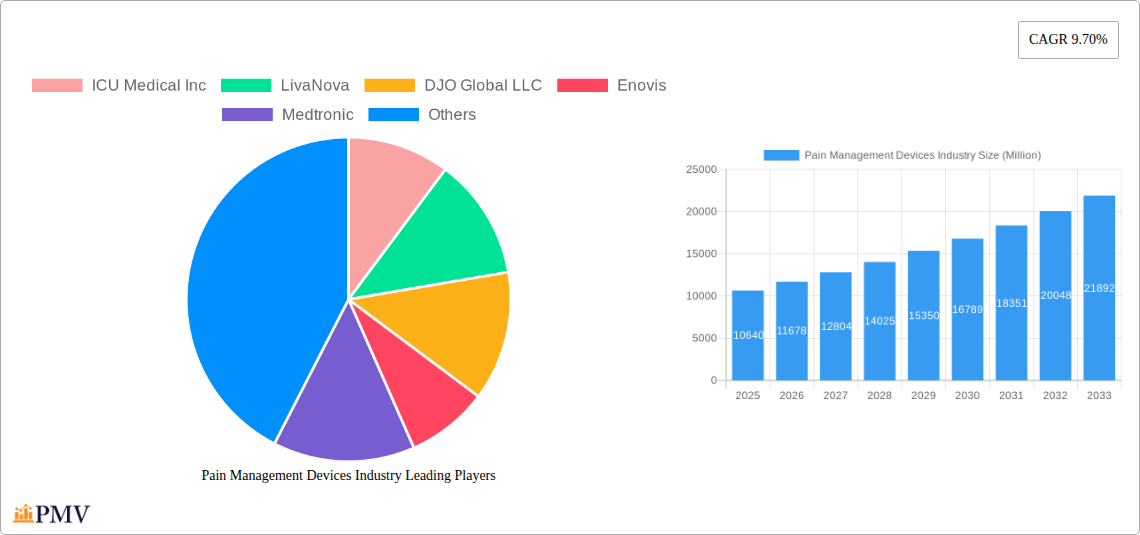
Pain Management Devices Industry Market Size (In Billion)
The market is segmented across various product types, with Neurostimulation Devices and Infusion Pumps expected to dominate due to their established efficacy and evolving technological capabilities. Application-wise, Musculoskeletal, Neuropathic Pain, and Cancer Pain segments are anticipated to witness the highest demand, reflecting the most prevalent chronic pain conditions. Hospitals and Clinics, alongside Physiotherapy Centers, represent the primary end-user segments, indicating a strong preference for professional medical settings for pain management interventions. Geographically, North America is expected to maintain its leadership position, driven by high healthcare expenditure, advanced technological adoption, and a strong presence of key market players. However, the Asia Pacific region is projected to exhibit the fastest growth rate, fueled by a burgeoning patient population, increasing disposable incomes, and improving healthcare access, presenting significant opportunities for market expansion and investment in the coming years.
Pain Management Devices Industry Company Market Share
Pain Management Devices Industry Market Structure & Competitive Dynamics
The global Pain Management Devices Industry exhibits a moderately concentrated market structure, characterized by the strategic presence of both established multinational corporations and emerging innovators. Key players like Medtronic, Abbott, and Stryker command significant market share, driven by extensive R&D investments and broad product portfolios. The innovation ecosystem is dynamic, fueled by advancements in neurostimulation technologies, minimally invasive ablation techniques, and sophisticated infusion systems. Regulatory frameworks, overseen by bodies like the FDA and EMA, play a crucial role in market entry and product development, often influencing the pace of innovation and market adoption. The threat of product substitutes, while present, is somewhat mitigated by the specialized nature of pain management solutions. End-user trends are increasingly shifting towards personalized treatment plans and less invasive procedures, impacting device design and application. Mergers and acquisitions (M&A) activities are prevalent, with recent deals valued in the hundreds of millions of dollars, aimed at consolidating market positions, acquiring novel technologies, and expanding geographical reach. For instance, the acquisition of smaller specialized companies by larger entities allows for greater synergy in R&D and commercialization efforts, further shaping the competitive landscape. This ongoing consolidation and technological advancement underscore the industry's commitment to addressing the growing global burden of chronic pain.
Pain Management Devices Industry Industry Trends & Insights
The Pain Management Devices Industry is experiencing robust growth, propelled by a confluence of compelling market drivers. A primary accelerator is the escalating prevalence of chronic pain conditions, including musculoskeletal disorders, neuropathic pain, and cancer-related pain, affecting a significant portion of the global population. This demographic shift necessitates more effective and sustained pain relief solutions, creating a substantial demand for advanced pain management devices. Technological disruptions are at the forefront of industry evolution. The increasing sophistication of neurostimulation devices, such as spinal cord stimulators (SCS) and peripheral nerve stimulators (PNS), is revolutionizing treatment paradigms by offering targeted and personalized pain relief. Innovations in minimally invasive ablation technologies, including radiofrequency ablation (RFA) and cryoablation, are gaining traction due to their efficacy and reduced recovery times compared to traditional surgical interventions. Furthermore, the integration of artificial intelligence (AI) and machine learning (ML) into pain management devices is enabling predictive analytics, personalized therapy adjustments, and remote patient monitoring, enhancing treatment outcomes and patient engagement. Consumer preferences are increasingly leaning towards non-opioid alternatives and patient-centric care models. This trend is driving the demand for devices that offer long-term pain management without the risks associated with opioid dependence. The shift towards home-based care and remote patient monitoring (RPM) is also a significant trend, with companies developing connected devices that allow for continuous data collection and physician oversight. The competitive dynamics within the industry are intensifying, with established players continually innovating to maintain market leadership while new entrants leverage cutting-edge technologies to carve out niche markets. The market penetration of advanced pain management devices is expected to rise significantly as healthcare providers and patients become more aware of their benefits and accessibility. The projected Compound Annual Growth Rate (CAGR) for the Pain Management Devices Industry is robust, indicating a healthy expansion of the market in the coming years, driven by these interwoven trends and technological advancements. The focus on value-based healthcare is also influencing market dynamics, emphasizing devices that demonstrate improved patient outcomes and cost-effectiveness.
Dominant Markets & Segments in Pain Management Devices Industry
The Pain Management Devices Industry is characterized by significant regional dominance and the substantial influence of specific product types, applications, and end-user segments. North America consistently emerges as the leading market, driven by a high prevalence of chronic pain conditions, advanced healthcare infrastructure, robust reimbursement policies, and a strong emphasis on technological innovation. Within this region, the United States, with its large aging population and high disposable income, represents a substantial portion of the global market share. Economic policies that favor healthcare spending and the widespread adoption of cutting-edge medical technologies further solidify its dominance.
Product Type Dominance: Neurostimulation Devices currently hold the largest market share within the Pain Management Devices Industry.
- Key Drivers:
- Technological Advancements: Continuous innovation in neuromodulation techniques, leading to more sophisticated and targeted therapies.
- Growing Demand for Non-Opioid Solutions: Increasing awareness of the risks associated with opioid use fuels the demand for alternatives like SCS and PNS.
- Favorable Reimbursement: Established reimbursement pathways for neurostimulation therapies in major markets.
- Product Launches: Frequent introduction of next-generation devices with enhanced features and patient comfort.
- Detailed Dominance Analysis: Spinal Cord Stimulator (SCS) systems, in particular, are pivotal, offering relief for chronic back and limb pain. Peripheral Nerve Stimulators (PNS) are also gaining traction for localized pain management. The development of closed-loop systems and the integration of AI for adaptive stimulation are further solidifying the dominance of neurostimulation. Infusion pumps, while still significant, are seeing a more gradual growth, particularly for long-term pain management where precise drug delivery is crucial. Ablation devices, such as radiofrequency and cryoablation, are experiencing rapid growth due to their minimally invasive nature and effectiveness in treating conditions like facet joint pain and certain types of cancer pain.
- Key Drivers:
Application Dominance: Musculoskeletal pain represents the largest application segment.
- Key Drivers:
- High Incidence of Osteoarthritis and Degenerative Disc Disease: These conditions are widespread, especially in aging populations.
- Sports Injuries and Accidents: A significant number of individuals experience acute and chronic musculoskeletal pain.
- Development of Targeted Therapies: Devices are increasingly tailored to address specific musculoskeletal pain sources.
- Detailed Dominance Analysis: The prevalence of back pain, arthritis, and other musculoskeletal ailments creates a vast patient pool. Neuropathic pain, stemming from conditions like diabetes and post-herpetic neuralgia, is another significant and growing segment, with neurostimulation devices showing particular efficacy. Cancer pain and facial pain/migraine are also critical areas, with specialized devices and applications being developed to cater to their unique needs.
- Key Drivers:
End-User Dominance: Hospitals and Clinics are the primary end-users.
- Key Drivers:
- Infrastructure and Expertise: Hospitals possess the necessary infrastructure, specialized medical professionals, and diagnostic capabilities for implanting and managing advanced pain management devices.
- Reimbursement Structures: Insurance coverage and reimbursement policies are more readily available for procedures performed in hospital settings.
- Patient Acuity: Complex pain conditions often require the level of care and monitoring available in hospitals and specialized clinics.
- Detailed Dominance Analysis: The concentration of medical expertise and advanced technology within hospitals and specialized pain clinics makes them the natural hub for the adoption and utilization of sophisticated pain management devices. Physiotherapy centers are also important, particularly for non-invasive devices and rehabilitation, while "Others" encompasses ambulatory surgical centers and home healthcare settings, which are experiencing increasing growth due to the trend towards outpatient procedures and remote patient monitoring.
- Key Drivers:
Pain Management Devices Industry Product Innovations
Product innovations in the Pain Management Devices Industry are primarily focused on enhancing efficacy, patient comfort, and safety. Technological advancements in neurostimulation are leading to more sophisticated systems with closed-loop feedback mechanisms and AI-driven personalization for tailored pain relief. Minimally invasive ablation techniques are being refined to offer greater precision and reduced recovery times. The integration of wireless connectivity and remote patient monitoring (RPM) capabilities is a significant trend, enabling continuous data collection and physician oversight. These innovations aim to provide better therapeutic outcomes, reduce the reliance on opioids, and improve the overall quality of life for patients suffering from chronic pain conditions, thereby creating substantial competitive advantages for companies at the forefront of R&D.
Report Segmentation & Scope
This comprehensive report segments the Pain Management Devices Industry across crucial dimensions to provide granular market insights. The Product Type segmentation includes Neurostimulation Devices, Infusion Pumps, and Ablation Devices, each offering distinct therapeutic approaches. Neurostimulation Devices are projected to witness robust growth driven by advancements in neuromodulation. Infusion Pumps cater to chronic pain requiring continuous medication delivery, while Ablation Devices offer targeted, minimally invasive solutions. The Application segmentation covers Musculoskeletal Pain, Cancer Pain, Neuropathic Pain, Facial Pain and Migraine, and Other applications, reflecting the diverse etiologies of pain addressed by these devices. Musculoskeletal pain is expected to dominate due to its high prevalence, while neuropathic pain presents significant growth opportunities for neurostimulation. The End-User segmentation encompasses Physiotherapy Centers, Hospitals and Clinics, and Others. Hospitals and Clinics are anticipated to maintain their leading position due to advanced infrastructure and expertise, while the "Others" segment, including home care, is poised for substantial expansion. This detailed segmentation allows for precise analysis of market sizes, growth projections, and competitive dynamics within each segment.
Key Drivers of Pain Management Devices Industry Growth
The Pain Management Devices Industry's growth is propelled by several interconnected factors. The escalating global burden of chronic pain conditions, particularly among aging populations, creates an ever-increasing demand for effective pain relief solutions. Technological advancements, especially in neurostimulation and minimally invasive ablation techniques, are offering superior efficacy and reduced side effects compared to traditional methods. The growing awareness and preference for non-opioid alternatives, driven by concerns over addiction and side effects, significantly boost the adoption of advanced pain management devices. Furthermore, favorable reimbursement policies in key markets and increasing healthcare expenditure globally contribute to market expansion. The trend towards remote patient monitoring and personalized medicine also fuels innovation and adoption.
Challenges in the Pain Management Devices Industry Sector
Despite strong growth prospects, the Pain Management Devices Industry faces several significant challenges. High development costs and lengthy regulatory approval processes for novel medical devices can hinder market entry and innovation. Stringent regulatory frameworks, while ensuring safety and efficacy, can also create barriers to adoption, especially for newer technologies. Reimbursement complexities and varying coverage policies across different geographical regions can impact market penetration. The competitive landscape is intensely fought, with established players and emerging innovators vying for market share, leading to pricing pressures. Furthermore, the need for skilled healthcare professionals to implant and manage certain advanced devices can be a limiting factor in widespread adoption, particularly in under-resourced areas. Supply chain disruptions and the constant need to adapt to evolving technological standards also present ongoing challenges.
Leading Players in the Pain Management Devices Industry Market
- ICU Medical Inc
- LivaNova
- DJO Global LLC
- Enovis
- Medtronic
- Baxter
- Stryker
- Abbott
- Boston Scientific Corporation
- Nevro Cor
- Stim Wave LLC
- SPR Therapeutics
Key Developments in Pain Management Devices Industry Sector
- June 2022: Coach Care partnered with (Nexstim NBT System) NXTSTIM to offer the world's first commercial (remote patient monitoring) RPM and wellness monitoring device for pain management.
- January 2021: Boston Scientific Corporation launched the WaveWriter Alpha, a portfolio of Spinal Cord Stimulator (SCS) systems that combine therapy options for personalized pain relief.
Strategic Pain Management Devices Industry Market Outlook
The strategic outlook for the Pain Management Devices Industry is exceptionally positive, driven by sustained innovation and a growing global need for effective pain management solutions. The ongoing shift towards non-opioid therapies and patient-centric care models presents a significant opportunity for companies focusing on advanced neurostimulation and minimally invasive technologies. Expansion into emerging markets with increasing healthcare investments and a rising prevalence of chronic pain will be a key growth accelerator. Furthermore, the integration of AI, IoT, and data analytics into pain management devices will enable more personalized treatments and improved patient outcomes, creating new revenue streams and enhancing competitive advantages. Strategic partnerships, product pipeline expansion, and a focus on value-based healthcare offerings will be crucial for long-term success in this dynamic and evolving market.
Pain Management Devices Industry Segmentation
-
1. Product Type
- 1.1. Neurostimulation Devices
- 1.2. Infusion Pumps
- 1.3. Ablation Devices
-
2. Application
- 2.1. Musculoskeletal
- 2.2. Cancer Pain
- 2.3. Neuropathic Pain
- 2.4. Facial Pain and Migraine
- 2.5. Other
-
3. End-User
- 3.1. Physiotherapy Centers
- 3.2. Hospitals and Clinics
- 3.3. Others
Pain Management Devices Industry Segmentation By Geography
-
1. North America
- 1.1. United States
- 1.2. Canada
- 1.3. Mexico
-
2. Europe
- 2.1. Germany
- 2.2. United Kingdom
- 2.3. France
- 2.4. Italy
- 2.5. Spain
- 2.6. Rest of Europe
-
3. Asia Pacific
- 3.1. China
- 3.2. Japan
- 3.3. India
- 3.4. Australia
- 3.5. South Korea
- 3.6. Rest of Asia Pacific
-
4. Middle East and Africa
- 4.1. GCC
- 4.2. South Africa
- 4.3. Rest of Middle East and Africa
-
5. South America
- 5.1. Brazil
- 5.2. Argentina
- 5.3. Rest of South America
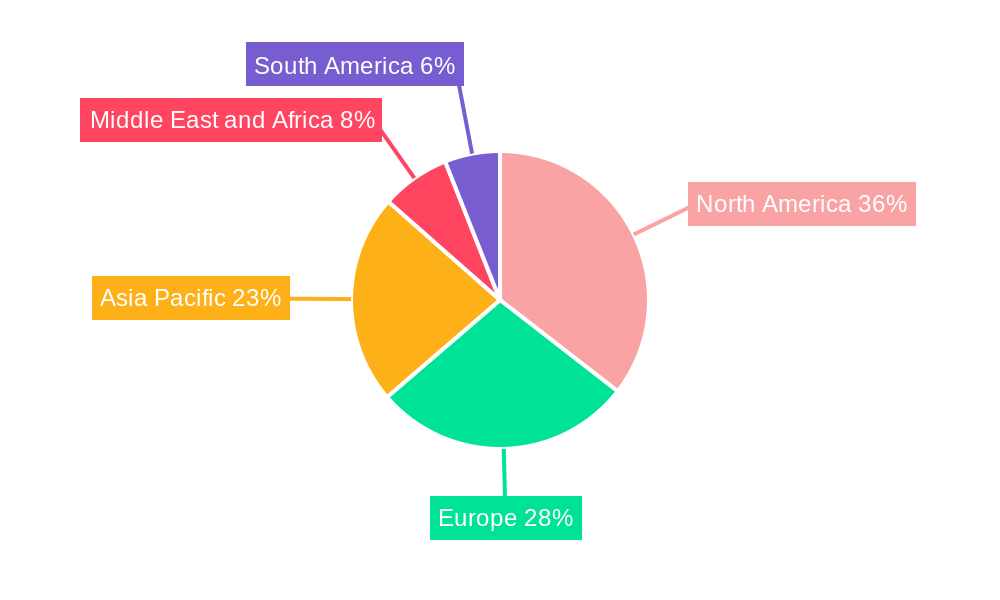
Pain Management Devices Industry Regional Market Share
Geographic Coverage of Pain Management Devices Industry
Pain Management Devices Industry REPORT HIGHLIGHTS
| Aspects | Details |
|---|---|
| Study Period | 2020-2034 |
| Base Year | 2025 |
| Estimated Year | 2026 |
| Forecast Period | 2026-2034 |
| Historical Period | 2020-2025 |
| Growth Rate | CAGR of 9.70% from 2020-2034 |
| Segmentation |
|
Table of Contents
- 1. Introduction
- 1.1. Research Scope
- 1.2. Market Segmentation
- 1.3. Research Objective
- 1.4. Definitions and Assumptions
- 2. Executive Summary
- 2.1. Market Snapshot
- 3. Market Dynamics
- 3.1. Market Drivers
- 3.2. Market Restrains
- 3.3. Market Trends
- 3.4. Market Opportunities
- 4. Market Factor Analysis
- 4.1. Porters Five Forces
- 4.1.1. Bargaining Power of Suppliers
- 4.1.2. Bargaining Power of Buyers
- 4.1.3. Threat of New Entrants
- 4.1.4. Threat of Substitutes
- 4.1.5. Competitive Rivalry
- 4.2. PESTEL analysis
- 4.3. BCG Analysis
- 4.3.1. Stars (High Growth, High Market Share)
- 4.3.2. Cash Cows (Low Growth, High Market Share)
- 4.3.3. Question Mark (High Growth, Low Market Share)
- 4.3.4. Dogs (Low Growth, Low Market Share)
- 4.4. Ansoff Matrix Analysis
- 4.5. Supply Chain Analysis
- 4.6. Regulatory Landscape
- 4.7. Current Market Potential and Opportunity Assessment (TAM–SAM–SOM Framework)
- 4.8. PMV Analyst Note
- 4.1. Porters Five Forces
- 5. Market Analysis, Insights and Forecast 2021-2033
- 5.1. Market Analysis, Insights and Forecast - by Product Type
- 5.1.1. Neurostimulation Devices
- 5.1.2. Infusion Pumps
- 5.1.3. Ablation Devices
- 5.2. Market Analysis, Insights and Forecast - by Application
- 5.2.1. Musculoskeletal
- 5.2.2. Cancer Pain
- 5.2.3. Neuropathic Pain
- 5.2.4. Facial Pain and Migraine
- 5.2.5. Other
- 5.3. Market Analysis, Insights and Forecast - by End-User
- 5.3.1. Physiotherapy Centers
- 5.3.2. Hospitals and Clinics
- 5.3.3. Others
- 5.4. Market Analysis, Insights and Forecast - by Region
- 5.4.1. North America
- 5.4.2. Europe
- 5.4.3. Asia Pacific
- 5.4.4. Middle East and Africa
- 5.4.5. South America
- 5.1. Market Analysis, Insights and Forecast - by Product Type
- 6. Global Pain Management Devices Industry Analysis, Insights and Forecast, 2021-2033
- 6.1. Market Analysis, Insights and Forecast - by Product Type
- 6.1.1. Neurostimulation Devices
- 6.1.2. Infusion Pumps
- 6.1.3. Ablation Devices
- 6.2. Market Analysis, Insights and Forecast - by Application
- 6.2.1. Musculoskeletal
- 6.2.2. Cancer Pain
- 6.2.3. Neuropathic Pain
- 6.2.4. Facial Pain and Migraine
- 6.2.5. Other
- 6.3. Market Analysis, Insights and Forecast - by End-User
- 6.3.1. Physiotherapy Centers
- 6.3.2. Hospitals and Clinics
- 6.3.3. Others
- 6.1. Market Analysis, Insights and Forecast - by Product Type
- 7. North America Pain Management Devices Industry Analysis, Insights and Forecast, 2020-2032
- 7.1. Market Analysis, Insights and Forecast - by Product Type
- 7.1.1. Neurostimulation Devices
- 7.1.2. Infusion Pumps
- 7.1.3. Ablation Devices
- 7.2. Market Analysis, Insights and Forecast - by Application
- 7.2.1. Musculoskeletal
- 7.2.2. Cancer Pain
- 7.2.3. Neuropathic Pain
- 7.2.4. Facial Pain and Migraine
- 7.2.5. Other
- 7.3. Market Analysis, Insights and Forecast - by End-User
- 7.3.1. Physiotherapy Centers
- 7.3.2. Hospitals and Clinics
- 7.3.3. Others
- 7.1. Market Analysis, Insights and Forecast - by Product Type
- 8. Europe Pain Management Devices Industry Analysis, Insights and Forecast, 2020-2032
- 8.1. Market Analysis, Insights and Forecast - by Product Type
- 8.1.1. Neurostimulation Devices
- 8.1.2. Infusion Pumps
- 8.1.3. Ablation Devices
- 8.2. Market Analysis, Insights and Forecast - by Application
- 8.2.1. Musculoskeletal
- 8.2.2. Cancer Pain
- 8.2.3. Neuropathic Pain
- 8.2.4. Facial Pain and Migraine
- 8.2.5. Other
- 8.3. Market Analysis, Insights and Forecast - by End-User
- 8.3.1. Physiotherapy Centers
- 8.3.2. Hospitals and Clinics
- 8.3.3. Others
- 8.1. Market Analysis, Insights and Forecast - by Product Type
- 9. Asia Pacific Pain Management Devices Industry Analysis, Insights and Forecast, 2020-2032
- 9.1. Market Analysis, Insights and Forecast - by Product Type
- 9.1.1. Neurostimulation Devices
- 9.1.2. Infusion Pumps
- 9.1.3. Ablation Devices
- 9.2. Market Analysis, Insights and Forecast - by Application
- 9.2.1. Musculoskeletal
- 9.2.2. Cancer Pain
- 9.2.3. Neuropathic Pain
- 9.2.4. Facial Pain and Migraine
- 9.2.5. Other
- 9.3. Market Analysis, Insights and Forecast - by End-User
- 9.3.1. Physiotherapy Centers
- 9.3.2. Hospitals and Clinics
- 9.3.3. Others
- 9.1. Market Analysis, Insights and Forecast - by Product Type
- 10. Middle East and Africa Pain Management Devices Industry Analysis, Insights and Forecast, 2020-2032
- 10.1. Market Analysis, Insights and Forecast - by Product Type
- 10.1.1. Neurostimulation Devices
- 10.1.2. Infusion Pumps
- 10.1.3. Ablation Devices
- 10.2. Market Analysis, Insights and Forecast - by Application
- 10.2.1. Musculoskeletal
- 10.2.2. Cancer Pain
- 10.2.3. Neuropathic Pain
- 10.2.4. Facial Pain and Migraine
- 10.2.5. Other
- 10.3. Market Analysis, Insights and Forecast - by End-User
- 10.3.1. Physiotherapy Centers
- 10.3.2. Hospitals and Clinics
- 10.3.3. Others
- 10.1. Market Analysis, Insights and Forecast - by Product Type
- 11. South America Pain Management Devices Industry Analysis, Insights and Forecast, 2020-2032
- 11.1. Market Analysis, Insights and Forecast - by Product Type
- 11.1.1. Neurostimulation Devices
- 11.1.2. Infusion Pumps
- 11.1.3. Ablation Devices
- 11.2. Market Analysis, Insights and Forecast - by Application
- 11.2.1. Musculoskeletal
- 11.2.2. Cancer Pain
- 11.2.3. Neuropathic Pain
- 11.2.4. Facial Pain and Migraine
- 11.2.5. Other
- 11.3. Market Analysis, Insights and Forecast - by End-User
- 11.3.1. Physiotherapy Centers
- 11.3.2. Hospitals and Clinics
- 11.3.3. Others
- 11.1. Market Analysis, Insights and Forecast - by Product Type
- 12. Competitive Analysis
- 12.1. Company Profiles
- 12.1.1 ICU Medical Inc
- 12.1.1.1. Company Overview
- 12.1.1.2. Products
- 12.1.1.3. Company Financials
- 12.1.1.4. SWOT Analysis
- 12.1.2 LivaNova
- 12.1.2.1. Company Overview
- 12.1.2.2. Products
- 12.1.2.3. Company Financials
- 12.1.2.4. SWOT Analysis
- 12.1.3 DJO Global LLC
- 12.1.3.1. Company Overview
- 12.1.3.2. Products
- 12.1.3.3. Company Financials
- 12.1.3.4. SWOT Analysis
- 12.1.4 Enovis
- 12.1.4.1. Company Overview
- 12.1.4.2. Products
- 12.1.4.3. Company Financials
- 12.1.4.4. SWOT Analysis
- 12.1.5 Medtronic
- 12.1.5.1. Company Overview
- 12.1.5.2. Products
- 12.1.5.3. Company Financials
- 12.1.5.4. SWOT Analysis
- 12.1.6 Baxter
- 12.1.6.1. Company Overview
- 12.1.6.2. Products
- 12.1.6.3. Company Financials
- 12.1.6.4. SWOT Analysis
- 12.1.7 Stryker
- 12.1.7.1. Company Overview
- 12.1.7.2. Products
- 12.1.7.3. Company Financials
- 12.1.7.4. SWOT Analysis
- 12.1.8 Abbott
- 12.1.8.1. Company Overview
- 12.1.8.2. Products
- 12.1.8.3. Company Financials
- 12.1.8.4. SWOT Analysis
- 12.1.9 Boston Scientific Corporation
- 12.1.9.1. Company Overview
- 12.1.9.2. Products
- 12.1.9.3. Company Financials
- 12.1.9.4. SWOT Analysis
- 12.1.10 Nevro Cor
- 12.1.10.1. Company Overview
- 12.1.10.2. Products
- 12.1.10.3. Company Financials
- 12.1.10.4. SWOT Analysis
- 12.1.11 Stim Wave LLC
- 12.1.11.1. Company Overview
- 12.1.11.2. Products
- 12.1.11.3. Company Financials
- 12.1.11.4. SWOT Analysis
- 12.1.12 SPR Therapeutics
- 12.1.12.1. Company Overview
- 12.1.12.2. Products
- 12.1.12.3. Company Financials
- 12.1.12.4. SWOT Analysis
- 12.1.1 ICU Medical Inc
- 12.2. Market Entropy
- 12.2.1 Company's Key Areas Served
- 12.2.2 Recent Developments
- 12.3. Company Market Share Analysis 2025
- 12.3.1 Top 5 Companies Market Share Analysis
- 12.3.2 Top 3 Companies Market Share Analysis
- 12.4. List of Potential Customers
- 13. Research Methodology
List of Figures
- Figure 1: Global Pain Management Devices Industry Revenue Breakdown (Million, %) by Region 2025 & 2033
- Figure 2: Global Pain Management Devices Industry Volume Breakdown (K Unit, %) by Region 2025 & 2033
- Figure 3: North America Pain Management Devices Industry Revenue (Million), by Product Type 2025 & 2033
- Figure 4: North America Pain Management Devices Industry Volume (K Unit), by Product Type 2025 & 2033
- Figure 5: North America Pain Management Devices Industry Revenue Share (%), by Product Type 2025 & 2033
- Figure 6: North America Pain Management Devices Industry Volume Share (%), by Product Type 2025 & 2033
- Figure 7: North America Pain Management Devices Industry Revenue (Million), by Application 2025 & 2033
- Figure 8: North America Pain Management Devices Industry Volume (K Unit), by Application 2025 & 2033
- Figure 9: North America Pain Management Devices Industry Revenue Share (%), by Application 2025 & 2033
- Figure 10: North America Pain Management Devices Industry Volume Share (%), by Application 2025 & 2033
- Figure 11: North America Pain Management Devices Industry Revenue (Million), by End-User 2025 & 2033
- Figure 12: North America Pain Management Devices Industry Volume (K Unit), by End-User 2025 & 2033
- Figure 13: North America Pain Management Devices Industry Revenue Share (%), by End-User 2025 & 2033
- Figure 14: North America Pain Management Devices Industry Volume Share (%), by End-User 2025 & 2033
- Figure 15: North America Pain Management Devices Industry Revenue (Million), by Country 2025 & 2033
- Figure 16: North America Pain Management Devices Industry Volume (K Unit), by Country 2025 & 2033
- Figure 17: North America Pain Management Devices Industry Revenue Share (%), by Country 2025 & 2033
- Figure 18: North America Pain Management Devices Industry Volume Share (%), by Country 2025 & 2033
- Figure 19: Europe Pain Management Devices Industry Revenue (Million), by Product Type 2025 & 2033
- Figure 20: Europe Pain Management Devices Industry Volume (K Unit), by Product Type 2025 & 2033
- Figure 21: Europe Pain Management Devices Industry Revenue Share (%), by Product Type 2025 & 2033
- Figure 22: Europe Pain Management Devices Industry Volume Share (%), by Product Type 2025 & 2033
- Figure 23: Europe Pain Management Devices Industry Revenue (Million), by Application 2025 & 2033
- Figure 24: Europe Pain Management Devices Industry Volume (K Unit), by Application 2025 & 2033
- Figure 25: Europe Pain Management Devices Industry Revenue Share (%), by Application 2025 & 2033
- Figure 26: Europe Pain Management Devices Industry Volume Share (%), by Application 2025 & 2033
- Figure 27: Europe Pain Management Devices Industry Revenue (Million), by End-User 2025 & 2033
- Figure 28: Europe Pain Management Devices Industry Volume (K Unit), by End-User 2025 & 2033
- Figure 29: Europe Pain Management Devices Industry Revenue Share (%), by End-User 2025 & 2033
- Figure 30: Europe Pain Management Devices Industry Volume Share (%), by End-User 2025 & 2033
- Figure 31: Europe Pain Management Devices Industry Revenue (Million), by Country 2025 & 2033
- Figure 32: Europe Pain Management Devices Industry Volume (K Unit), by Country 2025 & 2033
- Figure 33: Europe Pain Management Devices Industry Revenue Share (%), by Country 2025 & 2033
- Figure 34: Europe Pain Management Devices Industry Volume Share (%), by Country 2025 & 2033
- Figure 35: Asia Pacific Pain Management Devices Industry Revenue (Million), by Product Type 2025 & 2033
- Figure 36: Asia Pacific Pain Management Devices Industry Volume (K Unit), by Product Type 2025 & 2033
- Figure 37: Asia Pacific Pain Management Devices Industry Revenue Share (%), by Product Type 2025 & 2033
- Figure 38: Asia Pacific Pain Management Devices Industry Volume Share (%), by Product Type 2025 & 2033
- Figure 39: Asia Pacific Pain Management Devices Industry Revenue (Million), by Application 2025 & 2033
- Figure 40: Asia Pacific Pain Management Devices Industry Volume (K Unit), by Application 2025 & 2033
- Figure 41: Asia Pacific Pain Management Devices Industry Revenue Share (%), by Application 2025 & 2033
- Figure 42: Asia Pacific Pain Management Devices Industry Volume Share (%), by Application 2025 & 2033
- Figure 43: Asia Pacific Pain Management Devices Industry Revenue (Million), by End-User 2025 & 2033
- Figure 44: Asia Pacific Pain Management Devices Industry Volume (K Unit), by End-User 2025 & 2033
- Figure 45: Asia Pacific Pain Management Devices Industry Revenue Share (%), by End-User 2025 & 2033
- Figure 46: Asia Pacific Pain Management Devices Industry Volume Share (%), by End-User 2025 & 2033
- Figure 47: Asia Pacific Pain Management Devices Industry Revenue (Million), by Country 2025 & 2033
- Figure 48: Asia Pacific Pain Management Devices Industry Volume (K Unit), by Country 2025 & 2033
- Figure 49: Asia Pacific Pain Management Devices Industry Revenue Share (%), by Country 2025 & 2033
- Figure 50: Asia Pacific Pain Management Devices Industry Volume Share (%), by Country 2025 & 2033
- Figure 51: Middle East and Africa Pain Management Devices Industry Revenue (Million), by Product Type 2025 & 2033
- Figure 52: Middle East and Africa Pain Management Devices Industry Volume (K Unit), by Product Type 2025 & 2033
- Figure 53: Middle East and Africa Pain Management Devices Industry Revenue Share (%), by Product Type 2025 & 2033
- Figure 54: Middle East and Africa Pain Management Devices Industry Volume Share (%), by Product Type 2025 & 2033
- Figure 55: Middle East and Africa Pain Management Devices Industry Revenue (Million), by Application 2025 & 2033
- Figure 56: Middle East and Africa Pain Management Devices Industry Volume (K Unit), by Application 2025 & 2033
- Figure 57: Middle East and Africa Pain Management Devices Industry Revenue Share (%), by Application 2025 & 2033
- Figure 58: Middle East and Africa Pain Management Devices Industry Volume Share (%), by Application 2025 & 2033
- Figure 59: Middle East and Africa Pain Management Devices Industry Revenue (Million), by End-User 2025 & 2033
- Figure 60: Middle East and Africa Pain Management Devices Industry Volume (K Unit), by End-User 2025 & 2033
- Figure 61: Middle East and Africa Pain Management Devices Industry Revenue Share (%), by End-User 2025 & 2033
- Figure 62: Middle East and Africa Pain Management Devices Industry Volume Share (%), by End-User 2025 & 2033
- Figure 63: Middle East and Africa Pain Management Devices Industry Revenue (Million), by Country 2025 & 2033
- Figure 64: Middle East and Africa Pain Management Devices Industry Volume (K Unit), by Country 2025 & 2033
- Figure 65: Middle East and Africa Pain Management Devices Industry Revenue Share (%), by Country 2025 & 2033
- Figure 66: Middle East and Africa Pain Management Devices Industry Volume Share (%), by Country 2025 & 2033
- Figure 67: South America Pain Management Devices Industry Revenue (Million), by Product Type 2025 & 2033
- Figure 68: South America Pain Management Devices Industry Volume (K Unit), by Product Type 2025 & 2033
- Figure 69: South America Pain Management Devices Industry Revenue Share (%), by Product Type 2025 & 2033
- Figure 70: South America Pain Management Devices Industry Volume Share (%), by Product Type 2025 & 2033
- Figure 71: South America Pain Management Devices Industry Revenue (Million), by Application 2025 & 2033
- Figure 72: South America Pain Management Devices Industry Volume (K Unit), by Application 2025 & 2033
- Figure 73: South America Pain Management Devices Industry Revenue Share (%), by Application 2025 & 2033
- Figure 74: South America Pain Management Devices Industry Volume Share (%), by Application 2025 & 2033
- Figure 75: South America Pain Management Devices Industry Revenue (Million), by End-User 2025 & 2033
- Figure 76: South America Pain Management Devices Industry Volume (K Unit), by End-User 2025 & 2033
- Figure 77: South America Pain Management Devices Industry Revenue Share (%), by End-User 2025 & 2033
- Figure 78: South America Pain Management Devices Industry Volume Share (%), by End-User 2025 & 2033
- Figure 79: South America Pain Management Devices Industry Revenue (Million), by Country 2025 & 2033
- Figure 80: South America Pain Management Devices Industry Volume (K Unit), by Country 2025 & 2033
- Figure 81: South America Pain Management Devices Industry Revenue Share (%), by Country 2025 & 2033
- Figure 82: South America Pain Management Devices Industry Volume Share (%), by Country 2025 & 2033
List of Tables
- Table 1: Global Pain Management Devices Industry Revenue Million Forecast, by Product Type 2020 & 2033
- Table 2: Global Pain Management Devices Industry Volume K Unit Forecast, by Product Type 2020 & 2033
- Table 3: Global Pain Management Devices Industry Revenue Million Forecast, by Application 2020 & 2033
- Table 4: Global Pain Management Devices Industry Volume K Unit Forecast, by Application 2020 & 2033
- Table 5: Global Pain Management Devices Industry Revenue Million Forecast, by End-User 2020 & 2033
- Table 6: Global Pain Management Devices Industry Volume K Unit Forecast, by End-User 2020 & 2033
- Table 7: Global Pain Management Devices Industry Revenue Million Forecast, by Region 2020 & 2033
- Table 8: Global Pain Management Devices Industry Volume K Unit Forecast, by Region 2020 & 2033
- Table 9: Global Pain Management Devices Industry Revenue Million Forecast, by Product Type 2020 & 2033
- Table 10: Global Pain Management Devices Industry Volume K Unit Forecast, by Product Type 2020 & 2033
- Table 11: Global Pain Management Devices Industry Revenue Million Forecast, by Application 2020 & 2033
- Table 12: Global Pain Management Devices Industry Volume K Unit Forecast, by Application 2020 & 2033
- Table 13: Global Pain Management Devices Industry Revenue Million Forecast, by End-User 2020 & 2033
- Table 14: Global Pain Management Devices Industry Volume K Unit Forecast, by End-User 2020 & 2033
- Table 15: Global Pain Management Devices Industry Revenue Million Forecast, by Country 2020 & 2033
- Table 16: Global Pain Management Devices Industry Volume K Unit Forecast, by Country 2020 & 2033
- Table 17: United States Pain Management Devices Industry Revenue (Million) Forecast, by Application 2020 & 2033
- Table 18: United States Pain Management Devices Industry Volume (K Unit) Forecast, by Application 2020 & 2033
- Table 19: Canada Pain Management Devices Industry Revenue (Million) Forecast, by Application 2020 & 2033
- Table 20: Canada Pain Management Devices Industry Volume (K Unit) Forecast, by Application 2020 & 2033
- Table 21: Mexico Pain Management Devices Industry Revenue (Million) Forecast, by Application 2020 & 2033
- Table 22: Mexico Pain Management Devices Industry Volume (K Unit) Forecast, by Application 2020 & 2033
- Table 23: Global Pain Management Devices Industry Revenue Million Forecast, by Product Type 2020 & 2033
- Table 24: Global Pain Management Devices Industry Volume K Unit Forecast, by Product Type 2020 & 2033
- Table 25: Global Pain Management Devices Industry Revenue Million Forecast, by Application 2020 & 2033
- Table 26: Global Pain Management Devices Industry Volume K Unit Forecast, by Application 2020 & 2033
- Table 27: Global Pain Management Devices Industry Revenue Million Forecast, by End-User 2020 & 2033
- Table 28: Global Pain Management Devices Industry Volume K Unit Forecast, by End-User 2020 & 2033
- Table 29: Global Pain Management Devices Industry Revenue Million Forecast, by Country 2020 & 2033
- Table 30: Global Pain Management Devices Industry Volume K Unit Forecast, by Country 2020 & 2033
- Table 31: Germany Pain Management Devices Industry Revenue (Million) Forecast, by Application 2020 & 2033
- Table 32: Germany Pain Management Devices Industry Volume (K Unit) Forecast, by Application 2020 & 2033
- Table 33: United Kingdom Pain Management Devices Industry Revenue (Million) Forecast, by Application 2020 & 2033
- Table 34: United Kingdom Pain Management Devices Industry Volume (K Unit) Forecast, by Application 2020 & 2033
- Table 35: France Pain Management Devices Industry Revenue (Million) Forecast, by Application 2020 & 2033
- Table 36: France Pain Management Devices Industry Volume (K Unit) Forecast, by Application 2020 & 2033
- Table 37: Italy Pain Management Devices Industry Revenue (Million) Forecast, by Application 2020 & 2033
- Table 38: Italy Pain Management Devices Industry Volume (K Unit) Forecast, by Application 2020 & 2033
- Table 39: Spain Pain Management Devices Industry Revenue (Million) Forecast, by Application 2020 & 2033
- Table 40: Spain Pain Management Devices Industry Volume (K Unit) Forecast, by Application 2020 & 2033
- Table 41: Rest of Europe Pain Management Devices Industry Revenue (Million) Forecast, by Application 2020 & 2033
- Table 42: Rest of Europe Pain Management Devices Industry Volume (K Unit) Forecast, by Application 2020 & 2033
- Table 43: Global Pain Management Devices Industry Revenue Million Forecast, by Product Type 2020 & 2033
- Table 44: Global Pain Management Devices Industry Volume K Unit Forecast, by Product Type 2020 & 2033
- Table 45: Global Pain Management Devices Industry Revenue Million Forecast, by Application 2020 & 2033
- Table 46: Global Pain Management Devices Industry Volume K Unit Forecast, by Application 2020 & 2033
- Table 47: Global Pain Management Devices Industry Revenue Million Forecast, by End-User 2020 & 2033
- Table 48: Global Pain Management Devices Industry Volume K Unit Forecast, by End-User 2020 & 2033
- Table 49: Global Pain Management Devices Industry Revenue Million Forecast, by Country 2020 & 2033
- Table 50: Global Pain Management Devices Industry Volume K Unit Forecast, by Country 2020 & 2033
- Table 51: China Pain Management Devices Industry Revenue (Million) Forecast, by Application 2020 & 2033
- Table 52: China Pain Management Devices Industry Volume (K Unit) Forecast, by Application 2020 & 2033
- Table 53: Japan Pain Management Devices Industry Revenue (Million) Forecast, by Application 2020 & 2033
- Table 54: Japan Pain Management Devices Industry Volume (K Unit) Forecast, by Application 2020 & 2033
- Table 55: India Pain Management Devices Industry Revenue (Million) Forecast, by Application 2020 & 2033
- Table 56: India Pain Management Devices Industry Volume (K Unit) Forecast, by Application 2020 & 2033
- Table 57: Australia Pain Management Devices Industry Revenue (Million) Forecast, by Application 2020 & 2033
- Table 58: Australia Pain Management Devices Industry Volume (K Unit) Forecast, by Application 2020 & 2033
- Table 59: South Korea Pain Management Devices Industry Revenue (Million) Forecast, by Application 2020 & 2033
- Table 60: South Korea Pain Management Devices Industry Volume (K Unit) Forecast, by Application 2020 & 2033
- Table 61: Rest of Asia Pacific Pain Management Devices Industry Revenue (Million) Forecast, by Application 2020 & 2033
- Table 62: Rest of Asia Pacific Pain Management Devices Industry Volume (K Unit) Forecast, by Application 2020 & 2033
- Table 63: Global Pain Management Devices Industry Revenue Million Forecast, by Product Type 2020 & 2033
- Table 64: Global Pain Management Devices Industry Volume K Unit Forecast, by Product Type 2020 & 2033
- Table 65: Global Pain Management Devices Industry Revenue Million Forecast, by Application 2020 & 2033
- Table 66: Global Pain Management Devices Industry Volume K Unit Forecast, by Application 2020 & 2033
- Table 67: Global Pain Management Devices Industry Revenue Million Forecast, by End-User 2020 & 2033
- Table 68: Global Pain Management Devices Industry Volume K Unit Forecast, by End-User 2020 & 2033
- Table 69: Global Pain Management Devices Industry Revenue Million Forecast, by Country 2020 & 2033
- Table 70: Global Pain Management Devices Industry Volume K Unit Forecast, by Country 2020 & 2033
- Table 71: GCC Pain Management Devices Industry Revenue (Million) Forecast, by Application 2020 & 2033
- Table 72: GCC Pain Management Devices Industry Volume (K Unit) Forecast, by Application 2020 & 2033
- Table 73: South Africa Pain Management Devices Industry Revenue (Million) Forecast, by Application 2020 & 2033
- Table 74: South Africa Pain Management Devices Industry Volume (K Unit) Forecast, by Application 2020 & 2033
- Table 75: Rest of Middle East and Africa Pain Management Devices Industry Revenue (Million) Forecast, by Application 2020 & 2033
- Table 76: Rest of Middle East and Africa Pain Management Devices Industry Volume (K Unit) Forecast, by Application 2020 & 2033
- Table 77: Global Pain Management Devices Industry Revenue Million Forecast, by Product Type 2020 & 2033
- Table 78: Global Pain Management Devices Industry Volume K Unit Forecast, by Product Type 2020 & 2033
- Table 79: Global Pain Management Devices Industry Revenue Million Forecast, by Application 2020 & 2033
- Table 80: Global Pain Management Devices Industry Volume K Unit Forecast, by Application 2020 & 2033
- Table 81: Global Pain Management Devices Industry Revenue Million Forecast, by End-User 2020 & 2033
- Table 82: Global Pain Management Devices Industry Volume K Unit Forecast, by End-User 2020 & 2033
- Table 83: Global Pain Management Devices Industry Revenue Million Forecast, by Country 2020 & 2033
- Table 84: Global Pain Management Devices Industry Volume K Unit Forecast, by Country 2020 & 2033
- Table 85: Brazil Pain Management Devices Industry Revenue (Million) Forecast, by Application 2020 & 2033
- Table 86: Brazil Pain Management Devices Industry Volume (K Unit) Forecast, by Application 2020 & 2033
- Table 87: Argentina Pain Management Devices Industry Revenue (Million) Forecast, by Application 2020 & 2033
- Table 88: Argentina Pain Management Devices Industry Volume (K Unit) Forecast, by Application 2020 & 2033
- Table 89: Rest of South America Pain Management Devices Industry Revenue (Million) Forecast, by Application 2020 & 2033
- Table 90: Rest of South America Pain Management Devices Industry Volume (K Unit) Forecast, by Application 2020 & 2033
Frequently Asked Questions
1. What is the projected Compound Annual Growth Rate (CAGR) of the Pain Management Devices Industry?
The projected CAGR is approximately 9.70%.
2. Which companies are prominent players in the Pain Management Devices Industry?
Key companies in the market include ICU Medical Inc, LivaNova, DJO Global LLC, Enovis, Medtronic, Baxter, Stryker, Abbott, Boston Scientific Corporation, Nevro Cor, Stim Wave LLC, SPR Therapeutics.
3. What are the main segments of the Pain Management Devices Industry?
The market segments include Product Type, Application, End-User.
4. Can you provide details about the market size?
The market size is estimated to be USD 10.64 Million as of 2022.
5. What are some drivers contributing to market growth?
The advent of Innovative and Technologically Advanced Pain Management Devices; Increase in Adoption of Pain Management Devices; Rise in Geriatric Population.
6. What are the notable trends driving market growth?
The neuropathic pain management devices segment counted for the largest share of the global market and witness significant growth.
7. Are there any restraints impacting market growth?
Preferable use of medications for pain management.
8. Can you provide examples of recent developments in the market?
In June 2022, Coach Care has partnered with (Nexstim NBT System) NXTSTIM to Offer World's First Commercial (remote patient monitoring) RPM and Wellness Monitoring Device for Pain Management
9. What pricing options are available for accessing the report?
Pricing options include single-user, multi-user, and enterprise licenses priced at USD 4750, USD 5250, and USD 8750 respectively.
10. Is the market size provided in terms of value or volume?
The market size is provided in terms of value, measured in Million and volume, measured in K Unit.
11. Are there any specific market keywords associated with the report?
Yes, the market keyword associated with the report is "Pain Management Devices Industry," which aids in identifying and referencing the specific market segment covered.
12. How do I determine which pricing option suits my needs best?
The pricing options vary based on user requirements and access needs. Individual users may opt for single-user licenses, while businesses requiring broader access may choose multi-user or enterprise licenses for cost-effective access to the report.
13. Are there any additional resources or data provided in the Pain Management Devices Industry report?
While the report offers comprehensive insights, it's advisable to review the specific contents or supplementary materials provided to ascertain if additional resources or data are available.
14. How can I stay updated on further developments or reports in the Pain Management Devices Industry?
To stay informed about further developments, trends, and reports in the Pain Management Devices Industry, consider subscribing to industry newsletters, following relevant companies and organizations, or regularly checking reputable industry news sources and publications.
Methodology
Step 1 - Identification of Relevant Samples Size from Population Database


Step 2 - Approaches for Defining Global Market Size (Value, Volume* & Price*)

Note*: In applicable scenarios
Step 3 - Data Sources
Primary Research
- Web Analytics
- Survey Reports
- Research Institute
- Latest Research Reports
- Opinion Leaders
Secondary Research
- Annual Reports
- White Paper
- Latest Press Release
- Industry Association
- Paid Database
- Investor Presentations

Step 4 - Data Triangulation
Involves using different sources of information in order to increase the validity of a study
These sources are likely to be stakeholders in a program - participants, other researchers, program staff, other community members, and so on.
Then we put all data in single framework & apply various statistical tools to find out the dynamic on the market.
During the analysis stage, feedback from the stakeholder groups would be compared to determine areas of agreement as well as areas of divergence