Key Insights
The global Blood Pressure (BP) Cuffs market is projected for significant expansion, currently valued at $554.10 million. This growth is propelled by an estimated Compound Annual Growth Rate (CAGR) of 5.89% from 2019 to 2033, indicating a robust upward trajectory. The increasing prevalence of cardiovascular diseases worldwide, coupled with a growing awareness of the importance of regular BP monitoring, serves as a primary market driver. Furthermore, advancements in medical technology are leading to the development of more accurate, user-friendly, and connected BP cuffs, catering to both professional healthcare settings and home use. The shift towards proactive health management and the rising demand for remote patient monitoring solutions are further fueling market growth. The market is segmented by usage into reusable and disposable cuffs, with reusable options likely dominating due to their cost-effectiveness and environmental benefits in clinical settings. Product types are categorized into manual and automated cuffs, with automated devices expected to gain substantial traction owing to their ease of use and enhanced accuracy, especially in home monitoring. Hospitals and clinics represent key end-user segments, driven by the need for reliable diagnostic tools and patient management. However, challenges such as the availability of counterfeit products and the need for standardized calibration can pose significant restraints to market expansion.
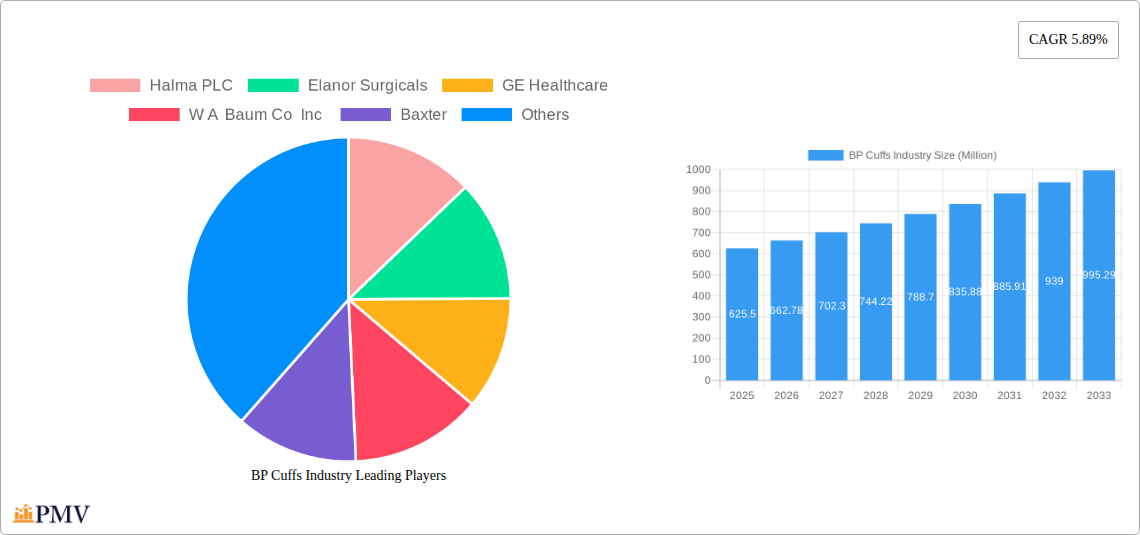
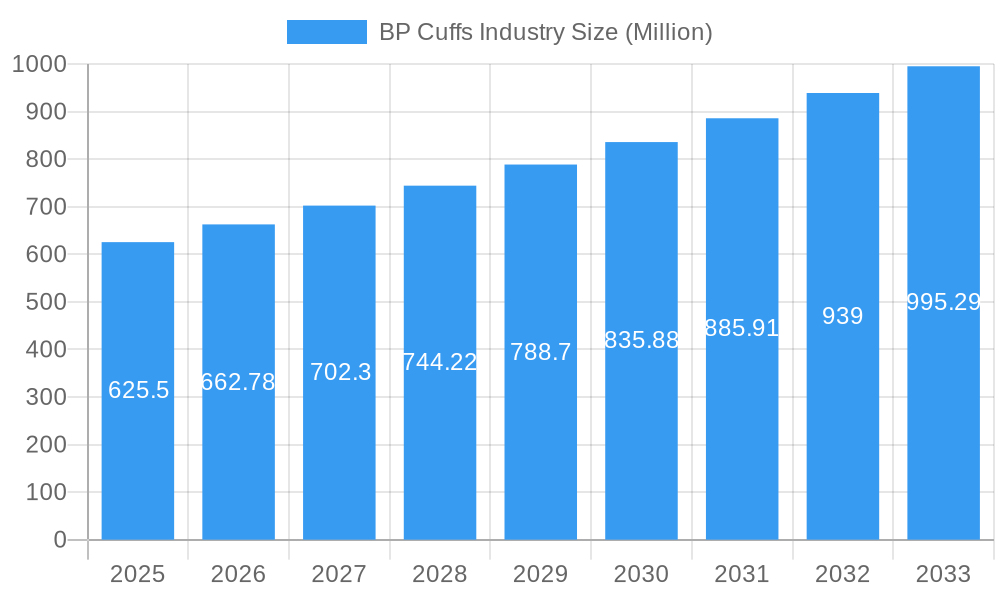
BP Cuffs Industry Market Size (In Million)
The competitive landscape features a mix of established healthcare giants and specialized medical device manufacturers, including Halma PLC, GE Healthcare, Koninklijke Philips NV, and Omron Healthcare Inc. These companies are actively engaged in product innovation, strategic partnerships, and market penetration efforts. The Asia Pacific region, particularly China and India, is anticipated to witness the fastest growth due to a burgeoning patient population, increasing disposable incomes, and expanding healthcare infrastructure. North America and Europe, with their well-established healthcare systems and high adoption rates of advanced medical devices, will continue to represent significant market shares. The trend towards miniaturization and the integration of IoT capabilities in BP cuffs, enabling seamless data transfer to healthcare providers, will be crucial for future market success. The increasing elderly population globally also contributes to the sustained demand for BP monitoring devices, making the BP Cuffs market a vital component of the broader healthcare ecosystem.
BP Cuffs Industry Company Market Share
This in-depth report provides a detailed analysis of the global BP Cuffs industry, offering strategic insights and actionable intelligence for stakeholders. Covering the historical period from 2019 to 2024, a base year of 2025, and a robust forecast period extending to 2033, this study is an indispensable resource for understanding market dynamics, identifying growth opportunities, and navigating challenges. The report delves into market structure, competitive landscape, key trends, dominant segments, product innovations, growth drivers, and critical challenges, equipping businesses with the knowledge to excel in this evolving sector.
BP Cuffs Industry Market Structure & Competitive Dynamics
The global BP Cuffs market exhibits a moderately concentrated structure, with key players like Halma PLC, GE Healthcare, Baxter, and Cardinal Health holding significant market share. Innovation is a crucial differentiator, driven by continuous research and development in areas such as automated monitoring, enhanced comfort, and improved accuracy. Regulatory frameworks, primarily governed by health authorities like the FDA and CE marking, play a vital role in product approval and market access, ensuring patient safety and device efficacy. Product substitutes, though limited for primary blood pressure monitoring, include alternative diagnostic methods and less precise home-use devices. End-user trends are shifting towards home monitoring and remote patient care, influencing product design and distribution channels. Merger and acquisition (M&A) activities are strategically employed by larger companies to acquire innovative technologies and expand their market reach. For instance, recent M&A activities in the broader medical device sector highlight a trend of consolidation, with deal values often in the hundreds of millions to billions of dollars, reflecting the strategic importance of niche markets like BP cuffs within the larger healthcare ecosystem. The market size for BP cuffs is projected to reach approximately $2,500 Million by 2025.
BP Cuffs Industry Industry Trends & Insights
The BP Cuffs industry is experiencing robust growth, propelled by a confluence of factors including the rising global prevalence of hypertension and cardiovascular diseases, an aging population, and an increasing awareness of the importance of regular health monitoring. The compound annual growth rate (CAGR) is estimated to be around 6.5% during the forecast period (2025–2033). Technological disruptions are at the forefront, with the integration of smart features, IoT connectivity, and artificial intelligence enabling remote patient monitoring and personalized healthcare solutions. Consumer preferences are increasingly leaning towards convenience, ease of use, and accuracy, driving demand for automated and user-friendly BP cuff devices for home use. The competitive landscape is characterized by a mix of established medical device manufacturers and emerging tech-focused companies, all vying for market dominance through product differentiation and strategic partnerships. The market penetration of advanced BP cuff technologies is rapidly increasing, particularly in developed economies, with an estimated 45% of households in North America and Europe expected to own a smart BP monitoring device by 2028. The increasing emphasis on preventative healthcare and proactive disease management further fuels the demand for reliable and accessible blood pressure monitoring solutions.
Dominant Markets & Segments in BP Cuffs Industry
The global BP Cuffs market is witnessing significant dominance in specific regions and segments, driven by a combination of demographic, economic, and healthcare infrastructure factors.
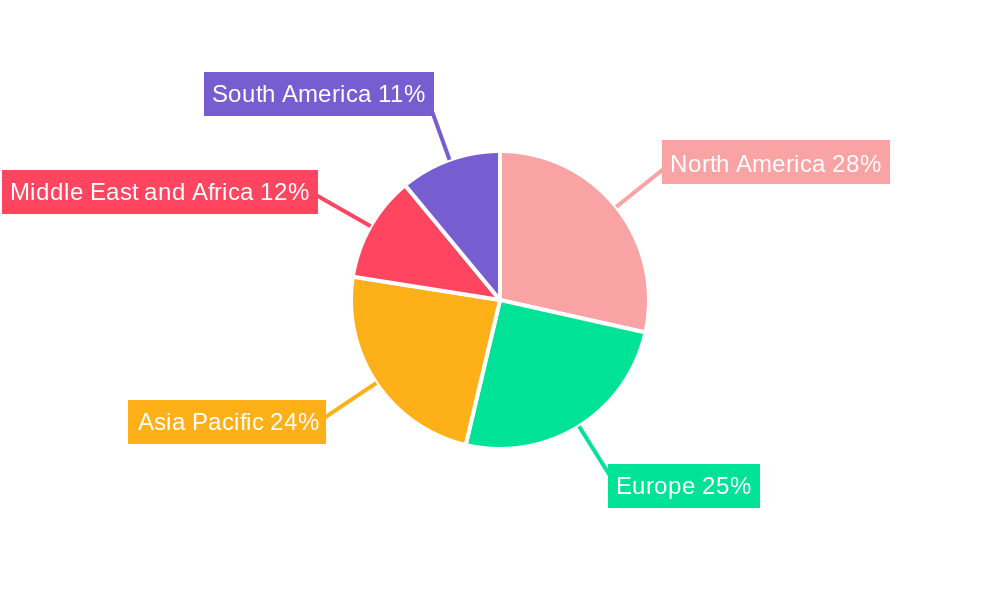
- Leading Region: North America currently holds a dominant position in the BP Cuffs market, estimated at around $800 Million in 2025. This leadership is attributed to a high prevalence of cardiovascular diseases, a well-established healthcare system, advanced technological adoption, and robust reimbursement policies for home monitoring devices. Economic policies that support preventative healthcare and a strong emphasis on patient-centric care further bolster market growth.
- Dominant Segment by Usage: The Reusable segment is expected to maintain its lead, projected to reach approximately $1,600 Million by 2033. This is due to their cost-effectiveness for healthcare institutions and repeated use in clinical settings. However, the Disposable segment is experiencing rapid growth, driven by increasing demand for single-use convenience and infection control measures in hospitals and clinics, with a projected CAGR of 7.2%.
- Dominant Segment by Product Type: Automated BP cuffs are increasingly preferred over Manual variants, capturing an estimated 70% of the market share by 2028, valued at over $1,800 Million. This preference stems from their ease of use, higher accuracy, and ability to automatically record readings, making them ideal for both home and clinical settings.
- Dominant Segment by End User: Hospitals are the largest end-user segment, accounting for an estimated 55% of the market value, projected to reach approximately $1,400 Million by 2033. This is due to their widespread use in patient diagnosis, monitoring, and management of chronic conditions. However, Clinics and Other End Users (including home healthcare providers and individual consumers) are exhibiting significant growth, driven by the trend of remote patient monitoring and self-care.
BP Cuffs Industry Product Innovations
Product innovation in the BP Cuffs industry centers on enhancing user experience, improving diagnostic accuracy, and enabling seamless data integration. Key advancements include the development of smart cuffs with Bluetooth connectivity for data syncing to mobile apps, cuffless blood pressure monitoring technologies, and AI-powered diagnostic support. These innovations offer greater convenience for home users and enable healthcare providers to remotely monitor patient conditions, leading to earlier intervention and improved treatment outcomes. The competitive advantage lies in offering devices that are not only accurate but also intuitive, comfortable, and capable of providing actionable health insights.
Report Segmentation & Scope
This report meticulously segments the BP Cuffs market across critical dimensions to provide a granular understanding of its dynamics. The segmentation includes:
- Usage: Differentiating between Reusable BP cuffs, favored for their durability and cost-effectiveness in institutional settings, and Disposable BP cuffs, prioritizing hygiene and convenience, especially in outbreak scenarios. The reusable segment is projected to hold a market size of $1,600 Million by 2033, while disposables are expected to see substantial growth.
- Product Type: Analyzing the market for Manual BP cuffs, representing traditional and often more economical options, and Automated BP cuffs, which offer enhanced user-friendliness and data logging capabilities. The automated segment is forecast to dominate, reaching over $1,800 Million by 2028.
- End User: Examining the distinct needs and purchasing patterns of Hospitals, the largest consumer base, Clinics, which increasingly adopt point-of-care testing solutions, and Other End Users, encompassing home healthcare providers, pharmacies, and individual consumers driving the direct-to-consumer market. Hospitals are projected to constitute a market value of $1,400 Million by 2033.
Key Drivers of BP Cuffs Industry Growth
The BP Cuffs industry is experiencing significant growth driven by several key factors. The escalating global burden of hypertension and cardiovascular diseases, coupled with an aging population, creates a sustained demand for reliable blood pressure monitoring solutions. Technological advancements, such as the integration of IoT and AI in smart BP cuffs, are enabling remote patient monitoring and personalized healthcare, further propelling market expansion. Favorable government initiatives promoting preventative healthcare and increasing health awareness among consumers are also contributing significantly to market growth. The development of user-friendly and accurate devices for home use is democratizing health monitoring and driving adoption across a wider demographic.
Challenges in the BP Cuffs Industry Sector
Despite its growth trajectory, the BP Cuffs industry faces several challenges. Stringent regulatory approvals and the need for continuous compliance with evolving standards can pose barriers to entry and slow down product launches. Supply chain disruptions, as witnessed in recent global events, can impact manufacturing and distribution, leading to price fluctuations and availability issues. Intense competition from both established players and new entrants necessitates continuous innovation and cost optimization. Furthermore, ensuring data security and privacy for connected devices is paramount, requiring robust cybersecurity measures to maintain user trust and prevent data breaches, which can have a significant impact on market reputation and adoption rates.
Leading Players in the BP Cuffs Industry Market
- Halma PLC
- Elanor Surgicals
- GE Healthcare
- W A Baum Co Inc
- Baxter
- Spengler SAS
- Cardinal Health
- Koninklijke Philips NV
- Omron Healthcare Inc
- Spacelabs Healthcare
- American Diagnostic Corporation
- Medline Industries Inc
Key Developments in BP Cuffs Industry Sector
- September 2022: Garmin launched a smart blood pressure monitor with adjustable cuffs, enabling at-home and on-the-go measurement of systolic and diastolic blood pressure. This innovation targets consumers seeking convenient and portable health tracking solutions.
- February 2022: Inbody introduced the BP 170 one-touch automatic blood pressure cuff monitor, offering individuals the option for self-recording and tracking key health metrics at home, emphasizing user-friendly design and comprehensive health data management.
Strategic BP Cuffs Industry Market Outlook
The strategic outlook for the BP Cuffs industry is highly promising, driven by continuous innovation and evolving healthcare paradigms. The increasing adoption of telehealth and remote patient monitoring solutions presents a significant growth accelerator, as BP cuffs become integral to chronic disease management and preventative care strategies. Market players that focus on developing connected devices with advanced analytics, superior user interfaces, and robust data security will be well-positioned to capture market share. Strategic partnerships with healthcare providers, insurance companies, and technology firms will be crucial for expanding market reach and offering integrated health solutions. The growing demand for personalized health insights and proactive wellness management ensures a sustained upward trajectory for the BP Cuffs market.
BP Cuffs Industry Segmentation
-
1. Usage
- 1.1. Reusable
- 1.2. Disposable
-
2. Product Type
- 2.1. Manual
- 2.2. Automated
-
3. End User
- 3.1. Hospitals
- 3.2. Clinics
- 3.3. Other End Users
BP Cuffs Industry Segmentation By Geography
-
1. North America
- 1.1. United States
- 1.2. Canada
- 1.3. Mexico
-
2. Europe
- 2.1. Germany
- 2.2. United Kingdom
- 2.3. France
- 2.4. Italy
- 2.5. Spain
- 2.6. Rest of Europe
-
3. Asia Pacific
- 3.1. China
- 3.2. Japan
- 3.3. India
- 3.4. Australia
- 3.5. South Korea
- 3.6. Rest of Asia Pacific
-
4. Middle East and Africa
- 4.1. GCC
- 4.2. South Africa
- 4.3. Rest of Middle East and Africa
-
5. South America
- 5.1. Brazil
- 5.2. Argentina
- 5.3. Rest of South America
BP Cuffs Industry Regional Market Share
Geographic Coverage of BP Cuffs Industry
BP Cuffs Industry REPORT HIGHLIGHTS
| Aspects | Details |
|---|---|
| Study Period | 2020-2034 |
| Base Year | 2025 |
| Estimated Year | 2026 |
| Forecast Period | 2026-2034 |
| Historical Period | 2020-2025 |
| Growth Rate | CAGR of 5.89% from 2020-2034 |
| Segmentation |
|
Table of Contents
- 1. Introduction
- 1.1. Research Scope
- 1.2. Market Segmentation
- 1.3. Research Objective
- 1.4. Definitions and Assumptions
- 2. Executive Summary
- 2.1. Market Snapshot
- 3. Market Dynamics
- 3.1. Market Drivers
- 3.2. Market Restrains
- 3.3. Market Trends
- 3.4. Market Opportunities
- 4. Market Factor Analysis
- 4.1. Porters Five Forces
- 4.1.1. Bargaining Power of Suppliers
- 4.1.2. Bargaining Power of Buyers
- 4.1.3. Threat of New Entrants
- 4.1.4. Threat of Substitutes
- 4.1.5. Competitive Rivalry
- 4.2. PESTEL analysis
- 4.3. BCG Analysis
- 4.3.1. Stars (High Growth, High Market Share)
- 4.3.2. Cash Cows (Low Growth, High Market Share)
- 4.3.3. Question Mark (High Growth, Low Market Share)
- 4.3.4. Dogs (Low Growth, Low Market Share)
- 4.4. Ansoff Matrix Analysis
- 4.5. Supply Chain Analysis
- 4.6. Regulatory Landscape
- 4.7. Current Market Potential and Opportunity Assessment (TAM–SAM–SOM Framework)
- 4.8. PMV Analyst Note
- 4.1. Porters Five Forces
- 5. Market Analysis, Insights and Forecast 2021-2033
- 5.1. Market Analysis, Insights and Forecast - by Usage
- 5.1.1. Reusable
- 5.1.2. Disposable
- 5.2. Market Analysis, Insights and Forecast - by Product Type
- 5.2.1. Manual
- 5.2.2. Automated
- 5.3. Market Analysis, Insights and Forecast - by End User
- 5.3.1. Hospitals
- 5.3.2. Clinics
- 5.3.3. Other End Users
- 5.4. Market Analysis, Insights and Forecast - by Region
- 5.4.1. North America
- 5.4.2. Europe
- 5.4.3. Asia Pacific
- 5.4.4. Middle East and Africa
- 5.4.5. South America
- 5.1. Market Analysis, Insights and Forecast - by Usage
- 6. Global BP Cuffs Industry Analysis, Insights and Forecast, 2021-2033
- 6.1. Market Analysis, Insights and Forecast - by Usage
- 6.1.1. Reusable
- 6.1.2. Disposable
- 6.2. Market Analysis, Insights and Forecast - by Product Type
- 6.2.1. Manual
- 6.2.2. Automated
- 6.3. Market Analysis, Insights and Forecast - by End User
- 6.3.1. Hospitals
- 6.3.2. Clinics
- 6.3.3. Other End Users
- 6.1. Market Analysis, Insights and Forecast - by Usage
- 7. North America BP Cuffs Industry Analysis, Insights and Forecast, 2020-2032
- 7.1. Market Analysis, Insights and Forecast - by Usage
- 7.1.1. Reusable
- 7.1.2. Disposable
- 7.2. Market Analysis, Insights and Forecast - by Product Type
- 7.2.1. Manual
- 7.2.2. Automated
- 7.3. Market Analysis, Insights and Forecast - by End User
- 7.3.1. Hospitals
- 7.3.2. Clinics
- 7.3.3. Other End Users
- 7.1. Market Analysis, Insights and Forecast - by Usage
- 8. Europe BP Cuffs Industry Analysis, Insights and Forecast, 2020-2032
- 8.1. Market Analysis, Insights and Forecast - by Usage
- 8.1.1. Reusable
- 8.1.2. Disposable
- 8.2. Market Analysis, Insights and Forecast - by Product Type
- 8.2.1. Manual
- 8.2.2. Automated
- 8.3. Market Analysis, Insights and Forecast - by End User
- 8.3.1. Hospitals
- 8.3.2. Clinics
- 8.3.3. Other End Users
- 8.1. Market Analysis, Insights and Forecast - by Usage
- 9. Asia Pacific BP Cuffs Industry Analysis, Insights and Forecast, 2020-2032
- 9.1. Market Analysis, Insights and Forecast - by Usage
- 9.1.1. Reusable
- 9.1.2. Disposable
- 9.2. Market Analysis, Insights and Forecast - by Product Type
- 9.2.1. Manual
- 9.2.2. Automated
- 9.3. Market Analysis, Insights and Forecast - by End User
- 9.3.1. Hospitals
- 9.3.2. Clinics
- 9.3.3. Other End Users
- 9.1. Market Analysis, Insights and Forecast - by Usage
- 10. Middle East and Africa BP Cuffs Industry Analysis, Insights and Forecast, 2020-2032
- 10.1. Market Analysis, Insights and Forecast - by Usage
- 10.1.1. Reusable
- 10.1.2. Disposable
- 10.2. Market Analysis, Insights and Forecast - by Product Type
- 10.2.1. Manual
- 10.2.2. Automated
- 10.3. Market Analysis, Insights and Forecast - by End User
- 10.3.1. Hospitals
- 10.3.2. Clinics
- 10.3.3. Other End Users
- 10.1. Market Analysis, Insights and Forecast - by Usage
- 11. South America BP Cuffs Industry Analysis, Insights and Forecast, 2020-2032
- 11.1. Market Analysis, Insights and Forecast - by Usage
- 11.1.1. Reusable
- 11.1.2. Disposable
- 11.2. Market Analysis, Insights and Forecast - by Product Type
- 11.2.1. Manual
- 11.2.2. Automated
- 11.3. Market Analysis, Insights and Forecast - by End User
- 11.3.1. Hospitals
- 11.3.2. Clinics
- 11.3.3. Other End Users
- 11.1. Market Analysis, Insights and Forecast - by Usage
- 12. Competitive Analysis
- 12.1. Company Profiles
- 12.1.1 Halma PLC
- 12.1.1.1. Company Overview
- 12.1.1.2. Products
- 12.1.1.3. Company Financials
- 12.1.1.4. SWOT Analysis
- 12.1.2 Elanor Surgicals
- 12.1.2.1. Company Overview
- 12.1.2.2. Products
- 12.1.2.3. Company Financials
- 12.1.2.4. SWOT Analysis
- 12.1.3 GE Healthcare
- 12.1.3.1. Company Overview
- 12.1.3.2. Products
- 12.1.3.3. Company Financials
- 12.1.3.4. SWOT Analysis
- 12.1.4 W A Baum Co Inc
- 12.1.4.1. Company Overview
- 12.1.4.2. Products
- 12.1.4.3. Company Financials
- 12.1.4.4. SWOT Analysis
- 12.1.5 Baxter
- 12.1.5.1. Company Overview
- 12.1.5.2. Products
- 12.1.5.3. Company Financials
- 12.1.5.4. SWOT Analysis
- 12.1.6 Spengler SAS
- 12.1.6.1. Company Overview
- 12.1.6.2. Products
- 12.1.6.3. Company Financials
- 12.1.6.4. SWOT Analysis
- 12.1.7 Cardinal Health
- 12.1.7.1. Company Overview
- 12.1.7.2. Products
- 12.1.7.3. Company Financials
- 12.1.7.4. SWOT Analysis
- 12.1.8 Koninklijke Philips NV
- 12.1.8.1. Company Overview
- 12.1.8.2. Products
- 12.1.8.3. Company Financials
- 12.1.8.4. SWOT Analysis
- 12.1.9 Omron Healthcare Inc
- 12.1.9.1. Company Overview
- 12.1.9.2. Products
- 12.1.9.3. Company Financials
- 12.1.9.4. SWOT Analysis
- 12.1.10 Spacelabs Healthcare
- 12.1.10.1. Company Overview
- 12.1.10.2. Products
- 12.1.10.3. Company Financials
- 12.1.10.4. SWOT Analysis
- 12.1.11 American Diagnostic Corporation
- 12.1.11.1. Company Overview
- 12.1.11.2. Products
- 12.1.11.3. Company Financials
- 12.1.11.4. SWOT Analysis
- 12.1.12 Medline Industries Inc
- 12.1.12.1. Company Overview
- 12.1.12.2. Products
- 12.1.12.3. Company Financials
- 12.1.12.4. SWOT Analysis
- 12.1.1 Halma PLC
- 12.2. Market Entropy
- 12.2.1 Company's Key Areas Served
- 12.2.2 Recent Developments
- 12.3. Company Market Share Analysis 2025
- 12.3.1 Top 5 Companies Market Share Analysis
- 12.3.2 Top 3 Companies Market Share Analysis
- 12.4. List of Potential Customers
- 13. Research Methodology
List of Figures
- Figure 1: Global BP Cuffs Industry Revenue Breakdown (Million, %) by Region 2025 & 2033
- Figure 2: Global BP Cuffs Industry Volume Breakdown (K Unit, %) by Region 2025 & 2033
- Figure 3: North America BP Cuffs Industry Revenue (Million), by Usage 2025 & 2033
- Figure 4: North America BP Cuffs Industry Volume (K Unit), by Usage 2025 & 2033
- Figure 5: North America BP Cuffs Industry Revenue Share (%), by Usage 2025 & 2033
- Figure 6: North America BP Cuffs Industry Volume Share (%), by Usage 2025 & 2033
- Figure 7: North America BP Cuffs Industry Revenue (Million), by Product Type 2025 & 2033
- Figure 8: North America BP Cuffs Industry Volume (K Unit), by Product Type 2025 & 2033
- Figure 9: North America BP Cuffs Industry Revenue Share (%), by Product Type 2025 & 2033
- Figure 10: North America BP Cuffs Industry Volume Share (%), by Product Type 2025 & 2033
- Figure 11: North America BP Cuffs Industry Revenue (Million), by End User 2025 & 2033
- Figure 12: North America BP Cuffs Industry Volume (K Unit), by End User 2025 & 2033
- Figure 13: North America BP Cuffs Industry Revenue Share (%), by End User 2025 & 2033
- Figure 14: North America BP Cuffs Industry Volume Share (%), by End User 2025 & 2033
- Figure 15: North America BP Cuffs Industry Revenue (Million), by Country 2025 & 2033
- Figure 16: North America BP Cuffs Industry Volume (K Unit), by Country 2025 & 2033
- Figure 17: North America BP Cuffs Industry Revenue Share (%), by Country 2025 & 2033
- Figure 18: North America BP Cuffs Industry Volume Share (%), by Country 2025 & 2033
- Figure 19: Europe BP Cuffs Industry Revenue (Million), by Usage 2025 & 2033
- Figure 20: Europe BP Cuffs Industry Volume (K Unit), by Usage 2025 & 2033
- Figure 21: Europe BP Cuffs Industry Revenue Share (%), by Usage 2025 & 2033
- Figure 22: Europe BP Cuffs Industry Volume Share (%), by Usage 2025 & 2033
- Figure 23: Europe BP Cuffs Industry Revenue (Million), by Product Type 2025 & 2033
- Figure 24: Europe BP Cuffs Industry Volume (K Unit), by Product Type 2025 & 2033
- Figure 25: Europe BP Cuffs Industry Revenue Share (%), by Product Type 2025 & 2033
- Figure 26: Europe BP Cuffs Industry Volume Share (%), by Product Type 2025 & 2033
- Figure 27: Europe BP Cuffs Industry Revenue (Million), by End User 2025 & 2033
- Figure 28: Europe BP Cuffs Industry Volume (K Unit), by End User 2025 & 2033
- Figure 29: Europe BP Cuffs Industry Revenue Share (%), by End User 2025 & 2033
- Figure 30: Europe BP Cuffs Industry Volume Share (%), by End User 2025 & 2033
- Figure 31: Europe BP Cuffs Industry Revenue (Million), by Country 2025 & 2033
- Figure 32: Europe BP Cuffs Industry Volume (K Unit), by Country 2025 & 2033
- Figure 33: Europe BP Cuffs Industry Revenue Share (%), by Country 2025 & 2033
- Figure 34: Europe BP Cuffs Industry Volume Share (%), by Country 2025 & 2033
- Figure 35: Asia Pacific BP Cuffs Industry Revenue (Million), by Usage 2025 & 2033
- Figure 36: Asia Pacific BP Cuffs Industry Volume (K Unit), by Usage 2025 & 2033
- Figure 37: Asia Pacific BP Cuffs Industry Revenue Share (%), by Usage 2025 & 2033
- Figure 38: Asia Pacific BP Cuffs Industry Volume Share (%), by Usage 2025 & 2033
- Figure 39: Asia Pacific BP Cuffs Industry Revenue (Million), by Product Type 2025 & 2033
- Figure 40: Asia Pacific BP Cuffs Industry Volume (K Unit), by Product Type 2025 & 2033
- Figure 41: Asia Pacific BP Cuffs Industry Revenue Share (%), by Product Type 2025 & 2033
- Figure 42: Asia Pacific BP Cuffs Industry Volume Share (%), by Product Type 2025 & 2033
- Figure 43: Asia Pacific BP Cuffs Industry Revenue (Million), by End User 2025 & 2033
- Figure 44: Asia Pacific BP Cuffs Industry Volume (K Unit), by End User 2025 & 2033
- Figure 45: Asia Pacific BP Cuffs Industry Revenue Share (%), by End User 2025 & 2033
- Figure 46: Asia Pacific BP Cuffs Industry Volume Share (%), by End User 2025 & 2033
- Figure 47: Asia Pacific BP Cuffs Industry Revenue (Million), by Country 2025 & 2033
- Figure 48: Asia Pacific BP Cuffs Industry Volume (K Unit), by Country 2025 & 2033
- Figure 49: Asia Pacific BP Cuffs Industry Revenue Share (%), by Country 2025 & 2033
- Figure 50: Asia Pacific BP Cuffs Industry Volume Share (%), by Country 2025 & 2033
- Figure 51: Middle East and Africa BP Cuffs Industry Revenue (Million), by Usage 2025 & 2033
- Figure 52: Middle East and Africa BP Cuffs Industry Volume (K Unit), by Usage 2025 & 2033
- Figure 53: Middle East and Africa BP Cuffs Industry Revenue Share (%), by Usage 2025 & 2033
- Figure 54: Middle East and Africa BP Cuffs Industry Volume Share (%), by Usage 2025 & 2033
- Figure 55: Middle East and Africa BP Cuffs Industry Revenue (Million), by Product Type 2025 & 2033
- Figure 56: Middle East and Africa BP Cuffs Industry Volume (K Unit), by Product Type 2025 & 2033
- Figure 57: Middle East and Africa BP Cuffs Industry Revenue Share (%), by Product Type 2025 & 2033
- Figure 58: Middle East and Africa BP Cuffs Industry Volume Share (%), by Product Type 2025 & 2033
- Figure 59: Middle East and Africa BP Cuffs Industry Revenue (Million), by End User 2025 & 2033
- Figure 60: Middle East and Africa BP Cuffs Industry Volume (K Unit), by End User 2025 & 2033
- Figure 61: Middle East and Africa BP Cuffs Industry Revenue Share (%), by End User 2025 & 2033
- Figure 62: Middle East and Africa BP Cuffs Industry Volume Share (%), by End User 2025 & 2033
- Figure 63: Middle East and Africa BP Cuffs Industry Revenue (Million), by Country 2025 & 2033
- Figure 64: Middle East and Africa BP Cuffs Industry Volume (K Unit), by Country 2025 & 2033
- Figure 65: Middle East and Africa BP Cuffs Industry Revenue Share (%), by Country 2025 & 2033
- Figure 66: Middle East and Africa BP Cuffs Industry Volume Share (%), by Country 2025 & 2033
- Figure 67: South America BP Cuffs Industry Revenue (Million), by Usage 2025 & 2033
- Figure 68: South America BP Cuffs Industry Volume (K Unit), by Usage 2025 & 2033
- Figure 69: South America BP Cuffs Industry Revenue Share (%), by Usage 2025 & 2033
- Figure 70: South America BP Cuffs Industry Volume Share (%), by Usage 2025 & 2033
- Figure 71: South America BP Cuffs Industry Revenue (Million), by Product Type 2025 & 2033
- Figure 72: South America BP Cuffs Industry Volume (K Unit), by Product Type 2025 & 2033
- Figure 73: South America BP Cuffs Industry Revenue Share (%), by Product Type 2025 & 2033
- Figure 74: South America BP Cuffs Industry Volume Share (%), by Product Type 2025 & 2033
- Figure 75: South America BP Cuffs Industry Revenue (Million), by End User 2025 & 2033
- Figure 76: South America BP Cuffs Industry Volume (K Unit), by End User 2025 & 2033
- Figure 77: South America BP Cuffs Industry Revenue Share (%), by End User 2025 & 2033
- Figure 78: South America BP Cuffs Industry Volume Share (%), by End User 2025 & 2033
- Figure 79: South America BP Cuffs Industry Revenue (Million), by Country 2025 & 2033
- Figure 80: South America BP Cuffs Industry Volume (K Unit), by Country 2025 & 2033
- Figure 81: South America BP Cuffs Industry Revenue Share (%), by Country 2025 & 2033
- Figure 82: South America BP Cuffs Industry Volume Share (%), by Country 2025 & 2033
List of Tables
- Table 1: Global BP Cuffs Industry Revenue Million Forecast, by Usage 2020 & 2033
- Table 2: Global BP Cuffs Industry Volume K Unit Forecast, by Usage 2020 & 2033
- Table 3: Global BP Cuffs Industry Revenue Million Forecast, by Product Type 2020 & 2033
- Table 4: Global BP Cuffs Industry Volume K Unit Forecast, by Product Type 2020 & 2033
- Table 5: Global BP Cuffs Industry Revenue Million Forecast, by End User 2020 & 2033
- Table 6: Global BP Cuffs Industry Volume K Unit Forecast, by End User 2020 & 2033
- Table 7: Global BP Cuffs Industry Revenue Million Forecast, by Region 2020 & 2033
- Table 8: Global BP Cuffs Industry Volume K Unit Forecast, by Region 2020 & 2033
- Table 9: Global BP Cuffs Industry Revenue Million Forecast, by Usage 2020 & 2033
- Table 10: Global BP Cuffs Industry Volume K Unit Forecast, by Usage 2020 & 2033
- Table 11: Global BP Cuffs Industry Revenue Million Forecast, by Product Type 2020 & 2033
- Table 12: Global BP Cuffs Industry Volume K Unit Forecast, by Product Type 2020 & 2033
- Table 13: Global BP Cuffs Industry Revenue Million Forecast, by End User 2020 & 2033
- Table 14: Global BP Cuffs Industry Volume K Unit Forecast, by End User 2020 & 2033
- Table 15: Global BP Cuffs Industry Revenue Million Forecast, by Country 2020 & 2033
- Table 16: Global BP Cuffs Industry Volume K Unit Forecast, by Country 2020 & 2033
- Table 17: United States BP Cuffs Industry Revenue (Million) Forecast, by Application 2020 & 2033
- Table 18: United States BP Cuffs Industry Volume (K Unit) Forecast, by Application 2020 & 2033
- Table 19: Canada BP Cuffs Industry Revenue (Million) Forecast, by Application 2020 & 2033
- Table 20: Canada BP Cuffs Industry Volume (K Unit) Forecast, by Application 2020 & 2033
- Table 21: Mexico BP Cuffs Industry Revenue (Million) Forecast, by Application 2020 & 2033
- Table 22: Mexico BP Cuffs Industry Volume (K Unit) Forecast, by Application 2020 & 2033
- Table 23: Global BP Cuffs Industry Revenue Million Forecast, by Usage 2020 & 2033
- Table 24: Global BP Cuffs Industry Volume K Unit Forecast, by Usage 2020 & 2033
- Table 25: Global BP Cuffs Industry Revenue Million Forecast, by Product Type 2020 & 2033
- Table 26: Global BP Cuffs Industry Volume K Unit Forecast, by Product Type 2020 & 2033
- Table 27: Global BP Cuffs Industry Revenue Million Forecast, by End User 2020 & 2033
- Table 28: Global BP Cuffs Industry Volume K Unit Forecast, by End User 2020 & 2033
- Table 29: Global BP Cuffs Industry Revenue Million Forecast, by Country 2020 & 2033
- Table 30: Global BP Cuffs Industry Volume K Unit Forecast, by Country 2020 & 2033
- Table 31: Germany BP Cuffs Industry Revenue (Million) Forecast, by Application 2020 & 2033
- Table 32: Germany BP Cuffs Industry Volume (K Unit) Forecast, by Application 2020 & 2033
- Table 33: United Kingdom BP Cuffs Industry Revenue (Million) Forecast, by Application 2020 & 2033
- Table 34: United Kingdom BP Cuffs Industry Volume (K Unit) Forecast, by Application 2020 & 2033
- Table 35: France BP Cuffs Industry Revenue (Million) Forecast, by Application 2020 & 2033
- Table 36: France BP Cuffs Industry Volume (K Unit) Forecast, by Application 2020 & 2033
- Table 37: Italy BP Cuffs Industry Revenue (Million) Forecast, by Application 2020 & 2033
- Table 38: Italy BP Cuffs Industry Volume (K Unit) Forecast, by Application 2020 & 2033
- Table 39: Spain BP Cuffs Industry Revenue (Million) Forecast, by Application 2020 & 2033
- Table 40: Spain BP Cuffs Industry Volume (K Unit) Forecast, by Application 2020 & 2033
- Table 41: Rest of Europe BP Cuffs Industry Revenue (Million) Forecast, by Application 2020 & 2033
- Table 42: Rest of Europe BP Cuffs Industry Volume (K Unit) Forecast, by Application 2020 & 2033
- Table 43: Global BP Cuffs Industry Revenue Million Forecast, by Usage 2020 & 2033
- Table 44: Global BP Cuffs Industry Volume K Unit Forecast, by Usage 2020 & 2033
- Table 45: Global BP Cuffs Industry Revenue Million Forecast, by Product Type 2020 & 2033
- Table 46: Global BP Cuffs Industry Volume K Unit Forecast, by Product Type 2020 & 2033
- Table 47: Global BP Cuffs Industry Revenue Million Forecast, by End User 2020 & 2033
- Table 48: Global BP Cuffs Industry Volume K Unit Forecast, by End User 2020 & 2033
- Table 49: Global BP Cuffs Industry Revenue Million Forecast, by Country 2020 & 2033
- Table 50: Global BP Cuffs Industry Volume K Unit Forecast, by Country 2020 & 2033
- Table 51: China BP Cuffs Industry Revenue (Million) Forecast, by Application 2020 & 2033
- Table 52: China BP Cuffs Industry Volume (K Unit) Forecast, by Application 2020 & 2033
- Table 53: Japan BP Cuffs Industry Revenue (Million) Forecast, by Application 2020 & 2033
- Table 54: Japan BP Cuffs Industry Volume (K Unit) Forecast, by Application 2020 & 2033
- Table 55: India BP Cuffs Industry Revenue (Million) Forecast, by Application 2020 & 2033
- Table 56: India BP Cuffs Industry Volume (K Unit) Forecast, by Application 2020 & 2033
- Table 57: Australia BP Cuffs Industry Revenue (Million) Forecast, by Application 2020 & 2033
- Table 58: Australia BP Cuffs Industry Volume (K Unit) Forecast, by Application 2020 & 2033
- Table 59: South Korea BP Cuffs Industry Revenue (Million) Forecast, by Application 2020 & 2033
- Table 60: South Korea BP Cuffs Industry Volume (K Unit) Forecast, by Application 2020 & 2033
- Table 61: Rest of Asia Pacific BP Cuffs Industry Revenue (Million) Forecast, by Application 2020 & 2033
- Table 62: Rest of Asia Pacific BP Cuffs Industry Volume (K Unit) Forecast, by Application 2020 & 2033
- Table 63: Global BP Cuffs Industry Revenue Million Forecast, by Usage 2020 & 2033
- Table 64: Global BP Cuffs Industry Volume K Unit Forecast, by Usage 2020 & 2033
- Table 65: Global BP Cuffs Industry Revenue Million Forecast, by Product Type 2020 & 2033
- Table 66: Global BP Cuffs Industry Volume K Unit Forecast, by Product Type 2020 & 2033
- Table 67: Global BP Cuffs Industry Revenue Million Forecast, by End User 2020 & 2033
- Table 68: Global BP Cuffs Industry Volume K Unit Forecast, by End User 2020 & 2033
- Table 69: Global BP Cuffs Industry Revenue Million Forecast, by Country 2020 & 2033
- Table 70: Global BP Cuffs Industry Volume K Unit Forecast, by Country 2020 & 2033
- Table 71: GCC BP Cuffs Industry Revenue (Million) Forecast, by Application 2020 & 2033
- Table 72: GCC BP Cuffs Industry Volume (K Unit) Forecast, by Application 2020 & 2033
- Table 73: South Africa BP Cuffs Industry Revenue (Million) Forecast, by Application 2020 & 2033
- Table 74: South Africa BP Cuffs Industry Volume (K Unit) Forecast, by Application 2020 & 2033
- Table 75: Rest of Middle East and Africa BP Cuffs Industry Revenue (Million) Forecast, by Application 2020 & 2033
- Table 76: Rest of Middle East and Africa BP Cuffs Industry Volume (K Unit) Forecast, by Application 2020 & 2033
- Table 77: Global BP Cuffs Industry Revenue Million Forecast, by Usage 2020 & 2033
- Table 78: Global BP Cuffs Industry Volume K Unit Forecast, by Usage 2020 & 2033
- Table 79: Global BP Cuffs Industry Revenue Million Forecast, by Product Type 2020 & 2033
- Table 80: Global BP Cuffs Industry Volume K Unit Forecast, by Product Type 2020 & 2033
- Table 81: Global BP Cuffs Industry Revenue Million Forecast, by End User 2020 & 2033
- Table 82: Global BP Cuffs Industry Volume K Unit Forecast, by End User 2020 & 2033
- Table 83: Global BP Cuffs Industry Revenue Million Forecast, by Country 2020 & 2033
- Table 84: Global BP Cuffs Industry Volume K Unit Forecast, by Country 2020 & 2033
- Table 85: Brazil BP Cuffs Industry Revenue (Million) Forecast, by Application 2020 & 2033
- Table 86: Brazil BP Cuffs Industry Volume (K Unit) Forecast, by Application 2020 & 2033
- Table 87: Argentina BP Cuffs Industry Revenue (Million) Forecast, by Application 2020 & 2033
- Table 88: Argentina BP Cuffs Industry Volume (K Unit) Forecast, by Application 2020 & 2033
- Table 89: Rest of South America BP Cuffs Industry Revenue (Million) Forecast, by Application 2020 & 2033
- Table 90: Rest of South America BP Cuffs Industry Volume (K Unit) Forecast, by Application 2020 & 2033
Frequently Asked Questions
1. What is the projected Compound Annual Growth Rate (CAGR) of the BP Cuffs Industry?
The projected CAGR is approximately 5.89%.
2. Which companies are prominent players in the BP Cuffs Industry?
Key companies in the market include Halma PLC, Elanor Surgicals, GE Healthcare, W A Baum Co Inc , Baxter, Spengler SAS, Cardinal Health, Koninklijke Philips NV, Omron Healthcare Inc, Spacelabs Healthcare, American Diagnostic Corporation, Medline Industries Inc.
3. What are the main segments of the BP Cuffs Industry?
The market segments include Usage, Product Type, End User.
4. Can you provide details about the market size?
The market size is estimated to be USD 554.10 Million as of 2022.
5. What are some drivers contributing to market growth?
Increasing Prevalence of Hypertension; Growing Demand for Blood Monitoring Devices.
6. What are the notable trends driving market growth?
Automated Blood Pressure Cuffs Segment is Expected to Hold a Significant Market Share Over the Forecast Period.
7. Are there any restraints impacting market growth?
Threat of Infection from Reusable BP Cuffs.
8. Can you provide examples of recent developments in the market?
In September 2022, Garmin launched a smart blood pressure monitor with adjustable cuffs which allows users to measure systolic and diastolic blood pressure at home and on the go.
9. What pricing options are available for accessing the report?
Pricing options include single-user, multi-user, and enterprise licenses priced at USD 4750, USD 5250, and USD 8750 respectively.
10. Is the market size provided in terms of value or volume?
The market size is provided in terms of value, measured in Million and volume, measured in K Unit.
11. Are there any specific market keywords associated with the report?
Yes, the market keyword associated with the report is "BP Cuffs Industry," which aids in identifying and referencing the specific market segment covered.
12. How do I determine which pricing option suits my needs best?
The pricing options vary based on user requirements and access needs. Individual users may opt for single-user licenses, while businesses requiring broader access may choose multi-user or enterprise licenses for cost-effective access to the report.
13. Are there any additional resources or data provided in the BP Cuffs Industry report?
While the report offers comprehensive insights, it's advisable to review the specific contents or supplementary materials provided to ascertain if additional resources or data are available.
14. How can I stay updated on further developments or reports in the BP Cuffs Industry?
To stay informed about further developments, trends, and reports in the BP Cuffs Industry, consider subscribing to industry newsletters, following relevant companies and organizations, or regularly checking reputable industry news sources and publications.
Methodology
Step 1 - Identification of Relevant Samples Size from Population Database


Step 2 - Approaches for Defining Global Market Size (Value, Volume* & Price*)

Note*: In applicable scenarios
Step 3 - Data Sources
Primary Research
- Web Analytics
- Survey Reports
- Research Institute
- Latest Research Reports
- Opinion Leaders
Secondary Research
- Annual Reports
- White Paper
- Latest Press Release
- Industry Association
- Paid Database
- Investor Presentations

Step 4 - Data Triangulation
Involves using different sources of information in order to increase the validity of a study
These sources are likely to be stakeholders in a program - participants, other researchers, program staff, other community members, and so on.
Then we put all data in single framework & apply various statistical tools to find out the dynamic on the market.
During the analysis stage, feedback from the stakeholder groups would be compared to determine areas of agreement as well as areas of divergence

