


Key Insights
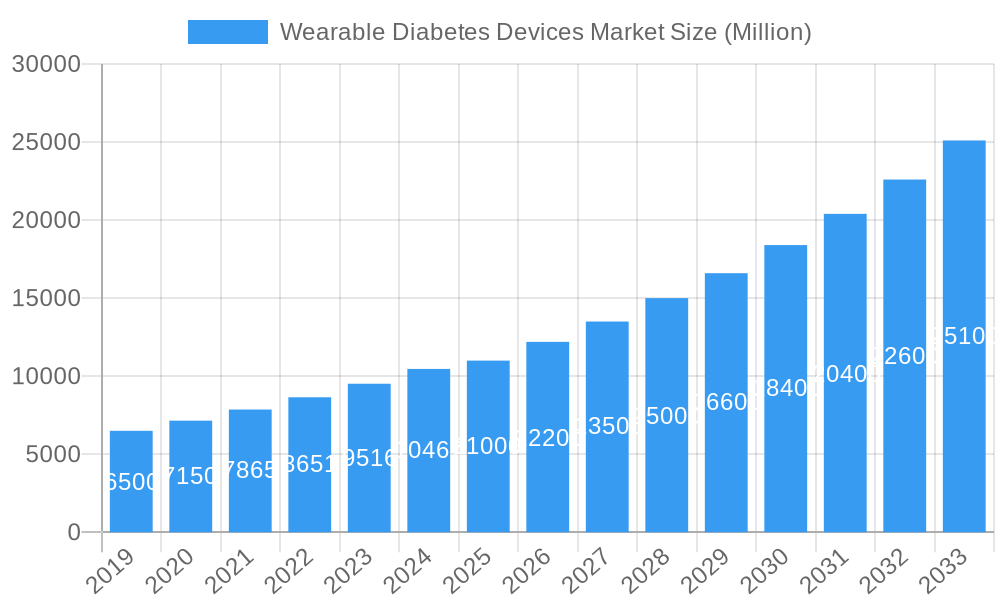
The global Wearable Diabetes Devices Market is poised for substantial expansion, projected to reach an estimated $11,000 million by 2025. This impressive growth trajectory is fueled by a Compound Annual Growth Rate (CAGR) exceeding 10.00% over the forecast period of 2025-2033. Key drivers propelling this market include the escalating prevalence of diabetes worldwide, a growing demand for convenient and non-invasive monitoring solutions, and continuous technological advancements in miniaturization and data analytics. The increasing awareness among patients about proactive disease management, coupled with favorable reimbursement policies in developed economies, further bolsters market adoption. The market is segmented into Continuous Glucose Monitoring (CGM) Devices, encompassing sensors and durables, and Insulin Pumps, which include pump devices, infusion sets, and reservoirs. The rising preference for non-invasive glucose monitoring devices signifies a significant shift towards patient comfort and reduced procedural burdens.
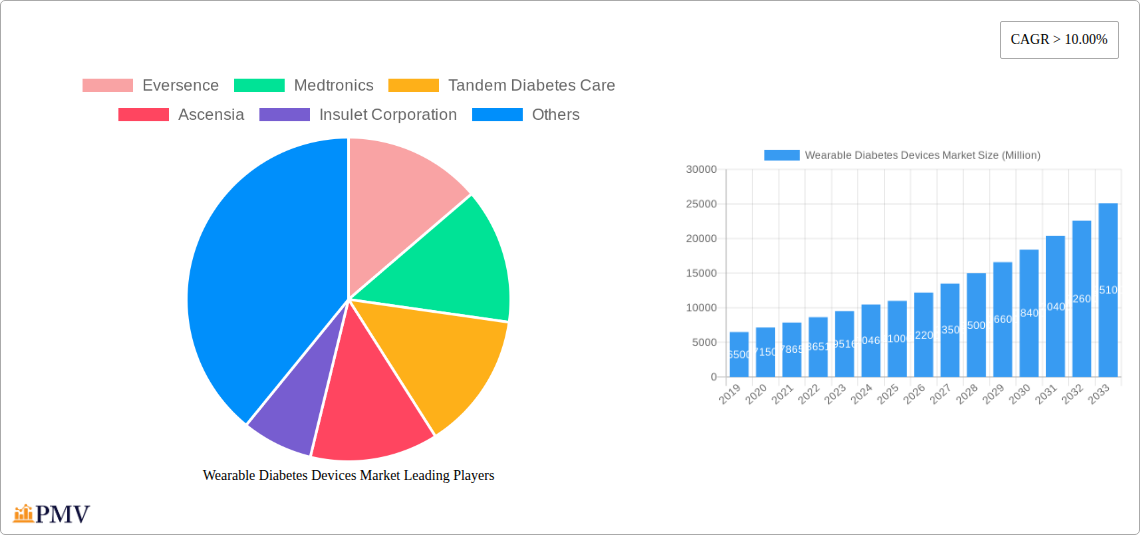
Wearable Diabetes Devices Market Market Size (In Billion)

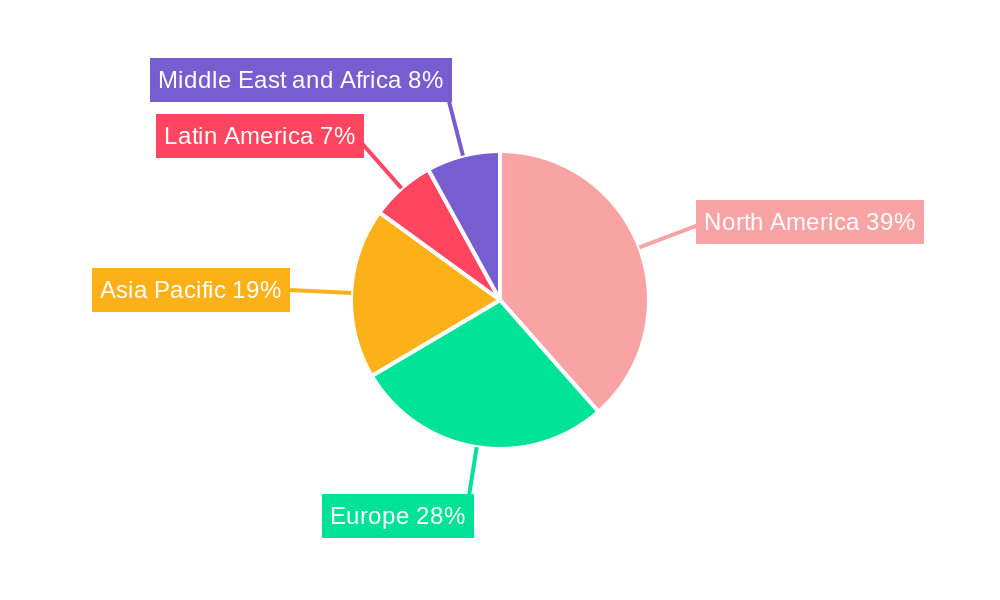
The Wearable Diabetes Devices Market is characterized by a dynamic competitive landscape, with major players like Eversense, Medtronics, Tandem Diabetes Care, Ascensia, Insulet Corporation, Abbott, Ypsomped, and Dexcom spearheading innovation and market penetration. North America currently dominates the market, driven by high adoption rates of advanced diabetes management technologies and a robust healthcare infrastructure. Europe also presents a significant market share, with countries like Germany and the UK leading in adoption. Emerging markets in the Asia Pacific, particularly China and India, are anticipated to witness substantial growth due to a growing diabetic population and increasing healthcare expenditure. The market’s restrained factors are primarily associated with the high cost of some advanced devices and the need for greater regulatory clarity in certain regions, which are being addressed through ongoing innovation and strategic collaborations to enhance accessibility and affordability for a wider patient base.
Wearable Diabetes Devices Market Company Market Share
This in-depth wearable diabetes devices market report offers an unparalleled analysis of the global landscape, covering continuous glucose monitoring (CGM) devices, insulin pumps, non-invasive glucose monitoring devices, and their adoption across hospitals/clinics and home/personal use. Spanning the historical period of 2019-2024, base year 2025, and a forecast period of 2025-2033, this report provides critical insights for stakeholders seeking to navigate the rapidly evolving diabetes technology market. The global wearable diabetes devices market is projected to reach USD XXX Million by 2025, with a significant CAGR of XX% expected during the forecast period.
Wearable Diabetes Devices Market Market Structure & Competitive Dynamics
The wearable diabetes devices market exhibits a dynamic and competitive structure, characterized by significant innovation and strategic partnerships among leading players such as Abbott, Medtronic, Dexcom, and Insulet Corporation. Market concentration is moderately high, with a few key companies dominating a substantial share of the global revenue. The innovation ecosystem thrives on advancements in sensor technology, artificial intelligence for automated insulin delivery (AID) systems, and enhanced connectivity for remote patient monitoring. Regulatory frameworks, particularly FDA approvals, play a pivotal role in market entry and product adoption. While non-invasive glucose monitoring devices present a promising substitute, their commercial viability remains under intense research and development. End-user trends lean towards increased demand for user-friendly, integrated, and data-driven solutions, driving the growth of smart insulin pens and wearable insulin pumps. Mergers and acquisitions (M&A) activities are observed as companies seek to expand their product portfolios and geographic reach, with recent deal values estimated in the hundreds of millions of USD. For instance, acquisitions of smaller tech firms specializing in AI algorithms for diabetes management are becoming increasingly common.
Wearable Diabetes Devices Market Industry Trends & Insights
The wearable diabetes devices market is experiencing robust growth, fueled by a confluence of factors including the rising global prevalence of diabetes, increasing health consciousness, and rapid technological advancements. The market is projected to reach USD XXX Million by 2025, demonstrating a projected CAGR of XX% during the forecast period. Key growth drivers include the escalating incidence of type 1 and type 2 diabetes, which necessitates continuous monitoring and effective glucose management. Technological disruptions, such as the development of miniaturized sensors, enhanced data analytics through AI, and seamless integration with smartphones and cloud platforms, are transforming patient care. Consumer preferences are increasingly shifting towards less invasive, more convenient, and personalized diabetes management solutions. The demand for continuous glucose monitoring (CGM) devices is surging due to their ability to provide real-time glucose readings and trend data, empowering individuals to make informed lifestyle and treatment decisions. Similarly, the market for insulin pumps, including advanced insulin infusion sets and sophisticated pump devices, is expanding as users seek more precise and automated insulin delivery. The penetration of these devices in both developed and emerging economies is on an upward trajectory. Competitive dynamics are characterized by intense innovation and strategic collaborations aimed at developing next-generation wearable diabetes technology.
Dominant Markets & Segments in Wearable Diabetes Devices Market
The wearable diabetes devices market showcases distinct regional and segment dominance. North America currently holds the largest market share, driven by high diabetes prevalence, strong reimbursement policies, and early adoption of advanced medical technologies. Within North America, the United States leads, propelled by significant investments in diabetes research and development and the presence of key market players like Abbott and Medtronic.
Device Segments:
- Continuous Glucose Monitoring (CGM) Devices: This segment is a major growth driver, projected to reach USD XXX Million by 2025.
- Sensors: Demand for disposable CGM sensors remains high, with advancements focusing on longer wear times and improved accuracy.
- Durables: The market for durable CGM transmitters is expanding, offering cost-effectiveness for long-term users.
- Insulin Pumps: This segment, valued at USD XXX Million in 2025, is also experiencing steady growth.
- Insulin Pump Devices: Innovations in wearable and tubeless insulin pumps are gaining traction, offering enhanced mobility and comfort.
- Insulin Infusion Sets: Advancements in infusion set materials and insertion techniques are improving user experience and reducing complications.
- Reservoirs: Increased pump usage directly correlates with higher demand for insulin reservoirs.
Type Segment:
- Non-Invasive Glucose Monitoring Devices: While still in the nascent stages of commercialization, this segment holds immense future potential, with ongoing research aiming to replace traditional blood glucose testing methods. The market for these devices is expected to witness substantial growth once commercially viable solutions emerge, potentially impacting the current CGM market share.
End User Segment:
- Home/Personal: This segment is the dominant end-user category, accounting for over XX% of the market share in 2025.
- Key Drivers: Increasing patient awareness, preference for self-management, and favorable reimbursement policies for home-use devices.
- Hospital/Clinics: This segment contributes significantly, particularly for initial device fitting, training, and management of complex diabetes cases.
- Key Drivers: Growing adoption of connected care models and the need for continuous patient monitoring in clinical settings.
The dominance of the Home/Personal segment is attributed to the inherent nature of wearable devices, designed for continuous, day-to-day management by individuals with diabetes. Economic policies supporting diabetes care, advanced healthcare infrastructure, and a growing disposable income in key regions further solidify this dominance.
Wearable Diabetes Devices Market Product Innovations
Product innovations in the wearable diabetes devices market are primarily focused on enhancing accuracy, miniaturization, user-friendliness, and data integration. Continuous Glucose Monitoring (CGM) systems are seeing advancements in sensor longevity, requiring fewer replacements and offering greater convenience. For instance, the Eversense E3 CGM System, with its extended wear capabilities, exemplifies this trend. Insulin pumps are evolving towards more discreet, tubeless designs and sophisticated automated insulin delivery (AID) algorithms, like the iLet Bionic Pancreas from Beta Bionics, which intelligently adjust insulin delivery based on real-time glucose data. The competitive advantage lies in seamless connectivity, allowing data sharing with healthcare providers and the development of predictive analytics for proactive diabetes management.
Report Segmentation & Scope
This report meticulously segments the wearable diabetes devices market to provide granular insights. The segmentation encompasses key product categories and end-user demographics.
- Device: This segmentation covers Continuous Glucose Monitoring Devices (including Sensors and Durables) and Insulin Pumps (further divided into Insulin Pump Devices, Insulin Infusion Sets, and Reservoirs). The CGM Devices segment is projected to grow at a CAGR of XX%, reaching USD XXX Million by 2033, while Insulin Pumps are expected to grow at XX%, reaching USD XXX Million. Competitive dynamics within these segments are driven by technological innovation and brand loyalty.
- Type: This segment analyzes the market for Non-Invasive Glucose Monitoring Devices. While currently in its early stages, this segment is anticipated to witness significant growth as research progresses, potentially disrupting the existing market landscape.
- End User: This segmentation categorizes the market into Hospital/Clinics and Home/Personal users. The Home/Personal segment is expected to dominate, driven by the increasing trend of self-management and home-based healthcare, with projected market share of over XX% by 2033.
The scope of this report is global, with detailed analysis for key regions including North America, Europe, Asia Pacific, Latin America, and the Middle East & Africa.
Key Drivers of Wearable Diabetes Devices Market Growth
The wearable diabetes devices market is propelled by several key drivers. Technologically, the continuous miniaturization of sensors, advancements in AI-driven algorithms for automated insulin delivery (AID) systems, and improved wireless connectivity for seamless data sharing are paramount. Economically, rising healthcare expenditures, favorable reimbursement policies for diabetes management devices in developed nations, and increasing disposable incomes in emerging markets are significant catalysts. Regulatory factors, such as timely FDA approvals and evolving guidelines for connected medical devices, also play a crucial role in market expansion. The increasing global prevalence of diabetes, estimated to affect over XXX Million individuals by 2030, directly translates into a larger addressable market for these life-saving technologies.
Challenges in the Wearable Diabetes Devices Market Sector
Despite its promising growth, the wearable diabetes devices market faces several challenges. Regulatory hurdles and the stringent approval processes for medical devices can lead to extended time-to-market and increased development costs. Supply chain disruptions, particularly for electronic components and specialized materials, can impact production volumes and lead times. Competitive pressures from established players and emerging innovators necessitate continuous investment in research and development, potentially straining resources for smaller companies. Furthermore, the high cost of some advanced wearable devices can pose a barrier to adoption, especially in price-sensitive markets. Data security and privacy concerns surrounding the sensitive health information collected by these devices also require robust mitigation strategies.
Leading Players in the Wearable Diabetes Devices Market Market
- Eversense
- Medtronics
- Tandem Diabetes Care
- Ascensia
- Insulet Corporation
- Abbott
- Ypsomped
- Dexcom
Key Developments in Wearable Diabetes Devices Market Sector
- May 2023: The Beta Bionics iLet ACE Pump and the iLet Dosing Decision Software have been granted clearance by the U.S. Food and Drug Administration for individuals aged six and above who have type 1 diabetes. When combined with a compatible FDA-cleared integrated continuous glucose monitor (iCGM), these two devices will create a novel system known as the iLet Bionic Pancreas. This innovative automated insulin dosing (AID) system employs an algorithm to ascertain and direct the administration of insulin, signifying a major leap in closed-loop diabetes management.
- March 2023: The FDA has approved the Eversense E3 Continuous Glucose Monitoring (CGM) System. This innovative system offers real-time monitoring of blood sugar (glucose) levels and tracks their trends over time. Users can conveniently access this information through a mobile app installed on their smartphone, tablet, or other compatible device, highlighting advancements in long-term wearable CGM technology.
Strategic Wearable Diabetes Devices Market Market Outlook
The strategic outlook for the wearable diabetes devices market is exceptionally positive, driven by ongoing innovation and increasing global demand. The market is poised for accelerated growth through strategic partnerships between technology companies and healthcare providers, focusing on integrated care solutions. The continued development of non-invasive glucose monitoring devices represents a significant future growth accelerator, with the potential to revolutionize diabetes management. Emphasis on user experience, affordability, and enhanced data analytics will be crucial for market expansion, particularly in emerging economies. The growing adoption of telemedicine and remote patient monitoring further underscores the strategic importance of connected wearable diabetes devices, creating substantial opportunities for market players to enhance patient outcomes and redefine diabetes care. The market is projected to witness substantial M&A activities as companies seek to consolidate their positions and acquire innovative technologies.
Wearable Diabetes Devices Market Segmentation
-
1. Device
-
1.1. Continuous Glucose Monitoring Devices
- 1.1.1. Sensors
- 1.1.2. Durables
-
1.2. Insulin Pumps
- 1.2.1. Insulin Pump Devices
- 1.2.2. Insulin Infusion Sets
- 1.2.3. Reservoirs
-
1.1. Continuous Glucose Monitoring Devices
-
2. Type
- 2.1. Non-Invasive Glucose Monitoring Devices
-
3. End User
- 3.1. Hospital/Clinics
- 3.2. Home/Personal
Wearable Diabetes Devices Market Segmentation By Geography
-
1. North America
- 1.1. United States
- 1.2. Canada
- 1.3. Rest of North America
-
2. Europe
- 2.1. France
- 2.2. Germany
- 2.3. Italy
- 2.4. Spain
- 2.5. United Kingdom
- 2.6. Russia
- 2.7. Rest of Europe
-
3. Latin America
- 3.1. Mexico
- 3.2. Brazil
- 3.3. Rest of Latin America
-
4. Asia Pacific
- 4.1. Japan
- 4.2. South Korea
- 4.3. China
- 4.4. India
- 4.5. Australia
- 4.6. Vietnam
- 4.7. Malaysia
- 4.8. Indonesia
- 4.9. Thailand
- 4.10. Rest of Asia Pacific
-
5. Middle East and Africa
- 5.1. Saudi Arabia
- 5.2. Iran
- 5.3. Egypt
- 5.4. Oman
- 5.5. South Africa
- 5.6. Rest of Middle East and Africa
Wearable Diabetes Devices Market Regional Market Share
Geographic Coverage of Wearable Diabetes Devices Market
Wearable Diabetes Devices Market REPORT HIGHLIGHTS
| Aspects | Details |
|---|---|
| Study Period | 2020-2034 |
| Base Year | 2025 |
| Estimated Year | 2026 |
| Forecast Period | 2026-2034 |
| Historical Period | 2020-2025 |
| Growth Rate | CAGR of > 10.00% from 2020-2034 |
| Segmentation |
|
Table of Contents
- 1. Introduction
- 1.1. Research Scope
- 1.2. Market Segmentation
- 1.3. Research Methodology
- 1.4. Definitions and Assumptions
- 2. Executive Summary
- 2.1. Introduction
- 3. Market Dynamics
- 3.1. Introduction
- 3.2. Market Drivers
- 3.2.1. Rapidly Increasing Incidence and Prevalence of Diabetes; Technological Advancements in the Market
- 3.3. Market Restrains
- 3.3.1. Monopolized Supply Chain and High Cost of Devices
- 3.4. Market Trends
- 3.4.1. Rising diabetes prevalence globally is driving the market in forecast years
- 4. Market Factor Analysis
- 4.1. Porters Five Forces
- 4.2. Supply/Value Chain
- 4.3. PESTEL analysis
- 4.4. Market Entropy
- 4.5. Patent/Trademark Analysis
- 5. Global Wearable Diabetes Devices Market Analysis, Insights and Forecast, 2020-2032
- 5.1. Market Analysis, Insights and Forecast - by Device
- 5.1.1. Continuous Glucose Monitoring Devices
- 5.1.1.1. Sensors
- 5.1.1.2. Durables
- 5.1.2. Insulin Pumps
- 5.1.2.1. Insulin Pump Devices
- 5.1.2.2. Insulin Infusion Sets
- 5.1.2.3. Reservoirs
- 5.1.1. Continuous Glucose Monitoring Devices
- 5.2. Market Analysis, Insights and Forecast - by Type
- 5.2.1. Non-Invasive Glucose Monitoring Devices
- 5.3. Market Analysis, Insights and Forecast - by End User
- 5.3.1. Hospital/Clinics
- 5.3.2. Home/Personal
- 5.4. Market Analysis, Insights and Forecast - by Region
- 5.4.1. North America
- 5.4.2. Europe
- 5.4.3. Latin America
- 5.4.4. Asia Pacific
- 5.4.5. Middle East and Africa
- 5.1. Market Analysis, Insights and Forecast - by Device
- 6. North America Wearable Diabetes Devices Market Analysis, Insights and Forecast, 2020-2032
- 6.1. Market Analysis, Insights and Forecast - by Device
- 6.1.1. Continuous Glucose Monitoring Devices
- 6.1.1.1. Sensors
- 6.1.1.2. Durables
- 6.1.2. Insulin Pumps
- 6.1.2.1. Insulin Pump Devices
- 6.1.2.2. Insulin Infusion Sets
- 6.1.2.3. Reservoirs
- 6.1.1. Continuous Glucose Monitoring Devices
- 6.2. Market Analysis, Insights and Forecast - by Type
- 6.2.1. Non-Invasive Glucose Monitoring Devices
- 6.3. Market Analysis, Insights and Forecast - by End User
- 6.3.1. Hospital/Clinics
- 6.3.2. Home/Personal
- 6.1. Market Analysis, Insights and Forecast - by Device
- 7. Europe Wearable Diabetes Devices Market Analysis, Insights and Forecast, 2020-2032
- 7.1. Market Analysis, Insights and Forecast - by Device
- 7.1.1. Continuous Glucose Monitoring Devices
- 7.1.1.1. Sensors
- 7.1.1.2. Durables
- 7.1.2. Insulin Pumps
- 7.1.2.1. Insulin Pump Devices
- 7.1.2.2. Insulin Infusion Sets
- 7.1.2.3. Reservoirs
- 7.1.1. Continuous Glucose Monitoring Devices
- 7.2. Market Analysis, Insights and Forecast - by Type
- 7.2.1. Non-Invasive Glucose Monitoring Devices
- 7.3. Market Analysis, Insights and Forecast - by End User
- 7.3.1. Hospital/Clinics
- 7.3.2. Home/Personal
- 7.1. Market Analysis, Insights and Forecast - by Device
- 8. Latin America Wearable Diabetes Devices Market Analysis, Insights and Forecast, 2020-2032
- 8.1. Market Analysis, Insights and Forecast - by Device
- 8.1.1. Continuous Glucose Monitoring Devices
- 8.1.1.1. Sensors
- 8.1.1.2. Durables
- 8.1.2. Insulin Pumps
- 8.1.2.1. Insulin Pump Devices
- 8.1.2.2. Insulin Infusion Sets
- 8.1.2.3. Reservoirs
- 8.1.1. Continuous Glucose Monitoring Devices
- 8.2. Market Analysis, Insights and Forecast - by Type
- 8.2.1. Non-Invasive Glucose Monitoring Devices
- 8.3. Market Analysis, Insights and Forecast - by End User
- 8.3.1. Hospital/Clinics
- 8.3.2. Home/Personal
- 8.1. Market Analysis, Insights and Forecast - by Device
- 9. Asia Pacific Wearable Diabetes Devices Market Analysis, Insights and Forecast, 2020-2032
- 9.1. Market Analysis, Insights and Forecast - by Device
- 9.1.1. Continuous Glucose Monitoring Devices
- 9.1.1.1. Sensors
- 9.1.1.2. Durables
- 9.1.2. Insulin Pumps
- 9.1.2.1. Insulin Pump Devices
- 9.1.2.2. Insulin Infusion Sets
- 9.1.2.3. Reservoirs
- 9.1.1. Continuous Glucose Monitoring Devices
- 9.2. Market Analysis, Insights and Forecast - by Type
- 9.2.1. Non-Invasive Glucose Monitoring Devices
- 9.3. Market Analysis, Insights and Forecast - by End User
- 9.3.1. Hospital/Clinics
- 9.3.2. Home/Personal
- 9.1. Market Analysis, Insights and Forecast - by Device
- 10. Middle East and Africa Wearable Diabetes Devices Market Analysis, Insights and Forecast, 2020-2032
- 10.1. Market Analysis, Insights and Forecast - by Device
- 10.1.1. Continuous Glucose Monitoring Devices
- 10.1.1.1. Sensors
- 10.1.1.2. Durables
- 10.1.2. Insulin Pumps
- 10.1.2.1. Insulin Pump Devices
- 10.1.2.2. Insulin Infusion Sets
- 10.1.2.3. Reservoirs
- 10.1.1. Continuous Glucose Monitoring Devices
- 10.2. Market Analysis, Insights and Forecast - by Type
- 10.2.1. Non-Invasive Glucose Monitoring Devices
- 10.3. Market Analysis, Insights and Forecast - by End User
- 10.3.1. Hospital/Clinics
- 10.3.2. Home/Personal
- 10.1. Market Analysis, Insights and Forecast - by Device
- 11. Competitive Analysis
- 11.1. Global Market Share Analysis 2025
- 11.2. Company Profiles
- 11.2.1 Eversence
- 11.2.1.1. Overview
- 11.2.1.2. Products
- 11.2.1.3. SWOT Analysis
- 11.2.1.4. Recent Developments
- 11.2.1.5. Financials (Based on Availability)
- 11.2.2 Medtronics
- 11.2.2.1. Overview
- 11.2.2.2. Products
- 11.2.2.3. SWOT Analysis
- 11.2.2.4. Recent Developments
- 11.2.2.5. Financials (Based on Availability)
- 11.2.3 Tandem Diabetes Care
- 11.2.3.1. Overview
- 11.2.3.2. Products
- 11.2.3.3. SWOT Analysis
- 11.2.3.4. Recent Developments
- 11.2.3.5. Financials (Based on Availability)
- 11.2.4 Ascensia
- 11.2.4.1. Overview
- 11.2.4.2. Products
- 11.2.4.3. SWOT Analysis
- 11.2.4.4. Recent Developments
- 11.2.4.5. Financials (Based on Availability)
- 11.2.5 Insulet Corporation
- 11.2.5.1. Overview
- 11.2.5.2. Products
- 11.2.5.3. SWOT Analysis
- 11.2.5.4. Recent Developments
- 11.2.5.5. Financials (Based on Availability)
- 11.2.6 Abbott
- 11.2.6.1. Overview
- 11.2.6.2. Products
- 11.2.6.3. SWOT Analysis
- 11.2.6.4. Recent Developments
- 11.2.6.5. Financials (Based on Availability)
- 11.2.7 Ypsomped
- 11.2.7.1. Overview
- 11.2.7.2. Products
- 11.2.7.3. SWOT Analysis
- 11.2.7.4. Recent Developments
- 11.2.7.5. Financials (Based on Availability)
- 11.2.8 Dexcom
- 11.2.8.1. Overview
- 11.2.8.2. Products
- 11.2.8.3. SWOT Analysis
- 11.2.8.4. Recent Developments
- 11.2.8.5. Financials (Based on Availability)
- 11.2.1 Eversence
List of Figures
- Figure 1: Global Wearable Diabetes Devices Market Revenue Breakdown (Million, %) by Region 2025 & 2033
- Figure 2: Global Wearable Diabetes Devices Market Volume Breakdown (K Unit, %) by Region 2025 & 2033
- Figure 3: North America Wearable Diabetes Devices Market Revenue (Million), by Device 2025 & 2033
- Figure 4: North America Wearable Diabetes Devices Market Volume (K Unit), by Device 2025 & 2033
- Figure 5: North America Wearable Diabetes Devices Market Revenue Share (%), by Device 2025 & 2033
- Figure 6: North America Wearable Diabetes Devices Market Volume Share (%), by Device 2025 & 2033
- Figure 7: North America Wearable Diabetes Devices Market Revenue (Million), by Type 2025 & 2033
- Figure 8: North America Wearable Diabetes Devices Market Volume (K Unit), by Type 2025 & 2033
- Figure 9: North America Wearable Diabetes Devices Market Revenue Share (%), by Type 2025 & 2033
- Figure 10: North America Wearable Diabetes Devices Market Volume Share (%), by Type 2025 & 2033
- Figure 11: North America Wearable Diabetes Devices Market Revenue (Million), by End User 2025 & 2033
- Figure 12: North America Wearable Diabetes Devices Market Volume (K Unit), by End User 2025 & 2033
- Figure 13: North America Wearable Diabetes Devices Market Revenue Share (%), by End User 2025 & 2033
- Figure 14: North America Wearable Diabetes Devices Market Volume Share (%), by End User 2025 & 2033
- Figure 15: North America Wearable Diabetes Devices Market Revenue (Million), by Country 2025 & 2033
- Figure 16: North America Wearable Diabetes Devices Market Volume (K Unit), by Country 2025 & 2033
- Figure 17: North America Wearable Diabetes Devices Market Revenue Share (%), by Country 2025 & 2033
- Figure 18: North America Wearable Diabetes Devices Market Volume Share (%), by Country 2025 & 2033
- Figure 19: Europe Wearable Diabetes Devices Market Revenue (Million), by Device 2025 & 2033
- Figure 20: Europe Wearable Diabetes Devices Market Volume (K Unit), by Device 2025 & 2033
- Figure 21: Europe Wearable Diabetes Devices Market Revenue Share (%), by Device 2025 & 2033
- Figure 22: Europe Wearable Diabetes Devices Market Volume Share (%), by Device 2025 & 2033
- Figure 23: Europe Wearable Diabetes Devices Market Revenue (Million), by Type 2025 & 2033
- Figure 24: Europe Wearable Diabetes Devices Market Volume (K Unit), by Type 2025 & 2033
- Figure 25: Europe Wearable Diabetes Devices Market Revenue Share (%), by Type 2025 & 2033
- Figure 26: Europe Wearable Diabetes Devices Market Volume Share (%), by Type 2025 & 2033
- Figure 27: Europe Wearable Diabetes Devices Market Revenue (Million), by End User 2025 & 2033
- Figure 28: Europe Wearable Diabetes Devices Market Volume (K Unit), by End User 2025 & 2033
- Figure 29: Europe Wearable Diabetes Devices Market Revenue Share (%), by End User 2025 & 2033
- Figure 30: Europe Wearable Diabetes Devices Market Volume Share (%), by End User 2025 & 2033
- Figure 31: Europe Wearable Diabetes Devices Market Revenue (Million), by Country 2025 & 2033
- Figure 32: Europe Wearable Diabetes Devices Market Volume (K Unit), by Country 2025 & 2033
- Figure 33: Europe Wearable Diabetes Devices Market Revenue Share (%), by Country 2025 & 2033
- Figure 34: Europe Wearable Diabetes Devices Market Volume Share (%), by Country 2025 & 2033
- Figure 35: Latin America Wearable Diabetes Devices Market Revenue (Million), by Device 2025 & 2033
- Figure 36: Latin America Wearable Diabetes Devices Market Volume (K Unit), by Device 2025 & 2033
- Figure 37: Latin America Wearable Diabetes Devices Market Revenue Share (%), by Device 2025 & 2033
- Figure 38: Latin America Wearable Diabetes Devices Market Volume Share (%), by Device 2025 & 2033
- Figure 39: Latin America Wearable Diabetes Devices Market Revenue (Million), by Type 2025 & 2033
- Figure 40: Latin America Wearable Diabetes Devices Market Volume (K Unit), by Type 2025 & 2033
- Figure 41: Latin America Wearable Diabetes Devices Market Revenue Share (%), by Type 2025 & 2033
- Figure 42: Latin America Wearable Diabetes Devices Market Volume Share (%), by Type 2025 & 2033
- Figure 43: Latin America Wearable Diabetes Devices Market Revenue (Million), by End User 2025 & 2033
- Figure 44: Latin America Wearable Diabetes Devices Market Volume (K Unit), by End User 2025 & 2033
- Figure 45: Latin America Wearable Diabetes Devices Market Revenue Share (%), by End User 2025 & 2033
- Figure 46: Latin America Wearable Diabetes Devices Market Volume Share (%), by End User 2025 & 2033
- Figure 47: Latin America Wearable Diabetes Devices Market Revenue (Million), by Country 2025 & 2033
- Figure 48: Latin America Wearable Diabetes Devices Market Volume (K Unit), by Country 2025 & 2033
- Figure 49: Latin America Wearable Diabetes Devices Market Revenue Share (%), by Country 2025 & 2033
- Figure 50: Latin America Wearable Diabetes Devices Market Volume Share (%), by Country 2025 & 2033
- Figure 51: Asia Pacific Wearable Diabetes Devices Market Revenue (Million), by Device 2025 & 2033
- Figure 52: Asia Pacific Wearable Diabetes Devices Market Volume (K Unit), by Device 2025 & 2033
- Figure 53: Asia Pacific Wearable Diabetes Devices Market Revenue Share (%), by Device 2025 & 2033
- Figure 54: Asia Pacific Wearable Diabetes Devices Market Volume Share (%), by Device 2025 & 2033
- Figure 55: Asia Pacific Wearable Diabetes Devices Market Revenue (Million), by Type 2025 & 2033
- Figure 56: Asia Pacific Wearable Diabetes Devices Market Volume (K Unit), by Type 2025 & 2033
- Figure 57: Asia Pacific Wearable Diabetes Devices Market Revenue Share (%), by Type 2025 & 2033
- Figure 58: Asia Pacific Wearable Diabetes Devices Market Volume Share (%), by Type 2025 & 2033
- Figure 59: Asia Pacific Wearable Diabetes Devices Market Revenue (Million), by End User 2025 & 2033
- Figure 60: Asia Pacific Wearable Diabetes Devices Market Volume (K Unit), by End User 2025 & 2033
- Figure 61: Asia Pacific Wearable Diabetes Devices Market Revenue Share (%), by End User 2025 & 2033
- Figure 62: Asia Pacific Wearable Diabetes Devices Market Volume Share (%), by End User 2025 & 2033
- Figure 63: Asia Pacific Wearable Diabetes Devices Market Revenue (Million), by Country 2025 & 2033
- Figure 64: Asia Pacific Wearable Diabetes Devices Market Volume (K Unit), by Country 2025 & 2033
- Figure 65: Asia Pacific Wearable Diabetes Devices Market Revenue Share (%), by Country 2025 & 2033
- Figure 66: Asia Pacific Wearable Diabetes Devices Market Volume Share (%), by Country 2025 & 2033
- Figure 67: Middle East and Africa Wearable Diabetes Devices Market Revenue (Million), by Device 2025 & 2033
- Figure 68: Middle East and Africa Wearable Diabetes Devices Market Volume (K Unit), by Device 2025 & 2033
- Figure 69: Middle East and Africa Wearable Diabetes Devices Market Revenue Share (%), by Device 2025 & 2033
- Figure 70: Middle East and Africa Wearable Diabetes Devices Market Volume Share (%), by Device 2025 & 2033
- Figure 71: Middle East and Africa Wearable Diabetes Devices Market Revenue (Million), by Type 2025 & 2033
- Figure 72: Middle East and Africa Wearable Diabetes Devices Market Volume (K Unit), by Type 2025 & 2033
- Figure 73: Middle East and Africa Wearable Diabetes Devices Market Revenue Share (%), by Type 2025 & 2033
- Figure 74: Middle East and Africa Wearable Diabetes Devices Market Volume Share (%), by Type 2025 & 2033
- Figure 75: Middle East and Africa Wearable Diabetes Devices Market Revenue (Million), by End User 2025 & 2033
- Figure 76: Middle East and Africa Wearable Diabetes Devices Market Volume (K Unit), by End User 2025 & 2033
- Figure 77: Middle East and Africa Wearable Diabetes Devices Market Revenue Share (%), by End User 2025 & 2033
- Figure 78: Middle East and Africa Wearable Diabetes Devices Market Volume Share (%), by End User 2025 & 2033
- Figure 79: Middle East and Africa Wearable Diabetes Devices Market Revenue (Million), by Country 2025 & 2033
- Figure 80: Middle East and Africa Wearable Diabetes Devices Market Volume (K Unit), by Country 2025 & 2033
- Figure 81: Middle East and Africa Wearable Diabetes Devices Market Revenue Share (%), by Country 2025 & 2033
- Figure 82: Middle East and Africa Wearable Diabetes Devices Market Volume Share (%), by Country 2025 & 2033
List of Tables
- Table 1: Global Wearable Diabetes Devices Market Revenue Million Forecast, by Device 2020 & 2033
- Table 2: Global Wearable Diabetes Devices Market Volume K Unit Forecast, by Device 2020 & 2033
- Table 3: Global Wearable Diabetes Devices Market Revenue Million Forecast, by Type 2020 & 2033
- Table 4: Global Wearable Diabetes Devices Market Volume K Unit Forecast, by Type 2020 & 2033
- Table 5: Global Wearable Diabetes Devices Market Revenue Million Forecast, by End User 2020 & 2033
- Table 6: Global Wearable Diabetes Devices Market Volume K Unit Forecast, by End User 2020 & 2033
- Table 7: Global Wearable Diabetes Devices Market Revenue Million Forecast, by Region 2020 & 2033
- Table 8: Global Wearable Diabetes Devices Market Volume K Unit Forecast, by Region 2020 & 2033
- Table 9: Global Wearable Diabetes Devices Market Revenue Million Forecast, by Device 2020 & 2033
- Table 10: Global Wearable Diabetes Devices Market Volume K Unit Forecast, by Device 2020 & 2033
- Table 11: Global Wearable Diabetes Devices Market Revenue Million Forecast, by Type 2020 & 2033
- Table 12: Global Wearable Diabetes Devices Market Volume K Unit Forecast, by Type 2020 & 2033
- Table 13: Global Wearable Diabetes Devices Market Revenue Million Forecast, by End User 2020 & 2033
- Table 14: Global Wearable Diabetes Devices Market Volume K Unit Forecast, by End User 2020 & 2033
- Table 15: Global Wearable Diabetes Devices Market Revenue Million Forecast, by Country 2020 & 2033
- Table 16: Global Wearable Diabetes Devices Market Volume K Unit Forecast, by Country 2020 & 2033
- Table 17: United States Wearable Diabetes Devices Market Revenue (Million) Forecast, by Application 2020 & 2033
- Table 18: United States Wearable Diabetes Devices Market Volume (K Unit) Forecast, by Application 2020 & 2033
- Table 19: Canada Wearable Diabetes Devices Market Revenue (Million) Forecast, by Application 2020 & 2033
- Table 20: Canada Wearable Diabetes Devices Market Volume (K Unit) Forecast, by Application 2020 & 2033
- Table 21: Rest of North America Wearable Diabetes Devices Market Revenue (Million) Forecast, by Application 2020 & 2033
- Table 22: Rest of North America Wearable Diabetes Devices Market Volume (K Unit) Forecast, by Application 2020 & 2033
- Table 23: Global Wearable Diabetes Devices Market Revenue Million Forecast, by Device 2020 & 2033
- Table 24: Global Wearable Diabetes Devices Market Volume K Unit Forecast, by Device 2020 & 2033
- Table 25: Global Wearable Diabetes Devices Market Revenue Million Forecast, by Type 2020 & 2033
- Table 26: Global Wearable Diabetes Devices Market Volume K Unit Forecast, by Type 2020 & 2033
- Table 27: Global Wearable Diabetes Devices Market Revenue Million Forecast, by End User 2020 & 2033
- Table 28: Global Wearable Diabetes Devices Market Volume K Unit Forecast, by End User 2020 & 2033
- Table 29: Global Wearable Diabetes Devices Market Revenue Million Forecast, by Country 2020 & 2033
- Table 30: Global Wearable Diabetes Devices Market Volume K Unit Forecast, by Country 2020 & 2033
- Table 31: France Wearable Diabetes Devices Market Revenue (Million) Forecast, by Application 2020 & 2033
- Table 32: France Wearable Diabetes Devices Market Volume (K Unit) Forecast, by Application 2020 & 2033
- Table 33: Germany Wearable Diabetes Devices Market Revenue (Million) Forecast, by Application 2020 & 2033
- Table 34: Germany Wearable Diabetes Devices Market Volume (K Unit) Forecast, by Application 2020 & 2033
- Table 35: Italy Wearable Diabetes Devices Market Revenue (Million) Forecast, by Application 2020 & 2033
- Table 36: Italy Wearable Diabetes Devices Market Volume (K Unit) Forecast, by Application 2020 & 2033
- Table 37: Spain Wearable Diabetes Devices Market Revenue (Million) Forecast, by Application 2020 & 2033
- Table 38: Spain Wearable Diabetes Devices Market Volume (K Unit) Forecast, by Application 2020 & 2033
- Table 39: United Kingdom Wearable Diabetes Devices Market Revenue (Million) Forecast, by Application 2020 & 2033
- Table 40: United Kingdom Wearable Diabetes Devices Market Volume (K Unit) Forecast, by Application 2020 & 2033
- Table 41: Russia Wearable Diabetes Devices Market Revenue (Million) Forecast, by Application 2020 & 2033
- Table 42: Russia Wearable Diabetes Devices Market Volume (K Unit) Forecast, by Application 2020 & 2033
- Table 43: Rest of Europe Wearable Diabetes Devices Market Revenue (Million) Forecast, by Application 2020 & 2033
- Table 44: Rest of Europe Wearable Diabetes Devices Market Volume (K Unit) Forecast, by Application 2020 & 2033
- Table 45: Global Wearable Diabetes Devices Market Revenue Million Forecast, by Device 2020 & 2033
- Table 46: Global Wearable Diabetes Devices Market Volume K Unit Forecast, by Device 2020 & 2033
- Table 47: Global Wearable Diabetes Devices Market Revenue Million Forecast, by Type 2020 & 2033
- Table 48: Global Wearable Diabetes Devices Market Volume K Unit Forecast, by Type 2020 & 2033
- Table 49: Global Wearable Diabetes Devices Market Revenue Million Forecast, by End User 2020 & 2033
- Table 50: Global Wearable Diabetes Devices Market Volume K Unit Forecast, by End User 2020 & 2033
- Table 51: Global Wearable Diabetes Devices Market Revenue Million Forecast, by Country 2020 & 2033
- Table 52: Global Wearable Diabetes Devices Market Volume K Unit Forecast, by Country 2020 & 2033
- Table 53: Mexico Wearable Diabetes Devices Market Revenue (Million) Forecast, by Application 2020 & 2033
- Table 54: Mexico Wearable Diabetes Devices Market Volume (K Unit) Forecast, by Application 2020 & 2033
- Table 55: Brazil Wearable Diabetes Devices Market Revenue (Million) Forecast, by Application 2020 & 2033
- Table 56: Brazil Wearable Diabetes Devices Market Volume (K Unit) Forecast, by Application 2020 & 2033
- Table 57: Rest of Latin America Wearable Diabetes Devices Market Revenue (Million) Forecast, by Application 2020 & 2033
- Table 58: Rest of Latin America Wearable Diabetes Devices Market Volume (K Unit) Forecast, by Application 2020 & 2033
- Table 59: Global Wearable Diabetes Devices Market Revenue Million Forecast, by Device 2020 & 2033
- Table 60: Global Wearable Diabetes Devices Market Volume K Unit Forecast, by Device 2020 & 2033
- Table 61: Global Wearable Diabetes Devices Market Revenue Million Forecast, by Type 2020 & 2033
- Table 62: Global Wearable Diabetes Devices Market Volume K Unit Forecast, by Type 2020 & 2033
- Table 63: Global Wearable Diabetes Devices Market Revenue Million Forecast, by End User 2020 & 2033
- Table 64: Global Wearable Diabetes Devices Market Volume K Unit Forecast, by End User 2020 & 2033
- Table 65: Global Wearable Diabetes Devices Market Revenue Million Forecast, by Country 2020 & 2033
- Table 66: Global Wearable Diabetes Devices Market Volume K Unit Forecast, by Country 2020 & 2033
- Table 67: Japan Wearable Diabetes Devices Market Revenue (Million) Forecast, by Application 2020 & 2033
- Table 68: Japan Wearable Diabetes Devices Market Volume (K Unit) Forecast, by Application 2020 & 2033
- Table 69: South Korea Wearable Diabetes Devices Market Revenue (Million) Forecast, by Application 2020 & 2033
- Table 70: South Korea Wearable Diabetes Devices Market Volume (K Unit) Forecast, by Application 2020 & 2033
- Table 71: China Wearable Diabetes Devices Market Revenue (Million) Forecast, by Application 2020 & 2033
- Table 72: China Wearable Diabetes Devices Market Volume (K Unit) Forecast, by Application 2020 & 2033
- Table 73: India Wearable Diabetes Devices Market Revenue (Million) Forecast, by Application 2020 & 2033
- Table 74: India Wearable Diabetes Devices Market Volume (K Unit) Forecast, by Application 2020 & 2033
- Table 75: Australia Wearable Diabetes Devices Market Revenue (Million) Forecast, by Application 2020 & 2033
- Table 76: Australia Wearable Diabetes Devices Market Volume (K Unit) Forecast, by Application 2020 & 2033
- Table 77: Vietnam Wearable Diabetes Devices Market Revenue (Million) Forecast, by Application 2020 & 2033
- Table 78: Vietnam Wearable Diabetes Devices Market Volume (K Unit) Forecast, by Application 2020 & 2033
- Table 79: Malaysia Wearable Diabetes Devices Market Revenue (Million) Forecast, by Application 2020 & 2033
- Table 80: Malaysia Wearable Diabetes Devices Market Volume (K Unit) Forecast, by Application 2020 & 2033
- Table 81: Indonesia Wearable Diabetes Devices Market Revenue (Million) Forecast, by Application 2020 & 2033
- Table 82: Indonesia Wearable Diabetes Devices Market Volume (K Unit) Forecast, by Application 2020 & 2033
- Table 83: Thailand Wearable Diabetes Devices Market Revenue (Million) Forecast, by Application 2020 & 2033
- Table 84: Thailand Wearable Diabetes Devices Market Volume (K Unit) Forecast, by Application 2020 & 2033
- Table 85: Rest of Asia Pacific Wearable Diabetes Devices Market Revenue (Million) Forecast, by Application 2020 & 2033
- Table 86: Rest of Asia Pacific Wearable Diabetes Devices Market Volume (K Unit) Forecast, by Application 2020 & 2033
- Table 87: Global Wearable Diabetes Devices Market Revenue Million Forecast, by Device 2020 & 2033
- Table 88: Global Wearable Diabetes Devices Market Volume K Unit Forecast, by Device 2020 & 2033
- Table 89: Global Wearable Diabetes Devices Market Revenue Million Forecast, by Type 2020 & 2033
- Table 90: Global Wearable Diabetes Devices Market Volume K Unit Forecast, by Type 2020 & 2033
- Table 91: Global Wearable Diabetes Devices Market Revenue Million Forecast, by End User 2020 & 2033
- Table 92: Global Wearable Diabetes Devices Market Volume K Unit Forecast, by End User 2020 & 2033
- Table 93: Global Wearable Diabetes Devices Market Revenue Million Forecast, by Country 2020 & 2033
- Table 94: Global Wearable Diabetes Devices Market Volume K Unit Forecast, by Country 2020 & 2033
- Table 95: Saudi Arabia Wearable Diabetes Devices Market Revenue (Million) Forecast, by Application 2020 & 2033
- Table 96: Saudi Arabia Wearable Diabetes Devices Market Volume (K Unit) Forecast, by Application 2020 & 2033
- Table 97: Iran Wearable Diabetes Devices Market Revenue (Million) Forecast, by Application 2020 & 2033
- Table 98: Iran Wearable Diabetes Devices Market Volume (K Unit) Forecast, by Application 2020 & 2033
- Table 99: Egypt Wearable Diabetes Devices Market Revenue (Million) Forecast, by Application 2020 & 2033
- Table 100: Egypt Wearable Diabetes Devices Market Volume (K Unit) Forecast, by Application 2020 & 2033
- Table 101: Oman Wearable Diabetes Devices Market Revenue (Million) Forecast, by Application 2020 & 2033
- Table 102: Oman Wearable Diabetes Devices Market Volume (K Unit) Forecast, by Application 2020 & 2033
- Table 103: South Africa Wearable Diabetes Devices Market Revenue (Million) Forecast, by Application 2020 & 2033
- Table 104: South Africa Wearable Diabetes Devices Market Volume (K Unit) Forecast, by Application 2020 & 2033
- Table 105: Rest of Middle East and Africa Wearable Diabetes Devices Market Revenue (Million) Forecast, by Application 2020 & 2033
- Table 106: Rest of Middle East and Africa Wearable Diabetes Devices Market Volume (K Unit) Forecast, by Application 2020 & 2033
Frequently Asked Questions
1. What is the projected Compound Annual Growth Rate (CAGR) of the Wearable Diabetes Devices Market?
The projected CAGR is approximately > 10.00%.
2. Which companies are prominent players in the Wearable Diabetes Devices Market?
Key companies in the market include Eversence, Medtronics, Tandem Diabetes Care, Ascensia, Insulet Corporation, Abbott, Ypsomped, Dexcom.
3. What are the main segments of the Wearable Diabetes Devices Market?
The market segments include Device, Type, End User.
4. Can you provide details about the market size?
The market size is estimated to be USD 11 Million as of 2022.
5. What are some drivers contributing to market growth?
Rapidly Increasing Incidence and Prevalence of Diabetes; Technological Advancements in the Market.
6. What are the notable trends driving market growth?
Rising diabetes prevalence globally is driving the market in forecast years.
7. Are there any restraints impacting market growth?
Monopolized Supply Chain and High Cost of Devices.
8. Can you provide examples of recent developments in the market?
May 2023: The Beta Bionics iLet ACE Pump and the iLet Dosing Decision Software have been granted clearance by the U.S. Food and Drug Administration for individuals aged six and above who have type 1 diabetes. When combined with a compatible FDA-cleared integrated continuous glucose monitor (iCGM), these two devices will create a novel system known as the iLet Bionic Pancreas. This innovative automated insulin dosing (AID) system employs an algorithm to ascertain and direct the administration of insulin.
9. What pricing options are available for accessing the report?
Pricing options include single-user, multi-user, and enterprise licenses priced at USD 4750, USD 5250, and USD 8750 respectively.
10. Is the market size provided in terms of value or volume?
The market size is provided in terms of value, measured in Million and volume, measured in K Unit.
11. Are there any specific market keywords associated with the report?
Yes, the market keyword associated with the report is "Wearable Diabetes Devices Market," which aids in identifying and referencing the specific market segment covered.
12. How do I determine which pricing option suits my needs best?
The pricing options vary based on user requirements and access needs. Individual users may opt for single-user licenses, while businesses requiring broader access may choose multi-user or enterprise licenses for cost-effective access to the report.
13. Are there any additional resources or data provided in the Wearable Diabetes Devices Market report?
While the report offers comprehensive insights, it's advisable to review the specific contents or supplementary materials provided to ascertain if additional resources or data are available.
14. How can I stay updated on further developments or reports in the Wearable Diabetes Devices Market?
To stay informed about further developments, trends, and reports in the Wearable Diabetes Devices Market, consider subscribing to industry newsletters, following relevant companies and organizations, or regularly checking reputable industry news sources and publications.
Methodology
Step 1 - Identification of Relevant Samples Size from Population Database


Step 2 - Approaches for Defining Global Market Size (Value, Volume* & Price*)

Note*: In applicable scenarios
Step 3 - Data Sources
Primary Research
- Web Analytics
- Survey Reports
- Research Institute
- Latest Research Reports
- Opinion Leaders
Secondary Research
- Annual Reports
- White Paper
- Latest Press Release
- Industry Association
- Paid Database
- Investor Presentations

Step 4 - Data Triangulation
Involves using different sources of information in order to increase the validity of a study
These sources are likely to be stakeholders in a program - participants, other researchers, program staff, other community members, and so on.
Then we put all data in single framework & apply various statistical tools to find out the dynamic on the market.
During the analysis stage, feedback from the stakeholder groups would be compared to determine areas of agreement as well as areas of divergence