


Key Insights
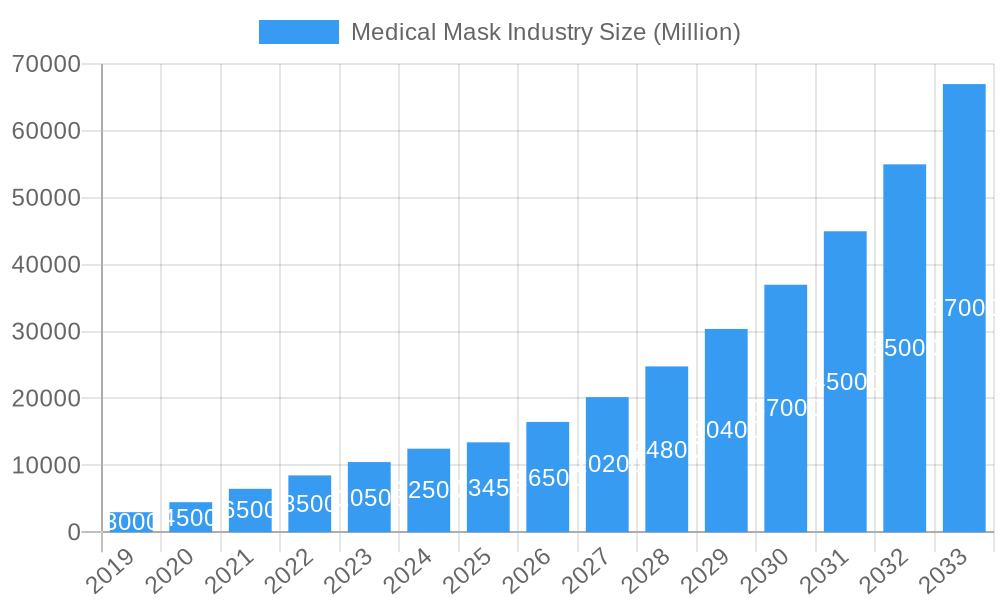
The global medical mask market is projected to reach $3.98 billion by 2025, exhibiting a Compound Annual Growth Rate (CAGR) of 1.55%. This expansion is attributed to heightened hygiene awareness, increased prevalence of respiratory illnesses, and the consistent demand for infection control in healthcare and occupational settings. Non-woven masks are anticipated to lead the product segment due to their affordability and accessibility. The industrial and personnel application segments are expected to drive significant adoption, while e-commerce channels will facilitate broader consumer access.
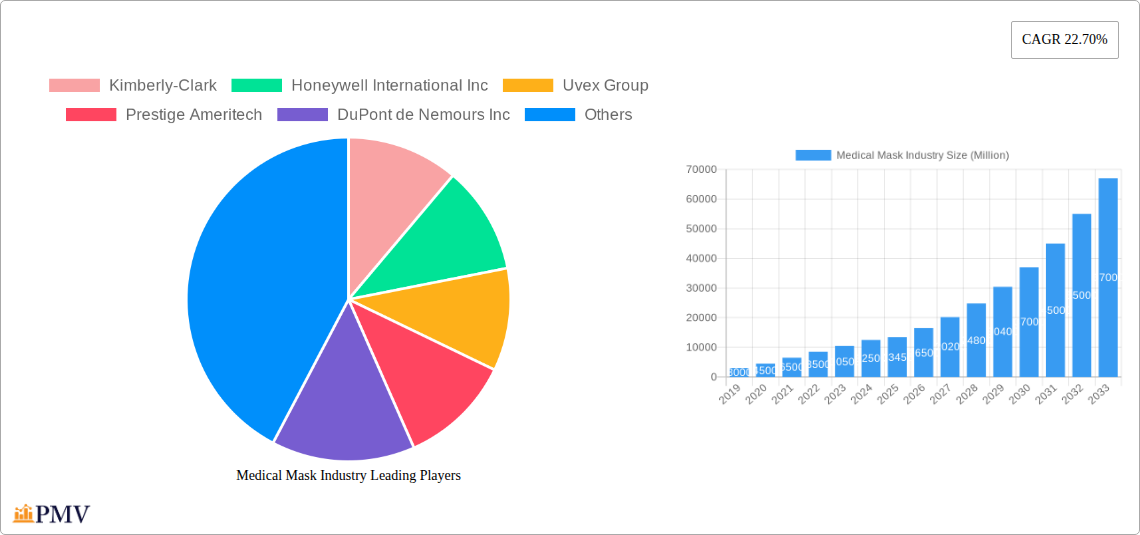
Medical Mask Industry Market Size (In Billion)

The Asia Pacific region is a primary growth driver, fueled by a large population, rising healthcare investments, and an expanding manufacturing sector requiring robust industrial safety. North America and Europe will remain significant markets, supported by advanced healthcare systems and strict regulations. Key market restraints include raw material price volatility and intense competition. However, sustained demand for effective protective equipment and ongoing technological innovation position the medical mask industry for continued growth.
Medical Mask Industry Company Market Share
Medical Mask Industry Market Research Report: Comprehensive Analysis and Future Outlook (2019-2033)
This in-depth market research report provides an exhaustive analysis of the global medical mask industry, offering critical insights into market size, segmentation, trends, and competitive dynamics. Covering the historical period from 2019-2024, the base year of 2025, and a robust forecast period extending to 2033, this report is an indispensable resource for stakeholders seeking to navigate and capitalize on the evolving face mask market. We meticulously examine key segments including Non-woven Masks, Dust Masks, and Protective Masks, across various applications such as Industrial and Personnel use, and distribution channels including Online and Offline. The report includes an estimated market size of XX Million for the base year 2025 and projects significant growth with a projected CAGR of XX% for the forecast period.
Medical Mask Industry Market Structure & Competitive Dynamics
The medical mask market exhibits a moderately concentrated structure, with a few dominant players holding significant market share, estimated at over XX Million in the base year. Innovation plays a pivotal role, fostering competitive advantages through advanced material science and manufacturing processes. Key companies like 3M, Honeywell International Inc, and DuPont de Nemours Inc are at the forefront of R&D, investing heavily in new product development and patented technologies. The protective mask segment, particularly N95 and KF94 variants, is experiencing accelerated innovation due to stringent regulatory approvals and increasing demand for higher filtration efficiency. Regulatory frameworks, such as FDA and CE certifications, significantly influence market entry and product acceptance, creating barriers for new entrants. Product substitutes, while existing, offer varying levels of protection, with advanced medical masks remaining the preferred choice for high-risk environments. End-user trends indicate a growing preference for reusable and sustainable mask options, prompting manufacturers to explore eco-friendly materials. Mergers and acquisition (M&A) activities are present, with estimated deal values in the hundreds of Millions, as larger entities seek to consolidate market presence and expand their product portfolios, particularly within the non-woven masks sector.
- Market Share: Key players hold an estimated combined market share exceeding XX%.
- M&A Deal Values: Historically, M&A activities have ranged from XX Million to XX Million.
- Innovation Ecosystem: Driven by advancements in meltblown technology and antimicrobial coatings.
- Regulatory Impact: Strict adherence to standards like ASTM F2100 is crucial for market access.
Medical Mask Industry Industry Trends & Insights
The medical mask industry is experiencing robust growth, propelled by a confluence of factors including heightened global health awareness, increasing prevalence of respiratory ailments, and stricter occupational safety regulations. The face mask market is projected to expand significantly, with an estimated market size of XX Million in the base year 2025, growing at an anticipated CAGR of XX% throughout the forecast period. Technological disruptions are at the core of this evolution, with ongoing research and development focusing on enhancing filtration efficiency, breathability, and comfort. The integration of advanced materials, such as electrostatic filters and antimicrobial agents, is becoming standard practice, particularly in the protective masks segment. Consumer preferences are shifting towards masks that offer superior protection without compromising on wearability, leading to the development of ergonomic designs and softer inner linings. For instance, the launch of the KF94 Face mask by Maskc in January 2022, featuring a four-layer structure including meltblown materials, exemplifies this trend. Competitive dynamics are intense, with established players continuously innovating to maintain market leadership while new entrants vie for market share, especially in the rapidly expanding online distribution channels. The increasing adoption of dust masks in various industrial settings, driven by stringent air quality standards, further fuels market expansion. Furthermore, the growing emphasis on sustainability is creating a niche for compostable and biodegradable mask options, as seen with Health Canada's approval of Ezzigroup Inc.'s compostable surgical grade face mask in November 2021. The personnel application segment, encompassing both healthcare professionals and the general public, remains a dominant driver of demand. The offline distribution channel continues to be significant, especially for bulk purchases in healthcare institutions and industrial facilities.
- Market Growth Drivers: Rising air pollution levels, increased respiratory disease incidence, and stringent workplace safety mandates are key growth accelerators.
- Technological Disruptions: Development of advanced filtration media, smart mask technologies, and sustainable material alternatives.
- Consumer Preferences: Demand for comfort, breathability, enhanced protection, and eco-friendly options.
- Competitive Dynamics: Intense rivalry among global players, with a focus on product differentiation and cost-effectiveness.
- Market Penetration: Expected to reach XX% by the end of the forecast period.
Dominant Markets & Segments in Medical Mask Industry
The medical mask industry demonstrates regional dominance and segment leadership driven by diverse economic policies, infrastructure development, and public health initiatives. North America and Europe currently lead the market, with the United States and Germany being significant contributors due to advanced healthcare systems and strong industrial sectors. The non-woven masks segment holds the largest market share, estimated at XX Million in the base year 2025, owing to their widespread use in healthcare and industrial settings. The protective masks segment, including N95 and FFP2 respirators, is witnessing substantial growth, particularly in the industrial application, driven by stringent safety regulations and increasing awareness of occupational hazards, with an estimated market value of XX Million.
- Leading Region: North America, driven by high healthcare expenditure and robust industrial manufacturing.
- Leading Country: United States, with a significant market size of XX Million in the base year.
- Dominant Product Segment: Non-woven Masks, expected to reach XX Million by 2025, due to their versatility and cost-effectiveness.
- Key Drivers: Widespread adoption in healthcare, industrial settings, and for general public use.
- Market Size Projection: XX Million for 2025.
- Dominant Application Segment: Industrial applications, projected to account for XX% of the market by 2025, driven by safety compliance needs.
- Key Drivers: Strict occupational health and safety regulations, growth in manufacturing and construction sectors.
- Market Size Projection: XX Million for 2025.
- Dominant Distribution Channel: Offline channels, including medical supply distributors and retail stores, continue to dominate for bulk purchases in institutional settings, estimated at XX Million in 2025.
- Key Drivers: Established supply chains for healthcare and industrial clients, accessibility for large-scale procurement.
- Market Size Projection: XX Million for 2025.
Medical Mask Industry Product Innovations
Product innovations in the medical mask industry are primarily focused on enhancing filtration efficiency, breathability, and user comfort. The development of multi-layer masks, such as Maskc's KF94 face mask, featuring advanced non-woven and meltblown layers, exemplifies this trend, offering superior protection while being gentle on the skin. Companies are also investing in sustainable materials, leading to the introduction of compostable surgical-grade face masks that meet stringent certifications like ASTM F-2100. These innovations aim to address growing environmental concerns and regulatory demands, providing competitive advantages by catering to niche markets and fulfilling specific end-user needs for both industrial and personnel applications.
Report Segmentation & Scope
This comprehensive report segments the medical mask industry by product type, application, and distribution channel. The product segmentation includes Non-woven Masks, Dust Masks, and Protective Masks, each with distinct market sizes and growth projections. The application segmentation covers Industrial and Personnel uses, reflecting the diverse demand landscapes. Distribution channels analyzed include Online and Offline methods, detailing their respective market shares and future potential. Each segment is thoroughly analyzed for its current market size, estimated at XX Million for the base year 2025, and projected growth trajectory throughout the forecast period (2025-2033), offering detailed competitive dynamics and market penetration insights.
- Product Segmentation: Focuses on Non-woven Masks (estimated XX Million in 2025), Dust Masks (estimated XX Million in 2025), and Protective Masks (estimated XX Million in 2025).
- Application Segmentation: Covers Industrial (estimated XX Million in 2025) and Personnel (estimated XX Million in 2025) applications.
- Distribution Channel Segmentation: Analyzes Online (estimated XX Million in 2025) and Offline (estimated XX Million in 2025) channels.
Key Drivers of Medical Mask Industry Growth
The medical mask industry is propelled by several key growth drivers. Increasing global awareness regarding hygiene and infectious disease prevention, especially in the wake of recent pandemics, significantly boosts demand for both protective and general-use masks. Stringent regulations in industrial sectors mandating the use of respiratory protection for worker safety, particularly for dust masks and protective masks, are another major catalyst. Technological advancements in material science, leading to enhanced filtration efficiency, breathability, and comfort, further drive market expansion and product adoption. Economic growth in emerging markets also contributes, as rising disposable incomes allow for greater expenditure on health and safety products.
- Public Health Initiatives: Global campaigns promoting mask-wearing for disease prevention.
- Industrial Safety Standards: Enforcement of regulations for occupational health, increasing demand for dust masks and protective masks.
- Technological Innovations: Development of advanced filtration materials and ergonomic designs.
- Rising Air Pollution: Growing concern over air quality, driving demand for masks in urban areas.
Challenges in the Medical Mask Industry Sector
Despite its growth, the medical mask industry faces several challenges. Volatility in raw material prices, particularly for meltblown fabrics, can impact manufacturing costs and profitability. Intense competition from numerous local and international players can lead to price wars and compressed profit margins. Stringent and evolving regulatory landscapes across different regions require continuous product adaptation and certification, which can be costly and time-consuming. Supply chain disruptions, as witnessed during global health crises, can lead to shortages and price hikes. Counterfeit products also pose a threat, undermining the credibility of genuine manufacturers and potentially compromising user safety.
- Raw Material Price Volatility: Fluctuations in the cost of polypropylene and other essential components.
- Intense Competition: Presence of numerous manufacturers leading to pricing pressures.
- Regulatory Hurdles: Diverse and evolving compliance requirements across global markets.
- Supply Chain Vulnerabilities: Susceptibility to disruptions in global logistics and raw material sourcing.
Leading Players in the Medical Mask Industry Market
- 3M
- Honeywell International Inc
- DuPont de Nemours Inc
- Kimberly-Clark
- Uvex Group
- Prestige Ameritech
- Cambridge Mask Co
- Cardinal Health Inc
- Alpha ProTech
- SAS Safety Corp
- Kowa Company Ltd
- The Gerson Company
- Moldex-Metric Inc
- Ansell Limited
Key Developments in Medical Mask Industry Sector
- January 2022: Maskc launched the KF94 Face mask, featuring a four-layer structure: a non-woven external layer, two non-woven and meltblown central layers, and a soft inner layer gentle on the skin. This innovation enhances both protection and comfort, catering to evolving consumer preferences for effective yet wearable masks.
- November 2021: Health Canada approved Ezzigroup Inc.'s compostable surgical grade face mask, manufactured in Canada. These masks, ASTM F-2100 certified, became available for distribution in Canada and the United States under their EzziMed brand in December 2022, highlighting a significant step towards sustainable solutions in the medical mask sector.
Strategic Medical Mask Industry Market Outlook
The strategic outlook for the medical mask industry is exceptionally positive, driven by sustained demand for respiratory protection and continuous innovation. The market is poised for further growth, fueled by advancements in material science, increasing health consciousness, and evolving regulatory requirements. Opportunities lie in developing niche products for specific industrial applications and expanding into markets with growing healthcare infrastructure. The shift towards sustainable and reusable mask options presents a significant avenue for strategic differentiation and market penetration. Collaborations and partnerships between technology providers and manufacturers will be crucial for capitalizing on emerging trends and ensuring a robust and resilient face mask market in the coming years. The estimated market size of XX Million in 2025 is projected to witness considerable expansion, presenting lucrative investment prospects.
Medical Mask Industry Segmentation
-
1. Product
- 1.1. Non-woven Masks
- 1.2. Dust Masks
- 1.3. Protective Masks
-
2. Application
- 2.1. Industrial
- 2.2. Personnel
-
3. Distribution Channel
- 3.1. Online
- 3.2. Offline
Medical Mask Industry Segmentation By Geography
-
1. North America
- 1.1. United States
- 1.2. Canada
- 1.3. Mexico
-
2. Europe
- 2.1. Germany
- 2.2. United Kingdom
- 2.3. France
- 2.4. Italy
- 2.5. Spain
- 2.6. Rest of Europe
-
3. Asia Pacific
- 3.1. China
- 3.2. Japan
- 3.3. India
- 3.4. Australia
- 3.5. South Korea
- 3.6. Rest of Asia Pacific
- 4. Rest of the World
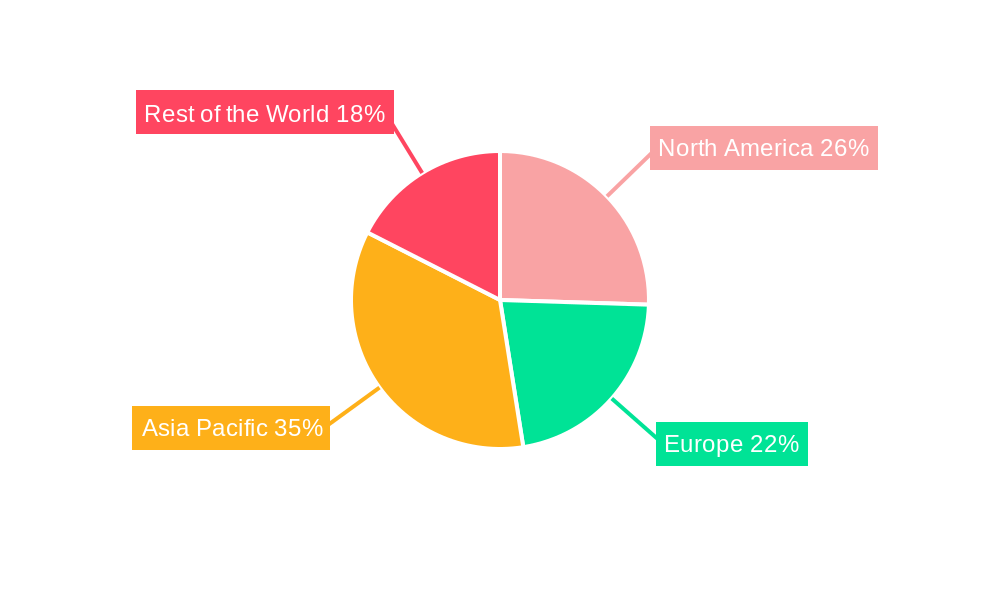
Medical Mask Industry Regional Market Share
Geographic Coverage of Medical Mask Industry
Medical Mask Industry REPORT HIGHLIGHTS
| Aspects | Details |
|---|---|
| Study Period | 2020-2034 |
| Base Year | 2025 |
| Estimated Year | 2026 |
| Forecast Period | 2026-2034 |
| Historical Period | 2020-2025 |
| Growth Rate | CAGR of 1.55% from 2020-2034 |
| Segmentation |
|
Table of Contents
- 1. Introduction
- 1.1. Research Scope
- 1.2. Market Segmentation
- 1.3. Research Methodology
- 1.4. Definitions and Assumptions
- 2. Executive Summary
- 2.1. Introduction
- 3. Market Dynamics
- 3.1. Introduction
- 3.2. Market Drivers
- 3.2.1. Rising Pollution Level and Increasing Adoption by General Population; Rising Awareness About Health Protection and Aseptic Measures
- 3.3. Market Restrains
- 3.3.1. Issues-related to Local Production and Supply Chain
- 3.4. Market Trends
- 3.4.1. The Non-woven Face Mask Segment is Expected to Record Significant Market Share During the Forecast Period
- 4. Market Factor Analysis
- 4.1. Porters Five Forces
- 4.2. Supply/Value Chain
- 4.3. PESTEL analysis
- 4.4. Market Entropy
- 4.5. Patent/Trademark Analysis
- 5. Global Medical Mask Industry Analysis, Insights and Forecast, 2020-2032
- 5.1. Market Analysis, Insights and Forecast - by Product
- 5.1.1. Non-woven Masks
- 5.1.2. Dust Masks
- 5.1.3. Protective Masks
- 5.2. Market Analysis, Insights and Forecast - by Application
- 5.2.1. Industrial
- 5.2.2. Personnel
- 5.3. Market Analysis, Insights and Forecast - by Distribution Channel
- 5.3.1. Online
- 5.3.2. Offline
- 5.4. Market Analysis, Insights and Forecast - by Region
- 5.4.1. North America
- 5.4.2. Europe
- 5.4.3. Asia Pacific
- 5.4.4. Rest of the World
- 5.1. Market Analysis, Insights and Forecast - by Product
- 6. North America Medical Mask Industry Analysis, Insights and Forecast, 2020-2032
- 6.1. Market Analysis, Insights and Forecast - by Product
- 6.1.1. Non-woven Masks
- 6.1.2. Dust Masks
- 6.1.3. Protective Masks
- 6.2. Market Analysis, Insights and Forecast - by Application
- 6.2.1. Industrial
- 6.2.2. Personnel
- 6.3. Market Analysis, Insights and Forecast - by Distribution Channel
- 6.3.1. Online
- 6.3.2. Offline
- 6.1. Market Analysis, Insights and Forecast - by Product
- 7. Europe Medical Mask Industry Analysis, Insights and Forecast, 2020-2032
- 7.1. Market Analysis, Insights and Forecast - by Product
- 7.1.1. Non-woven Masks
- 7.1.2. Dust Masks
- 7.1.3. Protective Masks
- 7.2. Market Analysis, Insights and Forecast - by Application
- 7.2.1. Industrial
- 7.2.2. Personnel
- 7.3. Market Analysis, Insights and Forecast - by Distribution Channel
- 7.3.1. Online
- 7.3.2. Offline
- 7.1. Market Analysis, Insights and Forecast - by Product
- 8. Asia Pacific Medical Mask Industry Analysis, Insights and Forecast, 2020-2032
- 8.1. Market Analysis, Insights and Forecast - by Product
- 8.1.1. Non-woven Masks
- 8.1.2. Dust Masks
- 8.1.3. Protective Masks
- 8.2. Market Analysis, Insights and Forecast - by Application
- 8.2.1. Industrial
- 8.2.2. Personnel
- 8.3. Market Analysis, Insights and Forecast - by Distribution Channel
- 8.3.1. Online
- 8.3.2. Offline
- 8.1. Market Analysis, Insights and Forecast - by Product
- 9. Rest of the World Medical Mask Industry Analysis, Insights and Forecast, 2020-2032
- 9.1. Market Analysis, Insights and Forecast - by Product
- 9.1.1. Non-woven Masks
- 9.1.2. Dust Masks
- 9.1.3. Protective Masks
- 9.2. Market Analysis, Insights and Forecast - by Application
- 9.2.1. Industrial
- 9.2.2. Personnel
- 9.3. Market Analysis, Insights and Forecast - by Distribution Channel
- 9.3.1. Online
- 9.3.2. Offline
- 9.1. Market Analysis, Insights and Forecast - by Product
- 10. Competitive Analysis
- 10.1. Global Market Share Analysis 2025
- 10.2. Company Profiles
- 10.2.1 Kimberly-Clark
- 10.2.1.1. Overview
- 10.2.1.2. Products
- 10.2.1.3. SWOT Analysis
- 10.2.1.4. Recent Developments
- 10.2.1.5. Financials (Based on Availability)
- 10.2.2 Honeywell International Inc
- 10.2.2.1. Overview
- 10.2.2.2. Products
- 10.2.2.3. SWOT Analysis
- 10.2.2.4. Recent Developments
- 10.2.2.5. Financials (Based on Availability)
- 10.2.3 Uvex Group
- 10.2.3.1. Overview
- 10.2.3.2. Products
- 10.2.3.3. SWOT Analysis
- 10.2.3.4. Recent Developments
- 10.2.3.5. Financials (Based on Availability)
- 10.2.4 Prestige Ameritech
- 10.2.4.1. Overview
- 10.2.4.2. Products
- 10.2.4.3. SWOT Analysis
- 10.2.4.4. Recent Developments
- 10.2.4.5. Financials (Based on Availability)
- 10.2.5 DuPont de Nemours Inc
- 10.2.5.1. Overview
- 10.2.5.2. Products
- 10.2.5.3. SWOT Analysis
- 10.2.5.4. Recent Developments
- 10.2.5.5. Financials (Based on Availability)
- 10.2.6 3M
- 10.2.6.1. Overview
- 10.2.6.2. Products
- 10.2.6.3. SWOT Analysis
- 10.2.6.4. Recent Developments
- 10.2.6.5. Financials (Based on Availability)
- 10.2.7 Cambridge Mask Co
- 10.2.7.1. Overview
- 10.2.7.2. Products
- 10.2.7.3. SWOT Analysis
- 10.2.7.4. Recent Developments
- 10.2.7.5. Financials (Based on Availability)
- 10.2.8 Cardinal Health Inc
- 10.2.8.1. Overview
- 10.2.8.2. Products
- 10.2.8.3. SWOT Analysis
- 10.2.8.4. Recent Developments
- 10.2.8.5. Financials (Based on Availability)
- 10.2.9 Alpha ProTech
- 10.2.9.1. Overview
- 10.2.9.2. Products
- 10.2.9.3. SWOT Analysis
- 10.2.9.4. Recent Developments
- 10.2.9.5. Financials (Based on Availability)
- 10.2.10 SAS Safety Corp
- 10.2.10.1. Overview
- 10.2.10.2. Products
- 10.2.10.3. SWOT Analysis
- 10.2.10.4. Recent Developments
- 10.2.10.5. Financials (Based on Availability)
- 10.2.11 Kowa Company Ltd
- 10.2.11.1. Overview
- 10.2.11.2. Products
- 10.2.11.3. SWOT Analysis
- 10.2.11.4. Recent Developments
- 10.2.11.5. Financials (Based on Availability)
- 10.2.12 The Gerson Company
- 10.2.12.1. Overview
- 10.2.12.2. Products
- 10.2.12.3. SWOT Analysis
- 10.2.12.4. Recent Developments
- 10.2.12.5. Financials (Based on Availability)
- 10.2.13 Moldex-Metric Inc
- 10.2.13.1. Overview
- 10.2.13.2. Products
- 10.2.13.3. SWOT Analysis
- 10.2.13.4. Recent Developments
- 10.2.13.5. Financials (Based on Availability)
- 10.2.14 Ansell Limited
- 10.2.14.1. Overview
- 10.2.14.2. Products
- 10.2.14.3. SWOT Analysis
- 10.2.14.4. Recent Developments
- 10.2.14.5. Financials (Based on Availability)
- 10.2.1 Kimberly-Clark
List of Figures
- Figure 1: Global Medical Mask Industry Revenue Breakdown (billion, %) by Region 2025 & 2033
- Figure 2: Global Medical Mask Industry Volume Breakdown (K Unit, %) by Region 2025 & 2033
- Figure 3: North America Medical Mask Industry Revenue (billion), by Product 2025 & 2033
- Figure 4: North America Medical Mask Industry Volume (K Unit), by Product 2025 & 2033
- Figure 5: North America Medical Mask Industry Revenue Share (%), by Product 2025 & 2033
- Figure 6: North America Medical Mask Industry Volume Share (%), by Product 2025 & 2033
- Figure 7: North America Medical Mask Industry Revenue (billion), by Application 2025 & 2033
- Figure 8: North America Medical Mask Industry Volume (K Unit), by Application 2025 & 2033
- Figure 9: North America Medical Mask Industry Revenue Share (%), by Application 2025 & 2033
- Figure 10: North America Medical Mask Industry Volume Share (%), by Application 2025 & 2033
- Figure 11: North America Medical Mask Industry Revenue (billion), by Distribution Channel 2025 & 2033
- Figure 12: North America Medical Mask Industry Volume (K Unit), by Distribution Channel 2025 & 2033
- Figure 13: North America Medical Mask Industry Revenue Share (%), by Distribution Channel 2025 & 2033
- Figure 14: North America Medical Mask Industry Volume Share (%), by Distribution Channel 2025 & 2033
- Figure 15: North America Medical Mask Industry Revenue (billion), by Country 2025 & 2033
- Figure 16: North America Medical Mask Industry Volume (K Unit), by Country 2025 & 2033
- Figure 17: North America Medical Mask Industry Revenue Share (%), by Country 2025 & 2033
- Figure 18: North America Medical Mask Industry Volume Share (%), by Country 2025 & 2033
- Figure 19: Europe Medical Mask Industry Revenue (billion), by Product 2025 & 2033
- Figure 20: Europe Medical Mask Industry Volume (K Unit), by Product 2025 & 2033
- Figure 21: Europe Medical Mask Industry Revenue Share (%), by Product 2025 & 2033
- Figure 22: Europe Medical Mask Industry Volume Share (%), by Product 2025 & 2033
- Figure 23: Europe Medical Mask Industry Revenue (billion), by Application 2025 & 2033
- Figure 24: Europe Medical Mask Industry Volume (K Unit), by Application 2025 & 2033
- Figure 25: Europe Medical Mask Industry Revenue Share (%), by Application 2025 & 2033
- Figure 26: Europe Medical Mask Industry Volume Share (%), by Application 2025 & 2033
- Figure 27: Europe Medical Mask Industry Revenue (billion), by Distribution Channel 2025 & 2033
- Figure 28: Europe Medical Mask Industry Volume (K Unit), by Distribution Channel 2025 & 2033
- Figure 29: Europe Medical Mask Industry Revenue Share (%), by Distribution Channel 2025 & 2033
- Figure 30: Europe Medical Mask Industry Volume Share (%), by Distribution Channel 2025 & 2033
- Figure 31: Europe Medical Mask Industry Revenue (billion), by Country 2025 & 2033
- Figure 32: Europe Medical Mask Industry Volume (K Unit), by Country 2025 & 2033
- Figure 33: Europe Medical Mask Industry Revenue Share (%), by Country 2025 & 2033
- Figure 34: Europe Medical Mask Industry Volume Share (%), by Country 2025 & 2033
- Figure 35: Asia Pacific Medical Mask Industry Revenue (billion), by Product 2025 & 2033
- Figure 36: Asia Pacific Medical Mask Industry Volume (K Unit), by Product 2025 & 2033
- Figure 37: Asia Pacific Medical Mask Industry Revenue Share (%), by Product 2025 & 2033
- Figure 38: Asia Pacific Medical Mask Industry Volume Share (%), by Product 2025 & 2033
- Figure 39: Asia Pacific Medical Mask Industry Revenue (billion), by Application 2025 & 2033
- Figure 40: Asia Pacific Medical Mask Industry Volume (K Unit), by Application 2025 & 2033
- Figure 41: Asia Pacific Medical Mask Industry Revenue Share (%), by Application 2025 & 2033
- Figure 42: Asia Pacific Medical Mask Industry Volume Share (%), by Application 2025 & 2033
- Figure 43: Asia Pacific Medical Mask Industry Revenue (billion), by Distribution Channel 2025 & 2033
- Figure 44: Asia Pacific Medical Mask Industry Volume (K Unit), by Distribution Channel 2025 & 2033
- Figure 45: Asia Pacific Medical Mask Industry Revenue Share (%), by Distribution Channel 2025 & 2033
- Figure 46: Asia Pacific Medical Mask Industry Volume Share (%), by Distribution Channel 2025 & 2033
- Figure 47: Asia Pacific Medical Mask Industry Revenue (billion), by Country 2025 & 2033
- Figure 48: Asia Pacific Medical Mask Industry Volume (K Unit), by Country 2025 & 2033
- Figure 49: Asia Pacific Medical Mask Industry Revenue Share (%), by Country 2025 & 2033
- Figure 50: Asia Pacific Medical Mask Industry Volume Share (%), by Country 2025 & 2033
- Figure 51: Rest of the World Medical Mask Industry Revenue (billion), by Product 2025 & 2033
- Figure 52: Rest of the World Medical Mask Industry Volume (K Unit), by Product 2025 & 2033
- Figure 53: Rest of the World Medical Mask Industry Revenue Share (%), by Product 2025 & 2033
- Figure 54: Rest of the World Medical Mask Industry Volume Share (%), by Product 2025 & 2033
- Figure 55: Rest of the World Medical Mask Industry Revenue (billion), by Application 2025 & 2033
- Figure 56: Rest of the World Medical Mask Industry Volume (K Unit), by Application 2025 & 2033
- Figure 57: Rest of the World Medical Mask Industry Revenue Share (%), by Application 2025 & 2033
- Figure 58: Rest of the World Medical Mask Industry Volume Share (%), by Application 2025 & 2033
- Figure 59: Rest of the World Medical Mask Industry Revenue (billion), by Distribution Channel 2025 & 2033
- Figure 60: Rest of the World Medical Mask Industry Volume (K Unit), by Distribution Channel 2025 & 2033
- Figure 61: Rest of the World Medical Mask Industry Revenue Share (%), by Distribution Channel 2025 & 2033
- Figure 62: Rest of the World Medical Mask Industry Volume Share (%), by Distribution Channel 2025 & 2033
- Figure 63: Rest of the World Medical Mask Industry Revenue (billion), by Country 2025 & 2033
- Figure 64: Rest of the World Medical Mask Industry Volume (K Unit), by Country 2025 & 2033
- Figure 65: Rest of the World Medical Mask Industry Revenue Share (%), by Country 2025 & 2033
- Figure 66: Rest of the World Medical Mask Industry Volume Share (%), by Country 2025 & 2033
List of Tables
- Table 1: Global Medical Mask Industry Revenue billion Forecast, by Product 2020 & 2033
- Table 2: Global Medical Mask Industry Volume K Unit Forecast, by Product 2020 & 2033
- Table 3: Global Medical Mask Industry Revenue billion Forecast, by Application 2020 & 2033
- Table 4: Global Medical Mask Industry Volume K Unit Forecast, by Application 2020 & 2033
- Table 5: Global Medical Mask Industry Revenue billion Forecast, by Distribution Channel 2020 & 2033
- Table 6: Global Medical Mask Industry Volume K Unit Forecast, by Distribution Channel 2020 & 2033
- Table 7: Global Medical Mask Industry Revenue billion Forecast, by Region 2020 & 2033
- Table 8: Global Medical Mask Industry Volume K Unit Forecast, by Region 2020 & 2033
- Table 9: Global Medical Mask Industry Revenue billion Forecast, by Product 2020 & 2033
- Table 10: Global Medical Mask Industry Volume K Unit Forecast, by Product 2020 & 2033
- Table 11: Global Medical Mask Industry Revenue billion Forecast, by Application 2020 & 2033
- Table 12: Global Medical Mask Industry Volume K Unit Forecast, by Application 2020 & 2033
- Table 13: Global Medical Mask Industry Revenue billion Forecast, by Distribution Channel 2020 & 2033
- Table 14: Global Medical Mask Industry Volume K Unit Forecast, by Distribution Channel 2020 & 2033
- Table 15: Global Medical Mask Industry Revenue billion Forecast, by Country 2020 & 2033
- Table 16: Global Medical Mask Industry Volume K Unit Forecast, by Country 2020 & 2033
- Table 17: United States Medical Mask Industry Revenue (billion) Forecast, by Application 2020 & 2033
- Table 18: United States Medical Mask Industry Volume (K Unit) Forecast, by Application 2020 & 2033
- Table 19: Canada Medical Mask Industry Revenue (billion) Forecast, by Application 2020 & 2033
- Table 20: Canada Medical Mask Industry Volume (K Unit) Forecast, by Application 2020 & 2033
- Table 21: Mexico Medical Mask Industry Revenue (billion) Forecast, by Application 2020 & 2033
- Table 22: Mexico Medical Mask Industry Volume (K Unit) Forecast, by Application 2020 & 2033
- Table 23: Global Medical Mask Industry Revenue billion Forecast, by Product 2020 & 2033
- Table 24: Global Medical Mask Industry Volume K Unit Forecast, by Product 2020 & 2033
- Table 25: Global Medical Mask Industry Revenue billion Forecast, by Application 2020 & 2033
- Table 26: Global Medical Mask Industry Volume K Unit Forecast, by Application 2020 & 2033
- Table 27: Global Medical Mask Industry Revenue billion Forecast, by Distribution Channel 2020 & 2033
- Table 28: Global Medical Mask Industry Volume K Unit Forecast, by Distribution Channel 2020 & 2033
- Table 29: Global Medical Mask Industry Revenue billion Forecast, by Country 2020 & 2033
- Table 30: Global Medical Mask Industry Volume K Unit Forecast, by Country 2020 & 2033
- Table 31: Germany Medical Mask Industry Revenue (billion) Forecast, by Application 2020 & 2033
- Table 32: Germany Medical Mask Industry Volume (K Unit) Forecast, by Application 2020 & 2033
- Table 33: United Kingdom Medical Mask Industry Revenue (billion) Forecast, by Application 2020 & 2033
- Table 34: United Kingdom Medical Mask Industry Volume (K Unit) Forecast, by Application 2020 & 2033
- Table 35: France Medical Mask Industry Revenue (billion) Forecast, by Application 2020 & 2033
- Table 36: France Medical Mask Industry Volume (K Unit) Forecast, by Application 2020 & 2033
- Table 37: Italy Medical Mask Industry Revenue (billion) Forecast, by Application 2020 & 2033
- Table 38: Italy Medical Mask Industry Volume (K Unit) Forecast, by Application 2020 & 2033
- Table 39: Spain Medical Mask Industry Revenue (billion) Forecast, by Application 2020 & 2033
- Table 40: Spain Medical Mask Industry Volume (K Unit) Forecast, by Application 2020 & 2033
- Table 41: Rest of Europe Medical Mask Industry Revenue (billion) Forecast, by Application 2020 & 2033
- Table 42: Rest of Europe Medical Mask Industry Volume (K Unit) Forecast, by Application 2020 & 2033
- Table 43: Global Medical Mask Industry Revenue billion Forecast, by Product 2020 & 2033
- Table 44: Global Medical Mask Industry Volume K Unit Forecast, by Product 2020 & 2033
- Table 45: Global Medical Mask Industry Revenue billion Forecast, by Application 2020 & 2033
- Table 46: Global Medical Mask Industry Volume K Unit Forecast, by Application 2020 & 2033
- Table 47: Global Medical Mask Industry Revenue billion Forecast, by Distribution Channel 2020 & 2033
- Table 48: Global Medical Mask Industry Volume K Unit Forecast, by Distribution Channel 2020 & 2033
- Table 49: Global Medical Mask Industry Revenue billion Forecast, by Country 2020 & 2033
- Table 50: Global Medical Mask Industry Volume K Unit Forecast, by Country 2020 & 2033
- Table 51: China Medical Mask Industry Revenue (billion) Forecast, by Application 2020 & 2033
- Table 52: China Medical Mask Industry Volume (K Unit) Forecast, by Application 2020 & 2033
- Table 53: Japan Medical Mask Industry Revenue (billion) Forecast, by Application 2020 & 2033
- Table 54: Japan Medical Mask Industry Volume (K Unit) Forecast, by Application 2020 & 2033
- Table 55: India Medical Mask Industry Revenue (billion) Forecast, by Application 2020 & 2033
- Table 56: India Medical Mask Industry Volume (K Unit) Forecast, by Application 2020 & 2033
- Table 57: Australia Medical Mask Industry Revenue (billion) Forecast, by Application 2020 & 2033
- Table 58: Australia Medical Mask Industry Volume (K Unit) Forecast, by Application 2020 & 2033
- Table 59: South Korea Medical Mask Industry Revenue (billion) Forecast, by Application 2020 & 2033
- Table 60: South Korea Medical Mask Industry Volume (K Unit) Forecast, by Application 2020 & 2033
- Table 61: Rest of Asia Pacific Medical Mask Industry Revenue (billion) Forecast, by Application 2020 & 2033
- Table 62: Rest of Asia Pacific Medical Mask Industry Volume (K Unit) Forecast, by Application 2020 & 2033
- Table 63: Global Medical Mask Industry Revenue billion Forecast, by Product 2020 & 2033
- Table 64: Global Medical Mask Industry Volume K Unit Forecast, by Product 2020 & 2033
- Table 65: Global Medical Mask Industry Revenue billion Forecast, by Application 2020 & 2033
- Table 66: Global Medical Mask Industry Volume K Unit Forecast, by Application 2020 & 2033
- Table 67: Global Medical Mask Industry Revenue billion Forecast, by Distribution Channel 2020 & 2033
- Table 68: Global Medical Mask Industry Volume K Unit Forecast, by Distribution Channel 2020 & 2033
- Table 69: Global Medical Mask Industry Revenue billion Forecast, by Country 2020 & 2033
- Table 70: Global Medical Mask Industry Volume K Unit Forecast, by Country 2020 & 2033
Frequently Asked Questions
1. What is the projected Compound Annual Growth Rate (CAGR) of the Medical Mask Industry?
The projected CAGR is approximately 1.55%.
2. Which companies are prominent players in the Medical Mask Industry?
Key companies in the market include Kimberly-Clark, Honeywell International Inc, Uvex Group, Prestige Ameritech, DuPont de Nemours Inc, 3M, Cambridge Mask Co, Cardinal Health Inc, Alpha ProTech, SAS Safety Corp, Kowa Company Ltd, The Gerson Company, Moldex-Metric Inc, Ansell Limited.
3. What are the main segments of the Medical Mask Industry?
The market segments include Product, Application, Distribution Channel.
4. Can you provide details about the market size?
The market size is estimated to be USD 3.98 billion as of 2022.
5. What are some drivers contributing to market growth?
Rising Pollution Level and Increasing Adoption by General Population; Rising Awareness About Health Protection and Aseptic Measures.
6. What are the notable trends driving market growth?
The Non-woven Face Mask Segment is Expected to Record Significant Market Share During the Forecast Period.
7. Are there any restraints impacting market growth?
Issues-related to Local Production and Supply Chain.
8. Can you provide examples of recent developments in the market?
In January 2022, Maskc launched the KF94 Face mask, consisting of four layers, i.e., a non-woven external layer, two non-woven and meltblown central layers, and a soft inner layer that is gentle on the skin.
9. What pricing options are available for accessing the report?
Pricing options include single-user, multi-user, and enterprise licenses priced at USD 4750, USD 5250, and USD 8750 respectively.
10. Is the market size provided in terms of value or volume?
The market size is provided in terms of value, measured in billion and volume, measured in K Unit.
11. Are there any specific market keywords associated with the report?
Yes, the market keyword associated with the report is "Medical Mask Industry," which aids in identifying and referencing the specific market segment covered.
12. How do I determine which pricing option suits my needs best?
The pricing options vary based on user requirements and access needs. Individual users may opt for single-user licenses, while businesses requiring broader access may choose multi-user or enterprise licenses for cost-effective access to the report.
13. Are there any additional resources or data provided in the Medical Mask Industry report?
While the report offers comprehensive insights, it's advisable to review the specific contents or supplementary materials provided to ascertain if additional resources or data are available.
14. How can I stay updated on further developments or reports in the Medical Mask Industry?
To stay informed about further developments, trends, and reports in the Medical Mask Industry, consider subscribing to industry newsletters, following relevant companies and organizations, or regularly checking reputable industry news sources and publications.
Methodology
Step 1 - Identification of Relevant Samples Size from Population Database


Step 2 - Approaches for Defining Global Market Size (Value, Volume* & Price*)

Note*: In applicable scenarios
Step 3 - Data Sources
Primary Research
- Web Analytics
- Survey Reports
- Research Institute
- Latest Research Reports
- Opinion Leaders
Secondary Research
- Annual Reports
- White Paper
- Latest Press Release
- Industry Association
- Paid Database
- Investor Presentations

Step 4 - Data Triangulation
Involves using different sources of information in order to increase the validity of a study
These sources are likely to be stakeholders in a program - participants, other researchers, program staff, other community members, and so on.
Then we put all data in single framework & apply various statistical tools to find out the dynamic on the market.
During the analysis stage, feedback from the stakeholder groups would be compared to determine areas of agreement as well as areas of divergence