
Key Insights
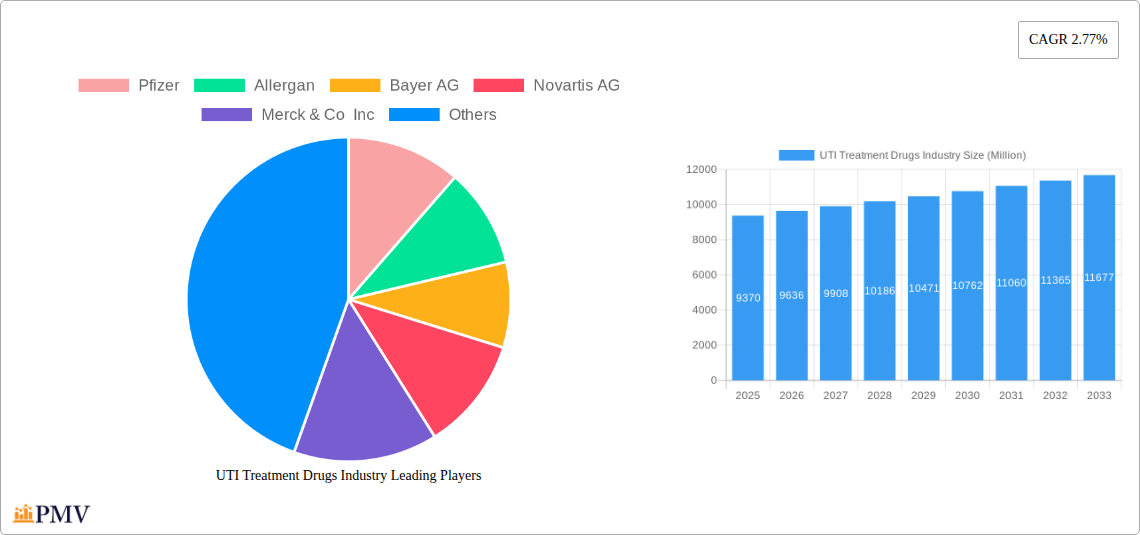
The UTI Treatment Drugs market, valued at $9.37 billion in 2025, is projected to experience steady growth with a Compound Annual Growth Rate (CAGR) of 2.77% from 2025 to 2033. This growth is driven by several factors. Rising prevalence of urinary tract infections (UTIs), particularly among the aging population and individuals with weakened immune systems, fuels demand for effective treatment options. Increased awareness of UTI symptoms and improved diagnostic capabilities contribute to earlier diagnosis and treatment, further boosting market expansion. The market is segmented by indication (complicated UTIs, uncomplicated UTIs, and other indications like recurrent infections and neurogenic bladder infections) and drug class (penicillins, quinolones, cephalosporins, azoles, nitrofurans, and others). The diverse range of drug classes reflects the ongoing need for effective treatment against various bacterial strains and patient-specific needs. Geographic segmentation reveals a strong market presence across North America and Europe, driven by higher healthcare spending and advanced healthcare infrastructure. However, growth opportunities exist in Asia Pacific and other developing regions due to increasing healthcare awareness and improving access to medical facilities. Challenges such as antibiotic resistance and the emergence of multi-drug-resistant strains pose a significant restraint to market growth, prompting a need for innovative treatment strategies and drug development.
Competition in the UTI Treatment Drugs market is intense, with major pharmaceutical companies like Pfizer, Allergan, Bayer AG, Novartis AG, Merck & Co Inc, and others vying for market share. Generic drug availability impacts pricing and profitability, while the constant need for research and development to overcome antibiotic resistance necessitates significant investment from market players. Future market trends suggest an increasing focus on personalized medicine, the development of novel drug delivery systems, and the exploration of alternative therapies to combat antibiotic resistance. Strategic partnerships and collaborations among pharmaceutical companies and research institutions are likely to play a crucial role in advancing the field and shaping the future trajectory of the UTI treatment drugs market. The market's consistent growth, despite challenges, reflects the enduring need for effective UTI treatment solutions and the potential for innovative therapies to address unmet medical needs.
UTI Treatment Drugs Industry: A Comprehensive Market Report (2019-2033)
This comprehensive report provides a detailed analysis of the UTI Treatment Drugs industry, offering invaluable insights for stakeholders seeking to understand market dynamics, competitive landscapes, and future growth prospects. The study covers the period from 2019 to 2033, with 2025 serving as the base and estimated year. The report leverages extensive primary and secondary research to deliver actionable intelligence, focusing on key segments, leading players, and emerging trends within this vital pharmaceutical sector. The global market size in 2025 is estimated at $XX Million, poised for significant growth throughout the forecast period (2025-2033).
UTI Treatment Drugs Industry Market Structure & Competitive Dynamics
The UTI Treatment Drugs market is characterized by a moderately concentrated structure, with several multinational pharmaceutical giants holding significant market share. Key players such as Pfizer, Allergan, Bayer AG, Novartis AG, Merck & Co Inc, and others, compete intensely, driving innovation and influencing pricing strategies. Market concentration is estimated at xx%, reflecting the dominance of a few major players. The industry exhibits a dynamic innovation ecosystem, with ongoing research and development efforts focused on developing novel antibiotics and improved formulations to combat antibiotic resistance. Regulatory frameworks, including stringent approval processes and post-market surveillance, significantly shape market entry and product lifecycle management. The availability of substitute treatments, such as herbal remedies and traditional medicine, exerts some competitive pressure. However, the efficacy and safety profiles of prescription UTI treatment drugs continue to maintain their dominance. M&A activities have played a crucial role in shaping the competitive landscape, with several high-value deals in recent years. For example, a recent acquisition of xx company by xx company valued at $xx Million signifies significant consolidation within the industry. End-user trends, particularly increasing awareness of UTI symptoms and the rise in antibiotic resistance, are driving demand for advanced and effective treatment options.
UTI Treatment Drugs Industry Industry Trends & Insights
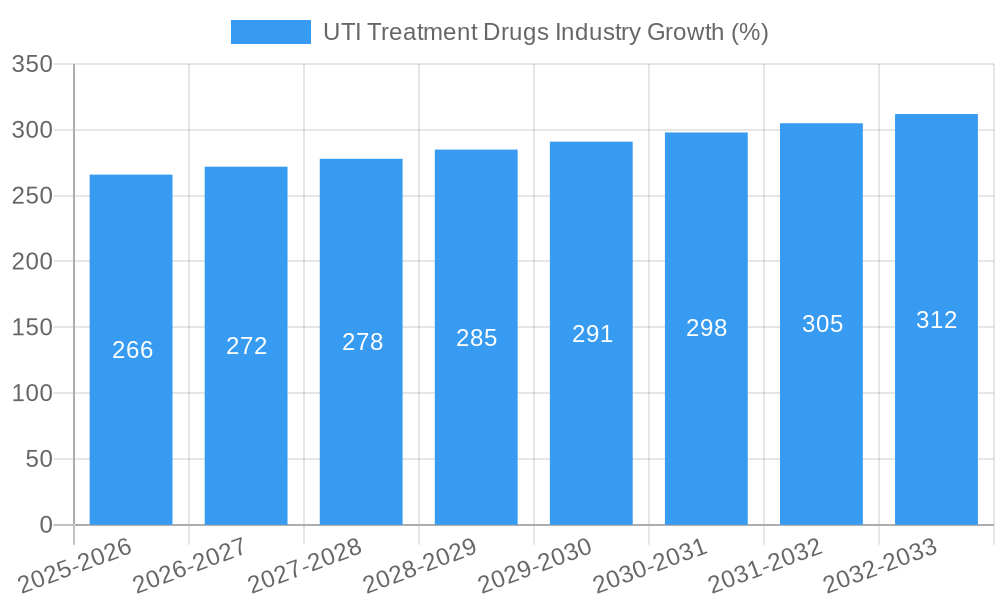
The UTI Treatment Drugs market is projected to experience substantial growth throughout the forecast period, driven by several key factors. Rising prevalence of UTIs, particularly among women, coupled with an aging global population, contributes significantly to increased demand. The market is experiencing a CAGR of xx% during the forecast period (2025-2033). This growth is also fueled by improvements in diagnostic techniques, leading to earlier and more accurate diagnosis and prompt treatment. Technological disruptions, such as the development of rapid diagnostic tests and personalized medicine approaches, are expected to further enhance market growth. Consumer preferences increasingly favor convenient, effective, and minimally invasive treatment options. This is reflected in the rising demand for oral formulations and the ongoing research into targeted therapies. However, the persistent issue of antibiotic resistance poses a significant challenge, necessitating the development of novel therapeutic approaches and strategies for antimicrobial stewardship. Market penetration of new drugs with improved efficacy and safety profiles is driving competition and enhancing patient outcomes.
Dominant Markets & Segments in UTI Treatment Drugs Industry
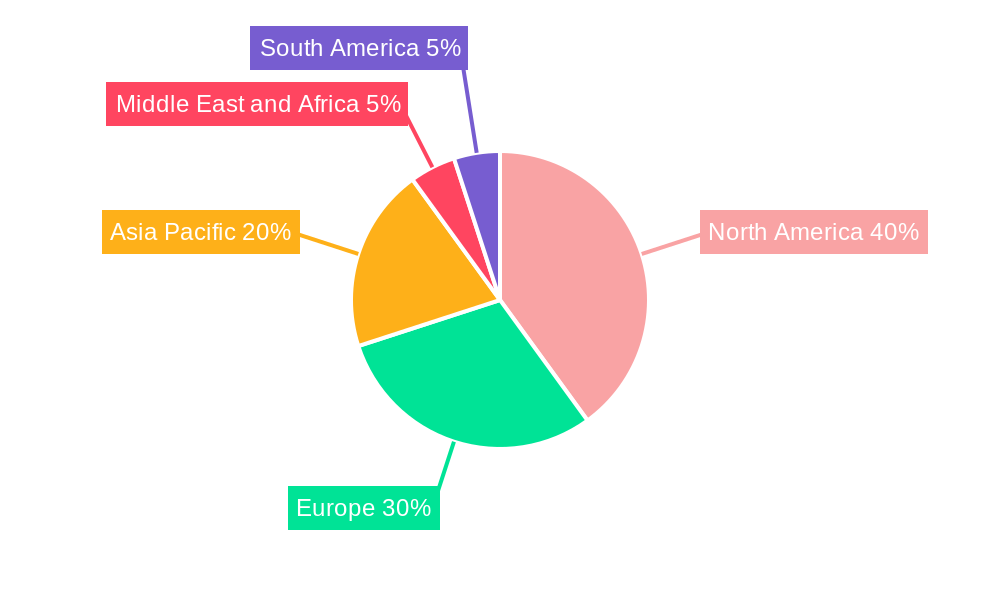
The North American region currently dominates the UTI Treatment Drugs market, driven by high healthcare expenditure, robust healthcare infrastructure, and a substantial patient population. Within this region, the United States holds the largest market share. However, emerging economies in Asia-Pacific are projected to exhibit substantial growth owing to increasing healthcare awareness, rising disposable incomes, and expanding healthcare infrastructure.
- Dominant Indication: Uncomplicated UTI accounts for the largest market share, reflecting its higher prevalence compared to complicated UTIs.
- Dominant Drug Class: Quinolones and Cephalosporins currently represent the most widely prescribed drug classes due to their broad-spectrum efficacy and relatively favorable safety profiles.
Key Drivers for Dominant Regions:
- North America: High healthcare spending, well-established healthcare infrastructure, and advanced diagnostic capabilities.
- Europe: Growing prevalence of UTIs among the aging population, coupled with increased awareness and healthcare access.
- Asia-Pacific: Rapidly growing population, increasing healthcare expenditure, and improving healthcare infrastructure.
UTI Treatment Drugs Industry Product Innovations
The UTI Treatment Drugs market witnesses continuous product innovation, primarily focused on addressing the challenge of antibiotic resistance. Recent developments include the introduction of novel antibiotic classes, formulations with improved bioavailability and reduced side effects, and diagnostic tools enabling faster and more accurate diagnosis. These innovations cater to the growing demand for safer, more effective, and patient-friendly treatment options. Companies are investing heavily in research and development to create effective alternative therapies, considering increasing resistance to currently used antibiotics. The focus is also on developing personalized therapies to improve treatment outcomes.
Report Segmentation & Scope
This report segments the UTI Treatment Drugs market based on indication (uncomplicated UTI, complicated UTI, other indications), and drug class (Penicillin and Combinations, Quinolones, Cephalosporins, Azoles and Amphotericin B, Nitrofurans, Other Drugs). Each segment's growth projections, market size, and competitive landscape are thoroughly analyzed. For example, the uncomplicated UTI segment is expected to maintain its dominance due to its high prevalence, while the complicated UTI segment is projected to exhibit strong growth driven by the rising incidence of drug-resistant infections. Similarly, within drug classes, Quinolones and Cephalosporins show robust market growth, while newer drug classes are gaining traction due to their improved efficacy and reduced side effects. The overall market is segmented to provide a detailed overview.
Key Drivers of UTI Treatment Drugs Industry Growth
The UTI Treatment Drugs market is fueled by several key growth drivers. The rising prevalence of UTIs globally, especially in women, is a primary driver. Technological advancements in diagnostics and treatment options, including the development of rapid diagnostic tests and targeted therapies, also contribute significantly. Economic factors, such as increasing healthcare expenditure and rising disposable incomes in developing economies, also play a role. Finally, supportive regulatory frameworks and public health initiatives aimed at promoting awareness and improving access to treatment further stimulate market growth.
Challenges in the UTI Treatment Drugs Industry Sector
The UTI Treatment Drugs industry faces several significant challenges, including the rising prevalence of antibiotic resistance. This necessitates the development of novel therapeutic approaches and strategies for antimicrobial stewardship, adding complexity and cost to research and development. Supply chain disruptions and fluctuations in raw material prices can also impact production and pricing. Furthermore, stringent regulatory hurdles and increasing competition, particularly from generic drug manufacturers, pose considerable challenges for companies operating in this sector. The growing concerns around antibiotic resistance are expected to exert significant pressure on the industry over the next decade.
Leading Players in the UTI Treatment Drugs Industry Market
- Pfizer
- Allergan
- Bayer AG
- Novartis AG
- Merck & Co Inc
- Cipla Inc
- Shionogi & Co Ltd
- AstraZeneca
- Almirall SA
- Dr Reddy's Laboratories Ltd
- Bristol-Myers Squibb Company
- GlaxoSmithKline PLC
Key Developments in UTI Treatment Drugs Industry Sector
- 2022 Q3: Launch of a new formulation of a Cephalosporin antibiotic by Pfizer with improved bioavailability.
- 2023 Q1: Acquisition of a small biotech company specializing in novel antibiotic development by Novartis.
- 2024 Q2: Approval of a new drug for complicated UTIs by the FDA. (Further specific details would be added here in the final report)
Strategic UTI Treatment Drugs Industry Market Outlook
The future of the UTI Treatment Drugs market holds significant promise, driven by continuous innovation in treatment modalities and the rising prevalence of UTIs. Strategic opportunities lie in the development of novel antibiotics, targeted therapies, and improved diagnostic tools. Companies that prioritize research and development, invest in efficient manufacturing processes, and adapt to evolving regulatory landscapes are poised for success. Focusing on personalized medicine approaches and addressing the critical challenge of antibiotic resistance will be pivotal in shaping the future of this market. The overall market shows strong potential for growth, especially in emerging economies.
UTI Treatment Drugs Industry Segmentation
-
1. Drug
- 1.1. Penicillin and Combinations
- 1.2. Quinolones
- 1.3. Cephalosporin
- 1.4. Azoles and Amphotericin B
- 1.5. Nitrofurans
- 1.6. Other Dr
-
2. Indication
- 2.1. Complicated UTI
- 2.2. Uncomplicated UTI
- 2.3. Other In
UTI Treatment Drugs Industry Segmentation By Geography
-
1. North America
- 1.1. US
- 1.2. Canada
- 1.3. Mexico
-
2. Europe
- 2.1. Germany
- 2.2. UK
- 2.3. France
- 2.4. Italy
- 2.5. Spain
- 2.6. Rest of Europe
-
3. Asia Pacific
- 3.1. China
- 3.2. Japan
- 3.3. India
- 3.4. Australia
- 3.5. South Korea
- 3.6. Rest of Asia Pacific
-
4. Middle East and Africa
- 4.1. GCC
- 4.2. South Africa
- 4.3. Rest of Middle East and Africa
-
5. South America
- 5.1. Brazil
- 5.2. Argentina
- 5.3. Rest of South America
UTI Treatment Drugs Industry REPORT HIGHLIGHTS
| Aspects | Details |
|---|---|
| Study Period | 2019-2033 |
| Base Year | 2024 |
| Estimated Year | 2025 |
| Forecast Period | 2025-2033 |
| Historical Period | 2019-2024 |
| Growth Rate | CAGR of 2.77% from 2019-2033 |
| Segmentation |
|
Table of Contents
- 1. Introduction
- 1.1. Research Scope
- 1.2. Market Segmentation
- 1.3. Research Methodology
- 1.4. Definitions and Assumptions
- 2. Executive Summary
- 2.1. Introduction
- 3. Market Dynamics
- 3.1. Introduction
- 3.2. Market Drivers
- 3.2.1. Increasing Prevalence of Diabetes and Kidney Stones; Launch of Combination Drugs
- 3.3. Market Restrains
- 3.3.1. Adverse Effects Associated with the Use of Medication; Lack of Awareness in Developing and Underdeveloped Countries
- 3.4. Market Trends
- 3.4.1. Complicated UTIs Segment Expected to Hold a Major Share in the Urinary Tract Infection Therapeutics Market
- 4. Market Factor Analysis
- 4.1. Porters Five Forces
- 4.2. Supply/Value Chain
- 4.3. PESTEL analysis
- 4.4. Market Entropy
- 4.5. Patent/Trademark Analysis
- 5. Global UTI Treatment Drugs Industry Analysis, Insights and Forecast, 2019-2031
- 5.1. Market Analysis, Insights and Forecast - by Drug
- 5.1.1. Penicillin and Combinations
- 5.1.2. Quinolones
- 5.1.3. Cephalosporin
- 5.1.4. Azoles and Amphotericin B
- 5.1.5. Nitrofurans
- 5.1.6. Other Dr
- 5.2. Market Analysis, Insights and Forecast - by Indication
- 5.2.1. Complicated UTI
- 5.2.2. Uncomplicated UTI
- 5.2.3. Other In
- 5.3. Market Analysis, Insights and Forecast - by Region
- 5.3.1. North America
- 5.3.2. Europe
- 5.3.3. Asia Pacific
- 5.3.4. Middle East and Africa
- 5.3.5. South America
- 5.1. Market Analysis, Insights and Forecast - by Drug
- 6. North America UTI Treatment Drugs Industry Analysis, Insights and Forecast, 2019-2031
- 6.1. Market Analysis, Insights and Forecast - by Drug
- 6.1.1. Penicillin and Combinations
- 6.1.2. Quinolones
- 6.1.3. Cephalosporin
- 6.1.4. Azoles and Amphotericin B
- 6.1.5. Nitrofurans
- 6.1.6. Other Dr
- 6.2. Market Analysis, Insights and Forecast - by Indication
- 6.2.1. Complicated UTI
- 6.2.2. Uncomplicated UTI
- 6.2.3. Other In
- 6.1. Market Analysis, Insights and Forecast - by Drug
- 7. Europe UTI Treatment Drugs Industry Analysis, Insights and Forecast, 2019-2031
- 7.1. Market Analysis, Insights and Forecast - by Drug
- 7.1.1. Penicillin and Combinations
- 7.1.2. Quinolones
- 7.1.3. Cephalosporin
- 7.1.4. Azoles and Amphotericin B
- 7.1.5. Nitrofurans
- 7.1.6. Other Dr
- 7.2. Market Analysis, Insights and Forecast - by Indication
- 7.2.1. Complicated UTI
- 7.2.2. Uncomplicated UTI
- 7.2.3. Other In
- 7.1. Market Analysis, Insights and Forecast - by Drug
- 8. Asia Pacific UTI Treatment Drugs Industry Analysis, Insights and Forecast, 2019-2031
- 8.1. Market Analysis, Insights and Forecast - by Drug
- 8.1.1. Penicillin and Combinations
- 8.1.2. Quinolones
- 8.1.3. Cephalosporin
- 8.1.4. Azoles and Amphotericin B
- 8.1.5. Nitrofurans
- 8.1.6. Other Dr
- 8.2. Market Analysis, Insights and Forecast - by Indication
- 8.2.1. Complicated UTI
- 8.2.2. Uncomplicated UTI
- 8.2.3. Other In
- 8.1. Market Analysis, Insights and Forecast - by Drug
- 9. Middle East and Africa UTI Treatment Drugs Industry Analysis, Insights and Forecast, 2019-2031
- 9.1. Market Analysis, Insights and Forecast - by Drug
- 9.1.1. Penicillin and Combinations
- 9.1.2. Quinolones
- 9.1.3. Cephalosporin
- 9.1.4. Azoles and Amphotericin B
- 9.1.5. Nitrofurans
- 9.1.6. Other Dr
- 9.2. Market Analysis, Insights and Forecast - by Indication
- 9.2.1. Complicated UTI
- 9.2.2. Uncomplicated UTI
- 9.2.3. Other In
- 9.1. Market Analysis, Insights and Forecast - by Drug
- 10. South America UTI Treatment Drugs Industry Analysis, Insights and Forecast, 2019-2031
- 10.1. Market Analysis, Insights and Forecast - by Drug
- 10.1.1. Penicillin and Combinations
- 10.1.2. Quinolones
- 10.1.3. Cephalosporin
- 10.1.4. Azoles and Amphotericin B
- 10.1.5. Nitrofurans
- 10.1.6. Other Dr
- 10.2. Market Analysis, Insights and Forecast - by Indication
- 10.2.1. Complicated UTI
- 10.2.2. Uncomplicated UTI
- 10.2.3. Other In
- 10.1. Market Analysis, Insights and Forecast - by Drug
- 11. North America UTI Treatment Drugs Industry Analysis, Insights and Forecast, 2019-2031
- 11.1. Market Analysis, Insights and Forecast - By Country/Sub-region
- 11.1.1. undefined
- 12. Europe UTI Treatment Drugs Industry Analysis, Insights and Forecast, 2019-2031
- 12.1. Market Analysis, Insights and Forecast - By Country/Sub-region
- 12.1.1. undefined
- 13. Asia Pacifi UTI Treatment Drugs Industry Analysis, Insights and Forecast, 2019-2031
- 13.1. Market Analysis, Insights and Forecast - By Country/Sub-region
- 13.1.1. undefined
- 14. Middle East and Africa UTI Treatment Drugs Industry Analysis, Insights and Forecast, 2019-2031
- 14.1. Market Analysis, Insights and Forecast - By Country/Sub-region
- 14.1.1. undefined
- 15. South America UTI Treatment Drugs Industry Analysis, Insights and Forecast, 2019-2031
- 15.1. Market Analysis, Insights and Forecast - By Country/Sub-region
- 15.1.1. undefined
- 16. Competitive Analysis
- 16.1. Global Market Share Analysis 2024
- 16.2. Company Profiles
- 16.2.1 Pfizer
- 16.2.1.1. Overview
- 16.2.1.2. Products
- 16.2.1.3. SWOT Analysis
- 16.2.1.4. Recent Developments
- 16.2.1.5. Financials (Based on Availability)
- 16.2.2 Allergan
- 16.2.2.1. Overview
- 16.2.2.2. Products
- 16.2.2.3. SWOT Analysis
- 16.2.2.4. Recent Developments
- 16.2.2.5. Financials (Based on Availability)
- 16.2.3 Bayer AG
- 16.2.3.1. Overview
- 16.2.3.2. Products
- 16.2.3.3. SWOT Analysis
- 16.2.3.4. Recent Developments
- 16.2.3.5. Financials (Based on Availability)
- 16.2.4 Novartis AG
- 16.2.4.1. Overview
- 16.2.4.2. Products
- 16.2.4.3. SWOT Analysis
- 16.2.4.4. Recent Developments
- 16.2.4.5. Financials (Based on Availability)
- 16.2.5 Merck & Co Inc
- 16.2.5.1. Overview
- 16.2.5.2. Products
- 16.2.5.3. SWOT Analysis
- 16.2.5.4. Recent Developments
- 16.2.5.5. Financials (Based on Availability)
- 16.2.6 Cipla Inc
- 16.2.6.1. Overview
- 16.2.6.2. Products
- 16.2.6.3. SWOT Analysis
- 16.2.6.4. Recent Developments
- 16.2.6.5. Financials (Based on Availability)
- 16.2.7 Shionogi & Co Ltd
- 16.2.7.1. Overview
- 16.2.7.2. Products
- 16.2.7.3. SWOT Analysis
- 16.2.7.4. Recent Developments
- 16.2.7.5. Financials (Based on Availability)
- 16.2.8 AstraZeneca
- 16.2.8.1. Overview
- 16.2.8.2. Products
- 16.2.8.3. SWOT Analysis
- 16.2.8.4. Recent Developments
- 16.2.8.5. Financials (Based on Availability)
- 16.2.9 Almirall SA
- 16.2.9.1. Overview
- 16.2.9.2. Products
- 16.2.9.3. SWOT Analysis
- 16.2.9.4. Recent Developments
- 16.2.9.5. Financials (Based on Availability)
- 16.2.10 Dr Reddys Laboratories Ltd
- 16.2.10.1. Overview
- 16.2.10.2. Products
- 16.2.10.3. SWOT Analysis
- 16.2.10.4. Recent Developments
- 16.2.10.5. Financials (Based on Availability)
- 16.2.11 Bristol-Myers Squibb Company
- 16.2.11.1. Overview
- 16.2.11.2. Products
- 16.2.11.3. SWOT Analysis
- 16.2.11.4. Recent Developments
- 16.2.11.5. Financials (Based on Availability)
- 16.2.12 GlaxoSmithKline PLC
- 16.2.12.1. Overview
- 16.2.12.2. Products
- 16.2.12.3. SWOT Analysis
- 16.2.12.4. Recent Developments
- 16.2.12.5. Financials (Based on Availability)
- 16.2.1 Pfizer
List of Figures
- Figure 1: Global UTI Treatment Drugs Industry Revenue Breakdown (Million, %) by Region 2024 & 2032
- Figure 2: Global UTI Treatment Drugs Industry Volume Breakdown (K Unit, %) by Region 2024 & 2032
- Figure 3: North America UTI Treatment Drugs Industry Revenue (Million), by Country 2024 & 2032
- Figure 4: North America UTI Treatment Drugs Industry Volume (K Unit), by Country 2024 & 2032
- Figure 5: North America UTI Treatment Drugs Industry Revenue Share (%), by Country 2024 & 2032
- Figure 6: North America UTI Treatment Drugs Industry Volume Share (%), by Country 2024 & 2032
- Figure 7: Europe UTI Treatment Drugs Industry Revenue (Million), by Country 2024 & 2032
- Figure 8: Europe UTI Treatment Drugs Industry Volume (K Unit), by Country 2024 & 2032
- Figure 9: Europe UTI Treatment Drugs Industry Revenue Share (%), by Country 2024 & 2032
- Figure 10: Europe UTI Treatment Drugs Industry Volume Share (%), by Country 2024 & 2032
- Figure 11: Asia Pacifi UTI Treatment Drugs Industry Revenue (Million), by Country 2024 & 2032
- Figure 12: Asia Pacifi UTI Treatment Drugs Industry Volume (K Unit), by Country 2024 & 2032
- Figure 13: Asia Pacifi UTI Treatment Drugs Industry Revenue Share (%), by Country 2024 & 2032
- Figure 14: Asia Pacifi UTI Treatment Drugs Industry Volume Share (%), by Country 2024 & 2032
- Figure 15: Middle East and Africa UTI Treatment Drugs Industry Revenue (Million), by Country 2024 & 2032
- Figure 16: Middle East and Africa UTI Treatment Drugs Industry Volume (K Unit), by Country 2024 & 2032
- Figure 17: Middle East and Africa UTI Treatment Drugs Industry Revenue Share (%), by Country 2024 & 2032
- Figure 18: Middle East and Africa UTI Treatment Drugs Industry Volume Share (%), by Country 2024 & 2032
- Figure 19: South America UTI Treatment Drugs Industry Revenue (Million), by Country 2024 & 2032
- Figure 20: South America UTI Treatment Drugs Industry Volume (K Unit), by Country 2024 & 2032
- Figure 21: South America UTI Treatment Drugs Industry Revenue Share (%), by Country 2024 & 2032
- Figure 22: South America UTI Treatment Drugs Industry Volume Share (%), by Country 2024 & 2032
- Figure 23: North America UTI Treatment Drugs Industry Revenue (Million), by Drug 2024 & 2032
- Figure 24: North America UTI Treatment Drugs Industry Volume (K Unit), by Drug 2024 & 2032
- Figure 25: North America UTI Treatment Drugs Industry Revenue Share (%), by Drug 2024 & 2032
- Figure 26: North America UTI Treatment Drugs Industry Volume Share (%), by Drug 2024 & 2032
- Figure 27: North America UTI Treatment Drugs Industry Revenue (Million), by Indication 2024 & 2032
- Figure 28: North America UTI Treatment Drugs Industry Volume (K Unit), by Indication 2024 & 2032
- Figure 29: North America UTI Treatment Drugs Industry Revenue Share (%), by Indication 2024 & 2032
- Figure 30: North America UTI Treatment Drugs Industry Volume Share (%), by Indication 2024 & 2032
- Figure 31: North America UTI Treatment Drugs Industry Revenue (Million), by Country 2024 & 2032
- Figure 32: North America UTI Treatment Drugs Industry Volume (K Unit), by Country 2024 & 2032
- Figure 33: North America UTI Treatment Drugs Industry Revenue Share (%), by Country 2024 & 2032
- Figure 34: North America UTI Treatment Drugs Industry Volume Share (%), by Country 2024 & 2032
- Figure 35: Europe UTI Treatment Drugs Industry Revenue (Million), by Drug 2024 & 2032
- Figure 36: Europe UTI Treatment Drugs Industry Volume (K Unit), by Drug 2024 & 2032
- Figure 37: Europe UTI Treatment Drugs Industry Revenue Share (%), by Drug 2024 & 2032
- Figure 38: Europe UTI Treatment Drugs Industry Volume Share (%), by Drug 2024 & 2032
- Figure 39: Europe UTI Treatment Drugs Industry Revenue (Million), by Indication 2024 & 2032
- Figure 40: Europe UTI Treatment Drugs Industry Volume (K Unit), by Indication 2024 & 2032
- Figure 41: Europe UTI Treatment Drugs Industry Revenue Share (%), by Indication 2024 & 2032
- Figure 42: Europe UTI Treatment Drugs Industry Volume Share (%), by Indication 2024 & 2032
- Figure 43: Europe UTI Treatment Drugs Industry Revenue (Million), by Country 2024 & 2032
- Figure 44: Europe UTI Treatment Drugs Industry Volume (K Unit), by Country 2024 & 2032
- Figure 45: Europe UTI Treatment Drugs Industry Revenue Share (%), by Country 2024 & 2032
- Figure 46: Europe UTI Treatment Drugs Industry Volume Share (%), by Country 2024 & 2032
- Figure 47: Asia Pacific UTI Treatment Drugs Industry Revenue (Million), by Drug 2024 & 2032
- Figure 48: Asia Pacific UTI Treatment Drugs Industry Volume (K Unit), by Drug 2024 & 2032
- Figure 49: Asia Pacific UTI Treatment Drugs Industry Revenue Share (%), by Drug 2024 & 2032
- Figure 50: Asia Pacific UTI Treatment Drugs Industry Volume Share (%), by Drug 2024 & 2032
- Figure 51: Asia Pacific UTI Treatment Drugs Industry Revenue (Million), by Indication 2024 & 2032
- Figure 52: Asia Pacific UTI Treatment Drugs Industry Volume (K Unit), by Indication 2024 & 2032
- Figure 53: Asia Pacific UTI Treatment Drugs Industry Revenue Share (%), by Indication 2024 & 2032
- Figure 54: Asia Pacific UTI Treatment Drugs Industry Volume Share (%), by Indication 2024 & 2032
- Figure 55: Asia Pacific UTI Treatment Drugs Industry Revenue (Million), by Country 2024 & 2032
- Figure 56: Asia Pacific UTI Treatment Drugs Industry Volume (K Unit), by Country 2024 & 2032
- Figure 57: Asia Pacific UTI Treatment Drugs Industry Revenue Share (%), by Country 2024 & 2032
- Figure 58: Asia Pacific UTI Treatment Drugs Industry Volume Share (%), by Country 2024 & 2032
- Figure 59: Middle East and Africa UTI Treatment Drugs Industry Revenue (Million), by Drug 2024 & 2032
- Figure 60: Middle East and Africa UTI Treatment Drugs Industry Volume (K Unit), by Drug 2024 & 2032
- Figure 61: Middle East and Africa UTI Treatment Drugs Industry Revenue Share (%), by Drug 2024 & 2032
- Figure 62: Middle East and Africa UTI Treatment Drugs Industry Volume Share (%), by Drug 2024 & 2032
- Figure 63: Middle East and Africa UTI Treatment Drugs Industry Revenue (Million), by Indication 2024 & 2032
- Figure 64: Middle East and Africa UTI Treatment Drugs Industry Volume (K Unit), by Indication 2024 & 2032
- Figure 65: Middle East and Africa UTI Treatment Drugs Industry Revenue Share (%), by Indication 2024 & 2032
- Figure 66: Middle East and Africa UTI Treatment Drugs Industry Volume Share (%), by Indication 2024 & 2032
- Figure 67: Middle East and Africa UTI Treatment Drugs Industry Revenue (Million), by Country 2024 & 2032
- Figure 68: Middle East and Africa UTI Treatment Drugs Industry Volume (K Unit), by Country 2024 & 2032
- Figure 69: Middle East and Africa UTI Treatment Drugs Industry Revenue Share (%), by Country 2024 & 2032
- Figure 70: Middle East and Africa UTI Treatment Drugs Industry Volume Share (%), by Country 2024 & 2032
- Figure 71: South America UTI Treatment Drugs Industry Revenue (Million), by Drug 2024 & 2032
- Figure 72: South America UTI Treatment Drugs Industry Volume (K Unit), by Drug 2024 & 2032
- Figure 73: South America UTI Treatment Drugs Industry Revenue Share (%), by Drug 2024 & 2032
- Figure 74: South America UTI Treatment Drugs Industry Volume Share (%), by Drug 2024 & 2032
- Figure 75: South America UTI Treatment Drugs Industry Revenue (Million), by Indication 2024 & 2032
- Figure 76: South America UTI Treatment Drugs Industry Volume (K Unit), by Indication 2024 & 2032
- Figure 77: South America UTI Treatment Drugs Industry Revenue Share (%), by Indication 2024 & 2032
- Figure 78: South America UTI Treatment Drugs Industry Volume Share (%), by Indication 2024 & 2032
- Figure 79: South America UTI Treatment Drugs Industry Revenue (Million), by Country 2024 & 2032
- Figure 80: South America UTI Treatment Drugs Industry Volume (K Unit), by Country 2024 & 2032
- Figure 81: South America UTI Treatment Drugs Industry Revenue Share (%), by Country 2024 & 2032
- Figure 82: South America UTI Treatment Drugs Industry Volume Share (%), by Country 2024 & 2032
List of Tables
- Table 1: Global UTI Treatment Drugs Industry Revenue Million Forecast, by Region 2019 & 2032
- Table 2: Global UTI Treatment Drugs Industry Volume K Unit Forecast, by Region 2019 & 2032
- Table 3: Global UTI Treatment Drugs Industry Revenue Million Forecast, by Drug 2019 & 2032
- Table 4: Global UTI Treatment Drugs Industry Volume K Unit Forecast, by Drug 2019 & 2032
- Table 5: Global UTI Treatment Drugs Industry Revenue Million Forecast, by Indication 2019 & 2032
- Table 6: Global UTI Treatment Drugs Industry Volume K Unit Forecast, by Indication 2019 & 2032
- Table 7: Global UTI Treatment Drugs Industry Revenue Million Forecast, by Region 2019 & 2032
- Table 8: Global UTI Treatment Drugs Industry Volume K Unit Forecast, by Region 2019 & 2032
- Table 9: Global UTI Treatment Drugs Industry Revenue Million Forecast, by Country 2019 & 2032
- Table 10: Global UTI Treatment Drugs Industry Volume K Unit Forecast, by Country 2019 & 2032
- Table 11: Global UTI Treatment Drugs Industry Revenue Million Forecast, by Country 2019 & 2032
- Table 12: Global UTI Treatment Drugs Industry Volume K Unit Forecast, by Country 2019 & 2032
- Table 13: Global UTI Treatment Drugs Industry Revenue Million Forecast, by Country 2019 & 2032
- Table 14: Global UTI Treatment Drugs Industry Volume K Unit Forecast, by Country 2019 & 2032
- Table 15: Global UTI Treatment Drugs Industry Revenue Million Forecast, by Country 2019 & 2032
- Table 16: Global UTI Treatment Drugs Industry Volume K Unit Forecast, by Country 2019 & 2032
- Table 17: Global UTI Treatment Drugs Industry Revenue Million Forecast, by Country 2019 & 2032
- Table 18: Global UTI Treatment Drugs Industry Volume K Unit Forecast, by Country 2019 & 2032
- Table 19: Global UTI Treatment Drugs Industry Revenue Million Forecast, by Drug 2019 & 2032
- Table 20: Global UTI Treatment Drugs Industry Volume K Unit Forecast, by Drug 2019 & 2032
- Table 21: Global UTI Treatment Drugs Industry Revenue Million Forecast, by Indication 2019 & 2032
- Table 22: Global UTI Treatment Drugs Industry Volume K Unit Forecast, by Indication 2019 & 2032
- Table 23: Global UTI Treatment Drugs Industry Revenue Million Forecast, by Country 2019 & 2032
- Table 24: Global UTI Treatment Drugs Industry Volume K Unit Forecast, by Country 2019 & 2032
- Table 25: US UTI Treatment Drugs Industry Revenue (Million) Forecast, by Application 2019 & 2032
- Table 26: US UTI Treatment Drugs Industry Volume (K Unit) Forecast, by Application 2019 & 2032
- Table 27: Canada UTI Treatment Drugs Industry Revenue (Million) Forecast, by Application 2019 & 2032
- Table 28: Canada UTI Treatment Drugs Industry Volume (K Unit) Forecast, by Application 2019 & 2032
- Table 29: Mexico UTI Treatment Drugs Industry Revenue (Million) Forecast, by Application 2019 & 2032
- Table 30: Mexico UTI Treatment Drugs Industry Volume (K Unit) Forecast, by Application 2019 & 2032
- Table 31: Global UTI Treatment Drugs Industry Revenue Million Forecast, by Drug 2019 & 2032
- Table 32: Global UTI Treatment Drugs Industry Volume K Unit Forecast, by Drug 2019 & 2032
- Table 33: Global UTI Treatment Drugs Industry Revenue Million Forecast, by Indication 2019 & 2032
- Table 34: Global UTI Treatment Drugs Industry Volume K Unit Forecast, by Indication 2019 & 2032
- Table 35: Global UTI Treatment Drugs Industry Revenue Million Forecast, by Country 2019 & 2032
- Table 36: Global UTI Treatment Drugs Industry Volume K Unit Forecast, by Country 2019 & 2032
- Table 37: Germany UTI Treatment Drugs Industry Revenue (Million) Forecast, by Application 2019 & 2032
- Table 38: Germany UTI Treatment Drugs Industry Volume (K Unit) Forecast, by Application 2019 & 2032
- Table 39: UK UTI Treatment Drugs Industry Revenue (Million) Forecast, by Application 2019 & 2032
- Table 40: UK UTI Treatment Drugs Industry Volume (K Unit) Forecast, by Application 2019 & 2032
- Table 41: France UTI Treatment Drugs Industry Revenue (Million) Forecast, by Application 2019 & 2032
- Table 42: France UTI Treatment Drugs Industry Volume (K Unit) Forecast, by Application 2019 & 2032
- Table 43: Italy UTI Treatment Drugs Industry Revenue (Million) Forecast, by Application 2019 & 2032
- Table 44: Italy UTI Treatment Drugs Industry Volume (K Unit) Forecast, by Application 2019 & 2032
- Table 45: Spain UTI Treatment Drugs Industry Revenue (Million) Forecast, by Application 2019 & 2032
- Table 46: Spain UTI Treatment Drugs Industry Volume (K Unit) Forecast, by Application 2019 & 2032
- Table 47: Rest of Europe UTI Treatment Drugs Industry Revenue (Million) Forecast, by Application 2019 & 2032
- Table 48: Rest of Europe UTI Treatment Drugs Industry Volume (K Unit) Forecast, by Application 2019 & 2032
- Table 49: Global UTI Treatment Drugs Industry Revenue Million Forecast, by Drug 2019 & 2032
- Table 50: Global UTI Treatment Drugs Industry Volume K Unit Forecast, by Drug 2019 & 2032
- Table 51: Global UTI Treatment Drugs Industry Revenue Million Forecast, by Indication 2019 & 2032
- Table 52: Global UTI Treatment Drugs Industry Volume K Unit Forecast, by Indication 2019 & 2032
- Table 53: Global UTI Treatment Drugs Industry Revenue Million Forecast, by Country 2019 & 2032
- Table 54: Global UTI Treatment Drugs Industry Volume K Unit Forecast, by Country 2019 & 2032
- Table 55: China UTI Treatment Drugs Industry Revenue (Million) Forecast, by Application 2019 & 2032
- Table 56: China UTI Treatment Drugs Industry Volume (K Unit) Forecast, by Application 2019 & 2032
- Table 57: Japan UTI Treatment Drugs Industry Revenue (Million) Forecast, by Application 2019 & 2032
- Table 58: Japan UTI Treatment Drugs Industry Volume (K Unit) Forecast, by Application 2019 & 2032
- Table 59: India UTI Treatment Drugs Industry Revenue (Million) Forecast, by Application 2019 & 2032
- Table 60: India UTI Treatment Drugs Industry Volume (K Unit) Forecast, by Application 2019 & 2032
- Table 61: Australia UTI Treatment Drugs Industry Revenue (Million) Forecast, by Application 2019 & 2032
- Table 62: Australia UTI Treatment Drugs Industry Volume (K Unit) Forecast, by Application 2019 & 2032
- Table 63: South Korea UTI Treatment Drugs Industry Revenue (Million) Forecast, by Application 2019 & 2032
- Table 64: South Korea UTI Treatment Drugs Industry Volume (K Unit) Forecast, by Application 2019 & 2032
- Table 65: Rest of Asia Pacific UTI Treatment Drugs Industry Revenue (Million) Forecast, by Application 2019 & 2032
- Table 66: Rest of Asia Pacific UTI Treatment Drugs Industry Volume (K Unit) Forecast, by Application 2019 & 2032
- Table 67: Global UTI Treatment Drugs Industry Revenue Million Forecast, by Drug 2019 & 2032
- Table 68: Global UTI Treatment Drugs Industry Volume K Unit Forecast, by Drug 2019 & 2032
- Table 69: Global UTI Treatment Drugs Industry Revenue Million Forecast, by Indication 2019 & 2032
- Table 70: Global UTI Treatment Drugs Industry Volume K Unit Forecast, by Indication 2019 & 2032
- Table 71: Global UTI Treatment Drugs Industry Revenue Million Forecast, by Country 2019 & 2032
- Table 72: Global UTI Treatment Drugs Industry Volume K Unit Forecast, by Country 2019 & 2032
- Table 73: GCC UTI Treatment Drugs Industry Revenue (Million) Forecast, by Application 2019 & 2032
- Table 74: GCC UTI Treatment Drugs Industry Volume (K Unit) Forecast, by Application 2019 & 2032
- Table 75: South Africa UTI Treatment Drugs Industry Revenue (Million) Forecast, by Application 2019 & 2032
- Table 76: South Africa UTI Treatment Drugs Industry Volume (K Unit) Forecast, by Application 2019 & 2032
- Table 77: Rest of Middle East and Africa UTI Treatment Drugs Industry Revenue (Million) Forecast, by Application 2019 & 2032
- Table 78: Rest of Middle East and Africa UTI Treatment Drugs Industry Volume (K Unit) Forecast, by Application 2019 & 2032
- Table 79: Global UTI Treatment Drugs Industry Revenue Million Forecast, by Drug 2019 & 2032
- Table 80: Global UTI Treatment Drugs Industry Volume K Unit Forecast, by Drug 2019 & 2032
- Table 81: Global UTI Treatment Drugs Industry Revenue Million Forecast, by Indication 2019 & 2032
- Table 82: Global UTI Treatment Drugs Industry Volume K Unit Forecast, by Indication 2019 & 2032
- Table 83: Global UTI Treatment Drugs Industry Revenue Million Forecast, by Country 2019 & 2032
- Table 84: Global UTI Treatment Drugs Industry Volume K Unit Forecast, by Country 2019 & 2032
- Table 85: Brazil UTI Treatment Drugs Industry Revenue (Million) Forecast, by Application 2019 & 2032
- Table 86: Brazil UTI Treatment Drugs Industry Volume (K Unit) Forecast, by Application 2019 & 2032
- Table 87: Argentina UTI Treatment Drugs Industry Revenue (Million) Forecast, by Application 2019 & 2032
- Table 88: Argentina UTI Treatment Drugs Industry Volume (K Unit) Forecast, by Application 2019 & 2032
- Table 89: Rest of South America UTI Treatment Drugs Industry Revenue (Million) Forecast, by Application 2019 & 2032
- Table 90: Rest of South America UTI Treatment Drugs Industry Volume (K Unit) Forecast, by Application 2019 & 2032
Frequently Asked Questions
1. What is the projected Compound Annual Growth Rate (CAGR) of the UTI Treatment Drugs Industry?
The projected CAGR is approximately 2.77%.
2. Which companies are prominent players in the UTI Treatment Drugs Industry?
Key companies in the market include Pfizer, Allergan, Bayer AG, Novartis AG, Merck & Co Inc, Cipla Inc, Shionogi & Co Ltd, AstraZeneca, Almirall SA, Dr Reddys Laboratories Ltd, Bristol-Myers Squibb Company, GlaxoSmithKline PLC.
3. What are the main segments of the UTI Treatment Drugs Industry?
The market segments include Drug, Indication.
4. Can you provide details about the market size?
The market size is estimated to be USD 9.37 Million as of 2022.
5. What are some drivers contributing to market growth?
Increasing Prevalence of Diabetes and Kidney Stones; Launch of Combination Drugs.
6. What are the notable trends driving market growth?
Complicated UTIs Segment Expected to Hold a Major Share in the Urinary Tract Infection Therapeutics Market.
7. Are there any restraints impacting market growth?
Adverse Effects Associated with the Use of Medication; Lack of Awareness in Developing and Underdeveloped Countries.
8. Can you provide examples of recent developments in the market?
N/A
9. What pricing options are available for accessing the report?
Pricing options include single-user, multi-user, and enterprise licenses priced at USD 4750, USD 5250, and USD 8750 respectively.
10. Is the market size provided in terms of value or volume?
The market size is provided in terms of value, measured in Million and volume, measured in K Unit.
11. Are there any specific market keywords associated with the report?
Yes, the market keyword associated with the report is "UTI Treatment Drugs Industry," which aids in identifying and referencing the specific market segment covered.
12. How do I determine which pricing option suits my needs best?
The pricing options vary based on user requirements and access needs. Individual users may opt for single-user licenses, while businesses requiring broader access may choose multi-user or enterprise licenses for cost-effective access to the report.
13. Are there any additional resources or data provided in the UTI Treatment Drugs Industry report?
While the report offers comprehensive insights, it's advisable to review the specific contents or supplementary materials provided to ascertain if additional resources or data are available.
14. How can I stay updated on further developments or reports in the UTI Treatment Drugs Industry?
To stay informed about further developments, trends, and reports in the UTI Treatment Drugs Industry, consider subscribing to industry newsletters, following relevant companies and organizations, or regularly checking reputable industry news sources and publications.
Methodology
Step 1 - Identification of Relevant Samples Size from Population Database


Step 2 - Approaches for Defining Global Market Size (Value, Volume* & Price*)

Note*: In applicable scenarios
Step 3 - Data Sources
Primary Research
- Web Analytics
- Survey Reports
- Research Institute
- Latest Research Reports
- Opinion Leaders
Secondary Research
- Annual Reports
- White Paper
- Latest Press Release
- Industry Association
- Paid Database
- Investor Presentations

Step 4 - Data Triangulation
Involves using different sources of information in order to increase the validity of a study
These sources are likely to be stakeholders in a program - participants, other researchers, program staff, other community members, and so on.
Then we put all data in single framework & apply various statistical tools to find out the dynamic on the market.
During the analysis stage, feedback from the stakeholder groups would be compared to determine areas of agreement as well as areas of divergence


