
Key Insights
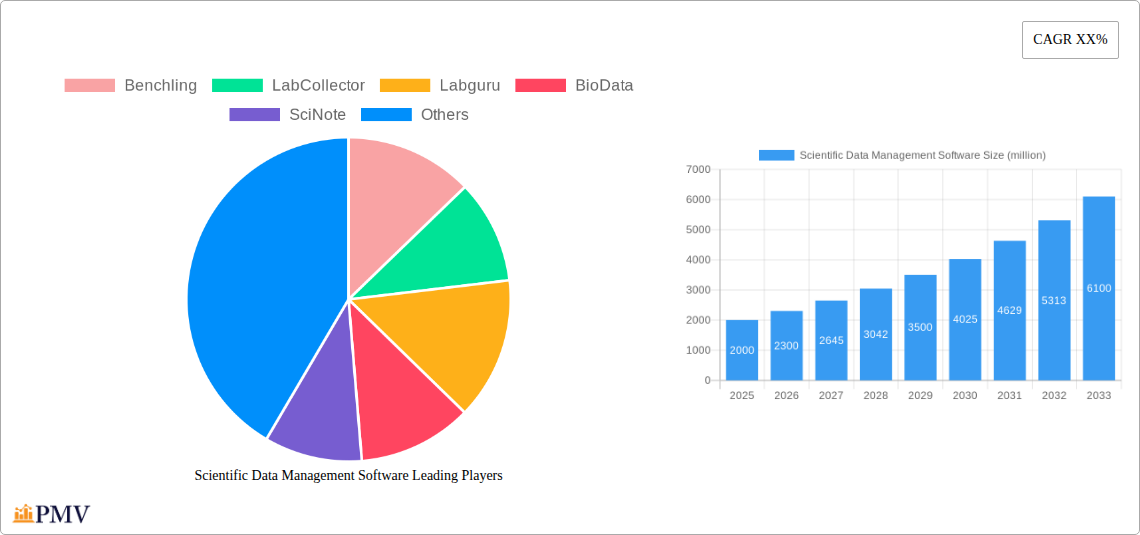
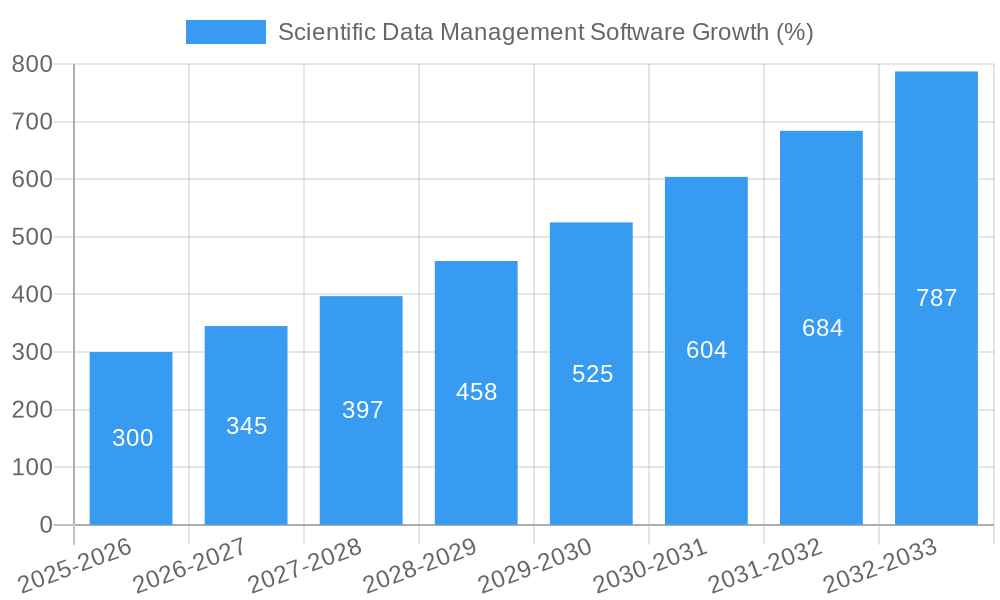
The Scientific Data Management Software market is experiencing robust growth, driven by the increasing volume of scientific data generated across research institutions, pharmaceutical companies, and biotechnology firms. The need for efficient data management, enhanced collaboration, and streamlined regulatory compliance is fueling demand for sophisticated software solutions. This market, estimated at $2 billion in 2025, is projected to experience a Compound Annual Growth Rate (CAGR) of 15% from 2025 to 2033, reaching an estimated $6 billion by 2033. Key drivers include the rising adoption of cloud-based solutions offering scalability and accessibility, the growing emphasis on data security and integrity, and the increasing complexity of scientific experiments generating larger datasets. Furthermore, the integration of artificial intelligence (AI) and machine learning (ML) capabilities within these platforms is enhancing data analysis and accelerating research outcomes. Market segmentation includes solutions tailored for specific scientific disciplines (e.g., genomics, proteomics), deployment models (cloud, on-premise), and organizational sizes (small, medium, large enterprises). While the market faces some restraints, such as the high initial investment cost for some software and the need for comprehensive user training, the overall market trajectory remains strongly positive.
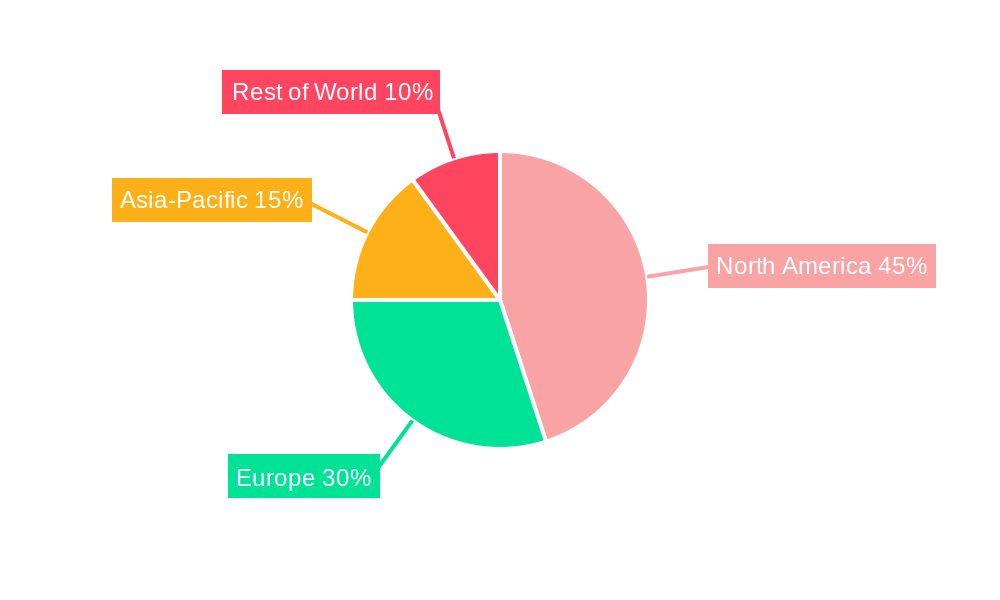
The competitive landscape is marked by a mix of established players like Thermo Fisher Scientific and emerging companies such as Benchling and Labguru. These companies are constantly innovating to offer advanced features like data visualization, automated workflows, and seamless integration with other laboratory instruments and software. The market is witnessing a trend towards open-source platforms and a greater emphasis on interoperability, enabling data sharing and collaboration across different research teams and organizations. Regional growth is expected to be particularly strong in North America and Europe, fueled by robust funding in scientific research and a higher adoption rate of advanced technologies. However, Asia-Pacific is also poised for significant growth, driven by rising investments in research and development across various sectors. The continued focus on improving research efficiency and accelerating drug discovery will further propel the growth of the Scientific Data Management Software market in the coming years.
Scientific Data Management Software Market Report: 2019-2033
This comprehensive report provides a detailed analysis of the Scientific Data Management Software market, projecting a market valuation of $XX million by 2033. The study covers the period 2019-2033, with a base year of 2025 and a forecast period of 2025-2033. It offers actionable insights for stakeholders, including vendors, investors, and researchers, by leveraging detailed market segmentation, competitive landscape analysis, and growth driver identification. This report uses data from the historical period (2019-2024) to forecast future trends.
Scientific Data Management Software Market Structure & Competitive Dynamics
The scientific data management software market exhibits a moderately concentrated structure, with key players holding significant market share. However, the emergence of innovative startups and the increasing adoption of open-source solutions are fostering a dynamic competitive landscape. Regulatory frameworks, particularly concerning data privacy and security (e.g., GDPR, HIPAA), significantly influence market dynamics. Product substitutes, such as spreadsheets and manual data management systems, still exist but are progressively being replaced due to the inefficiencies they pose to large datasets. End-user trends lean toward cloud-based solutions and integrated platforms offering seamless data analysis capabilities. M&A activities have been observed, with deal values exceeding $XX million in recent years, primarily focused on consolidating market share and expanding product portfolios.
- Market Concentration: The top 5 players account for approximately XX% of the market share in 2025.
- M&A Activity: XX major mergers and acquisitions were recorded between 2019 and 2024, with an average deal value of $XX million.
- Innovation Ecosystem: A vibrant ecosystem of startups and established players drive innovation through continuous product enhancements and the integration of new technologies (AI, ML).
Scientific Data Management Software Industry Trends & Insights
The scientific data management software market is experiencing robust growth, driven by several key factors. The increasing volume and complexity of scientific data, coupled with the need for efficient data management and analysis, is a primary driver. The adoption of cloud-based solutions is accelerating, offering scalability, accessibility, and cost-effectiveness. Technological disruptions, such as the integration of artificial intelligence (AI) and machine learning (ML) for data analysis and automation, are reshaping the industry. Consumer preferences shift toward user-friendly interfaces and integrated platforms. The competitive landscape is highly dynamic, with continuous product innovations and strategic partnerships shaping market dynamics. The Compound Annual Growth Rate (CAGR) is projected at XX% during the forecast period (2025-2033), with a market penetration rate of XX% by 2033.
Dominant Markets & Segments in Scientific Data Management Software
The North American region currently dominates the scientific data management software market, driven by high research and development spending, the presence of major pharmaceutical and biotechnology companies, and robust technological infrastructure.
Key Drivers in North America:
- High R&D expenditure by pharmaceutical and biotechnology companies.
- Strong regulatory framework supporting data management best practices.
- Well-established IT infrastructure.
Dominance Analysis: North America's dominance is attributed to a high concentration of leading research institutions, a culture of data-driven decision-making, and significant investments in life sciences. However, the Asia-Pacific region is witnessing the fastest growth rate, fueled by increasing government investments in R&D and the growing adoption of advanced technologies.
Scientific Data Management Software Product Innovations
Recent product innovations focus on enhancing data integration capabilities, improving data visualization tools, and integrating AI/ML for data analysis. Cloud-based solutions are becoming increasingly prevalent, offering scalability and accessibility. The integration of Electronic Lab Notebooks (ELNs) with other laboratory information management systems (LIMS) is another notable trend. This ensures streamlined workflows and enhanced data management efficiency. These advancements contribute to improved research outcomes and accelerated drug discovery processes.
Report Segmentation & Scope
This report segments the scientific data management software market based on deployment mode (cloud-based, on-premise), organizational size (small, medium, large), end-user (pharmaceutical and biotech companies, academic research institutions, government agencies), and geography (North America, Europe, Asia-Pacific, Rest of the World). Each segment is analyzed based on its market size, growth rate, and competitive dynamics. Growth projections are included for each segment, reflecting varying adoption rates and market maturity levels. The competitive dynamics within each segment are also assessed, highlighting leading players and their market strategies.
Key Drivers of Scientific Data Management Software Growth
Several key factors drive market growth. Increasing volumes of scientific data generated necessitate efficient management and analysis tools. The shift towards cloud-based solutions offers scalability and accessibility advantages. The integration of AI and machine learning capabilities enhances data analysis and decision-making. Regulatory compliance requirements (e.g., FDA guidelines) mandate robust data management systems. Finally, the growing adoption of digital transformation strategies across research institutions and companies fuels further market expansion.
Challenges in the Scientific Data Management Software Sector
The scientific data management software sector faces several challenges. Data security and privacy concerns are paramount, necessitating robust security measures. Integration with existing laboratory systems can be complex and expensive. High implementation costs and the need for specialized expertise can hinder adoption, especially among smaller organizations. The sector also faces intense competition among various established players and emerging start-ups. This competition impacts pricing and drives the need for continuous innovation.
Leading Players in the Scientific Data Management Software Market
- Benchling
- LabCollector
- Labguru
- BioData
- SciNote
- OpenLab
- Thermo Fisher Scientific
- MediaLab
- Uncountable
- LabArchives
- MediaLab
- Genemod
- Shimadzu
- SciCord
- Arxspan
- Labstep
- MedGrid
- Rspace
Key Developments in Scientific Data Management Software Sector
- 2022 Q4: Benchling launched a new AI-powered feature for data analysis.
- 2023 Q1: Labguru integrated with a leading LIMS provider.
- 2023 Q2: Thermo Fisher Scientific acquired a smaller data management company for $XX million.
- 2024 Q3: Several companies announced partnerships to improve interoperability between software platforms. (Further specific dates and details would be included in the full report).
Strategic Scientific Data Management Software Market Outlook
The scientific data management software market is poised for significant growth, driven by ongoing technological advancements, increasing data volumes, and the rising adoption of cloud-based solutions. Strategic opportunities lie in developing innovative AI/ML-powered solutions, expanding into emerging markets, and forging strategic partnerships to enhance market penetration. The focus on enhancing user experience, ensuring data security, and integrating with existing laboratory infrastructure will be critical for success in this competitive market. The long-term outlook remains positive, indicating continued growth and market expansion throughout the forecast period.
Scientific Data Management Software Segmentation
-
1. Application
- 1.1. Biological and Life Sciences
- 1.2. Chemistry and Material Science
- 1.3. Environmental Science
- 1.4. Others
-
2. Types
- 2.1. Cloud Based
- 2.2. On Premises
Scientific Data Management Software Segmentation By Geography
-
1. North America
- 1.1. United States
- 1.2. Canada
- 1.3. Mexico
-
2. South America
- 2.1. Brazil
- 2.2. Argentina
- 2.3. Rest of South America
-
3. Europe
- 3.1. United Kingdom
- 3.2. Germany
- 3.3. France
- 3.4. Italy
- 3.5. Spain
- 3.6. Russia
- 3.7. Benelux
- 3.8. Nordics
- 3.9. Rest of Europe
-
4. Middle East & Africa
- 4.1. Turkey
- 4.2. Israel
- 4.3. GCC
- 4.4. North Africa
- 4.5. South Africa
- 4.6. Rest of Middle East & Africa
-
5. Asia Pacific
- 5.1. China
- 5.2. India
- 5.3. Japan
- 5.4. South Korea
- 5.5. ASEAN
- 5.6. Oceania
- 5.7. Rest of Asia Pacific
Scientific Data Management Software REPORT HIGHLIGHTS
| Aspects | Details |
|---|---|
| Study Period | 2019-2033 |
| Base Year | 2024 |
| Estimated Year | 2025 |
| Forecast Period | 2025-2033 |
| Historical Period | 2019-2024 |
| Growth Rate | CAGR of XX% from 2019-2033 |
| Segmentation |
|
Table of Contents
- 1. Introduction
- 1.1. Research Scope
- 1.2. Market Segmentation
- 1.3. Research Methodology
- 1.4. Definitions and Assumptions
- 2. Executive Summary
- 2.1. Introduction
- 3. Market Dynamics
- 3.1. Introduction
- 3.2. Market Drivers
- 3.3. Market Restrains
- 3.4. Market Trends
- 4. Market Factor Analysis
- 4.1. Porters Five Forces
- 4.2. Supply/Value Chain
- 4.3. PESTEL analysis
- 4.4. Market Entropy
- 4.5. Patent/Trademark Analysis
- 5. Global Scientific Data Management Software Analysis, Insights and Forecast, 2019-2031
- 5.1. Market Analysis, Insights and Forecast - by Application
- 5.1.1. Biological and Life Sciences
- 5.1.2. Chemistry and Material Science
- 5.1.3. Environmental Science
- 5.1.4. Others
- 5.2. Market Analysis, Insights and Forecast - by Types
- 5.2.1. Cloud Based
- 5.2.2. On Premises
- 5.3. Market Analysis, Insights and Forecast - by Region
- 5.3.1. North America
- 5.3.2. South America
- 5.3.3. Europe
- 5.3.4. Middle East & Africa
- 5.3.5. Asia Pacific
- 5.1. Market Analysis, Insights and Forecast - by Application
- 6. North America Scientific Data Management Software Analysis, Insights and Forecast, 2019-2031
- 6.1. Market Analysis, Insights and Forecast - by Application
- 6.1.1. Biological and Life Sciences
- 6.1.2. Chemistry and Material Science
- 6.1.3. Environmental Science
- 6.1.4. Others
- 6.2. Market Analysis, Insights and Forecast - by Types
- 6.2.1. Cloud Based
- 6.2.2. On Premises
- 6.1. Market Analysis, Insights and Forecast - by Application
- 7. South America Scientific Data Management Software Analysis, Insights and Forecast, 2019-2031
- 7.1. Market Analysis, Insights and Forecast - by Application
- 7.1.1. Biological and Life Sciences
- 7.1.2. Chemistry and Material Science
- 7.1.3. Environmental Science
- 7.1.4. Others
- 7.2. Market Analysis, Insights and Forecast - by Types
- 7.2.1. Cloud Based
- 7.2.2. On Premises
- 7.1. Market Analysis, Insights and Forecast - by Application
- 8. Europe Scientific Data Management Software Analysis, Insights and Forecast, 2019-2031
- 8.1. Market Analysis, Insights and Forecast - by Application
- 8.1.1. Biological and Life Sciences
- 8.1.2. Chemistry and Material Science
- 8.1.3. Environmental Science
- 8.1.4. Others
- 8.2. Market Analysis, Insights and Forecast - by Types
- 8.2.1. Cloud Based
- 8.2.2. On Premises
- 8.1. Market Analysis, Insights and Forecast - by Application
- 9. Middle East & Africa Scientific Data Management Software Analysis, Insights and Forecast, 2019-2031
- 9.1. Market Analysis, Insights and Forecast - by Application
- 9.1.1. Biological and Life Sciences
- 9.1.2. Chemistry and Material Science
- 9.1.3. Environmental Science
- 9.1.4. Others
- 9.2. Market Analysis, Insights and Forecast - by Types
- 9.2.1. Cloud Based
- 9.2.2. On Premises
- 9.1. Market Analysis, Insights and Forecast - by Application
- 10. Asia Pacific Scientific Data Management Software Analysis, Insights and Forecast, 2019-2031
- 10.1. Market Analysis, Insights and Forecast - by Application
- 10.1.1. Biological and Life Sciences
- 10.1.2. Chemistry and Material Science
- 10.1.3. Environmental Science
- 10.1.4. Others
- 10.2. Market Analysis, Insights and Forecast - by Types
- 10.2.1. Cloud Based
- 10.2.2. On Premises
- 10.1. Market Analysis, Insights and Forecast - by Application
- 11. Competitive Analysis
- 11.1. Global Market Share Analysis 2024
- 11.2. Company Profiles
- 11.2.1 Benchling
- 11.2.1.1. Overview
- 11.2.1.2. Products
- 11.2.1.3. SWOT Analysis
- 11.2.1.4. Recent Developments
- 11.2.1.5. Financials (Based on Availability)
- 11.2.2 LabCollector
- 11.2.2.1. Overview
- 11.2.2.2. Products
- 11.2.2.3. SWOT Analysis
- 11.2.2.4. Recent Developments
- 11.2.2.5. Financials (Based on Availability)
- 11.2.3 Labguru
- 11.2.3.1. Overview
- 11.2.3.2. Products
- 11.2.3.3. SWOT Analysis
- 11.2.3.4. Recent Developments
- 11.2.3.5. Financials (Based on Availability)
- 11.2.4 BioData
- 11.2.4.1. Overview
- 11.2.4.2. Products
- 11.2.4.3. SWOT Analysis
- 11.2.4.4. Recent Developments
- 11.2.4.5. Financials (Based on Availability)
- 11.2.5 SciNote
- 11.2.5.1. Overview
- 11.2.5.2. Products
- 11.2.5.3. SWOT Analysis
- 11.2.5.4. Recent Developments
- 11.2.5.5. Financials (Based on Availability)
- 11.2.6 OpenLab
- 11.2.6.1. Overview
- 11.2.6.2. Products
- 11.2.6.3. SWOT Analysis
- 11.2.6.4. Recent Developments
- 11.2.6.5. Financials (Based on Availability)
- 11.2.7 Thermo Fisher Scientific
- 11.2.7.1. Overview
- 11.2.7.2. Products
- 11.2.7.3. SWOT Analysis
- 11.2.7.4. Recent Developments
- 11.2.7.5. Financials (Based on Availability)
- 11.2.8 MediaLab
- 11.2.8.1. Overview
- 11.2.8.2. Products
- 11.2.8.3. SWOT Analysis
- 11.2.8.4. Recent Developments
- 11.2.8.5. Financials (Based on Availability)
- 11.2.9 Uncountable
- 11.2.9.1. Overview
- 11.2.9.2. Products
- 11.2.9.3. SWOT Analysis
- 11.2.9.4. Recent Developments
- 11.2.9.5. Financials (Based on Availability)
- 11.2.10 LabArchives
- 11.2.10.1. Overview
- 11.2.10.2. Products
- 11.2.10.3. SWOT Analysis
- 11.2.10.4. Recent Developments
- 11.2.10.5. Financials (Based on Availability)
- 11.2.11 MediaLab
- 11.2.11.1. Overview
- 11.2.11.2. Products
- 11.2.11.3. SWOT Analysis
- 11.2.11.4. Recent Developments
- 11.2.11.5. Financials (Based on Availability)
- 11.2.12 Genemod
- 11.2.12.1. Overview
- 11.2.12.2. Products
- 11.2.12.3. SWOT Analysis
- 11.2.12.4. Recent Developments
- 11.2.12.5. Financials (Based on Availability)
- 11.2.13 Shimadzu
- 11.2.13.1. Overview
- 11.2.13.2. Products
- 11.2.13.3. SWOT Analysis
- 11.2.13.4. Recent Developments
- 11.2.13.5. Financials (Based on Availability)
- 11.2.14 SciCord
- 11.2.14.1. Overview
- 11.2.14.2. Products
- 11.2.14.3. SWOT Analysis
- 11.2.14.4. Recent Developments
- 11.2.14.5. Financials (Based on Availability)
- 11.2.15 Arxspan
- 11.2.15.1. Overview
- 11.2.15.2. Products
- 11.2.15.3. SWOT Analysis
- 11.2.15.4. Recent Developments
- 11.2.15.5. Financials (Based on Availability)
- 11.2.16 Labstep
- 11.2.16.1. Overview
- 11.2.16.2. Products
- 11.2.16.3. SWOT Analysis
- 11.2.16.4. Recent Developments
- 11.2.16.5. Financials (Based on Availability)
- 11.2.17 MedGrid
- 11.2.17.1. Overview
- 11.2.17.2. Products
- 11.2.17.3. SWOT Analysis
- 11.2.17.4. Recent Developments
- 11.2.17.5. Financials (Based on Availability)
- 11.2.18 Rspace
- 11.2.18.1. Overview
- 11.2.18.2. Products
- 11.2.18.3. SWOT Analysis
- 11.2.18.4. Recent Developments
- 11.2.18.5. Financials (Based on Availability)
- 11.2.1 Benchling
List of Figures
- Figure 1: Global Scientific Data Management Software Revenue Breakdown (million, %) by Region 2024 & 2032
- Figure 2: North America Scientific Data Management Software Revenue (million), by Application 2024 & 2032
- Figure 3: North America Scientific Data Management Software Revenue Share (%), by Application 2024 & 2032
- Figure 4: North America Scientific Data Management Software Revenue (million), by Types 2024 & 2032
- Figure 5: North America Scientific Data Management Software Revenue Share (%), by Types 2024 & 2032
- Figure 6: North America Scientific Data Management Software Revenue (million), by Country 2024 & 2032
- Figure 7: North America Scientific Data Management Software Revenue Share (%), by Country 2024 & 2032
- Figure 8: South America Scientific Data Management Software Revenue (million), by Application 2024 & 2032
- Figure 9: South America Scientific Data Management Software Revenue Share (%), by Application 2024 & 2032
- Figure 10: South America Scientific Data Management Software Revenue (million), by Types 2024 & 2032
- Figure 11: South America Scientific Data Management Software Revenue Share (%), by Types 2024 & 2032
- Figure 12: South America Scientific Data Management Software Revenue (million), by Country 2024 & 2032
- Figure 13: South America Scientific Data Management Software Revenue Share (%), by Country 2024 & 2032
- Figure 14: Europe Scientific Data Management Software Revenue (million), by Application 2024 & 2032
- Figure 15: Europe Scientific Data Management Software Revenue Share (%), by Application 2024 & 2032
- Figure 16: Europe Scientific Data Management Software Revenue (million), by Types 2024 & 2032
- Figure 17: Europe Scientific Data Management Software Revenue Share (%), by Types 2024 & 2032
- Figure 18: Europe Scientific Data Management Software Revenue (million), by Country 2024 & 2032
- Figure 19: Europe Scientific Data Management Software Revenue Share (%), by Country 2024 & 2032
- Figure 20: Middle East & Africa Scientific Data Management Software Revenue (million), by Application 2024 & 2032
- Figure 21: Middle East & Africa Scientific Data Management Software Revenue Share (%), by Application 2024 & 2032
- Figure 22: Middle East & Africa Scientific Data Management Software Revenue (million), by Types 2024 & 2032
- Figure 23: Middle East & Africa Scientific Data Management Software Revenue Share (%), by Types 2024 & 2032
- Figure 24: Middle East & Africa Scientific Data Management Software Revenue (million), by Country 2024 & 2032
- Figure 25: Middle East & Africa Scientific Data Management Software Revenue Share (%), by Country 2024 & 2032
- Figure 26: Asia Pacific Scientific Data Management Software Revenue (million), by Application 2024 & 2032
- Figure 27: Asia Pacific Scientific Data Management Software Revenue Share (%), by Application 2024 & 2032
- Figure 28: Asia Pacific Scientific Data Management Software Revenue (million), by Types 2024 & 2032
- Figure 29: Asia Pacific Scientific Data Management Software Revenue Share (%), by Types 2024 & 2032
- Figure 30: Asia Pacific Scientific Data Management Software Revenue (million), by Country 2024 & 2032
- Figure 31: Asia Pacific Scientific Data Management Software Revenue Share (%), by Country 2024 & 2032
List of Tables
- Table 1: Global Scientific Data Management Software Revenue million Forecast, by Region 2019 & 2032
- Table 2: Global Scientific Data Management Software Revenue million Forecast, by Application 2019 & 2032
- Table 3: Global Scientific Data Management Software Revenue million Forecast, by Types 2019 & 2032
- Table 4: Global Scientific Data Management Software Revenue million Forecast, by Region 2019 & 2032
- Table 5: Global Scientific Data Management Software Revenue million Forecast, by Application 2019 & 2032
- Table 6: Global Scientific Data Management Software Revenue million Forecast, by Types 2019 & 2032
- Table 7: Global Scientific Data Management Software Revenue million Forecast, by Country 2019 & 2032
- Table 8: United States Scientific Data Management Software Revenue (million) Forecast, by Application 2019 & 2032
- Table 9: Canada Scientific Data Management Software Revenue (million) Forecast, by Application 2019 & 2032
- Table 10: Mexico Scientific Data Management Software Revenue (million) Forecast, by Application 2019 & 2032
- Table 11: Global Scientific Data Management Software Revenue million Forecast, by Application 2019 & 2032
- Table 12: Global Scientific Data Management Software Revenue million Forecast, by Types 2019 & 2032
- Table 13: Global Scientific Data Management Software Revenue million Forecast, by Country 2019 & 2032
- Table 14: Brazil Scientific Data Management Software Revenue (million) Forecast, by Application 2019 & 2032
- Table 15: Argentina Scientific Data Management Software Revenue (million) Forecast, by Application 2019 & 2032
- Table 16: Rest of South America Scientific Data Management Software Revenue (million) Forecast, by Application 2019 & 2032
- Table 17: Global Scientific Data Management Software Revenue million Forecast, by Application 2019 & 2032
- Table 18: Global Scientific Data Management Software Revenue million Forecast, by Types 2019 & 2032
- Table 19: Global Scientific Data Management Software Revenue million Forecast, by Country 2019 & 2032
- Table 20: United Kingdom Scientific Data Management Software Revenue (million) Forecast, by Application 2019 & 2032
- Table 21: Germany Scientific Data Management Software Revenue (million) Forecast, by Application 2019 & 2032
- Table 22: France Scientific Data Management Software Revenue (million) Forecast, by Application 2019 & 2032
- Table 23: Italy Scientific Data Management Software Revenue (million) Forecast, by Application 2019 & 2032
- Table 24: Spain Scientific Data Management Software Revenue (million) Forecast, by Application 2019 & 2032
- Table 25: Russia Scientific Data Management Software Revenue (million) Forecast, by Application 2019 & 2032
- Table 26: Benelux Scientific Data Management Software Revenue (million) Forecast, by Application 2019 & 2032
- Table 27: Nordics Scientific Data Management Software Revenue (million) Forecast, by Application 2019 & 2032
- Table 28: Rest of Europe Scientific Data Management Software Revenue (million) Forecast, by Application 2019 & 2032
- Table 29: Global Scientific Data Management Software Revenue million Forecast, by Application 2019 & 2032
- Table 30: Global Scientific Data Management Software Revenue million Forecast, by Types 2019 & 2032
- Table 31: Global Scientific Data Management Software Revenue million Forecast, by Country 2019 & 2032
- Table 32: Turkey Scientific Data Management Software Revenue (million) Forecast, by Application 2019 & 2032
- Table 33: Israel Scientific Data Management Software Revenue (million) Forecast, by Application 2019 & 2032
- Table 34: GCC Scientific Data Management Software Revenue (million) Forecast, by Application 2019 & 2032
- Table 35: North Africa Scientific Data Management Software Revenue (million) Forecast, by Application 2019 & 2032
- Table 36: South Africa Scientific Data Management Software Revenue (million) Forecast, by Application 2019 & 2032
- Table 37: Rest of Middle East & Africa Scientific Data Management Software Revenue (million) Forecast, by Application 2019 & 2032
- Table 38: Global Scientific Data Management Software Revenue million Forecast, by Application 2019 & 2032
- Table 39: Global Scientific Data Management Software Revenue million Forecast, by Types 2019 & 2032
- Table 40: Global Scientific Data Management Software Revenue million Forecast, by Country 2019 & 2032
- Table 41: China Scientific Data Management Software Revenue (million) Forecast, by Application 2019 & 2032
- Table 42: India Scientific Data Management Software Revenue (million) Forecast, by Application 2019 & 2032
- Table 43: Japan Scientific Data Management Software Revenue (million) Forecast, by Application 2019 & 2032
- Table 44: South Korea Scientific Data Management Software Revenue (million) Forecast, by Application 2019 & 2032
- Table 45: ASEAN Scientific Data Management Software Revenue (million) Forecast, by Application 2019 & 2032
- Table 46: Oceania Scientific Data Management Software Revenue (million) Forecast, by Application 2019 & 2032
- Table 47: Rest of Asia Pacific Scientific Data Management Software Revenue (million) Forecast, by Application 2019 & 2032
Frequently Asked Questions
1. What is the projected Compound Annual Growth Rate (CAGR) of the Scientific Data Management Software?
The projected CAGR is approximately XX%.
2. Which companies are prominent players in the Scientific Data Management Software?
Key companies in the market include Benchling, LabCollector, Labguru, BioData, SciNote, OpenLab, Thermo Fisher Scientific, MediaLab, Uncountable, LabArchives, MediaLab, Genemod, Shimadzu, SciCord, Arxspan, Labstep, MedGrid, Rspace.
3. What are the main segments of the Scientific Data Management Software?
The market segments include Application, Types.
4. Can you provide details about the market size?
The market size is estimated to be USD XXX million as of 2022.
5. What are some drivers contributing to market growth?
N/A
6. What are the notable trends driving market growth?
N/A
7. Are there any restraints impacting market growth?
N/A
8. Can you provide examples of recent developments in the market?
N/A
9. What pricing options are available for accessing the report?
Pricing options include single-user, multi-user, and enterprise licenses priced at USD 4350.00, USD 6525.00, and USD 8700.00 respectively.
10. Is the market size provided in terms of value or volume?
The market size is provided in terms of value, measured in million.
11. Are there any specific market keywords associated with the report?
Yes, the market keyword associated with the report is "Scientific Data Management Software," which aids in identifying and referencing the specific market segment covered.
12. How do I determine which pricing option suits my needs best?
The pricing options vary based on user requirements and access needs. Individual users may opt for single-user licenses, while businesses requiring broader access may choose multi-user or enterprise licenses for cost-effective access to the report.
13. Are there any additional resources or data provided in the Scientific Data Management Software report?
While the report offers comprehensive insights, it's advisable to review the specific contents or supplementary materials provided to ascertain if additional resources or data are available.
14. How can I stay updated on further developments or reports in the Scientific Data Management Software?
To stay informed about further developments, trends, and reports in the Scientific Data Management Software, consider subscribing to industry newsletters, following relevant companies and organizations, or regularly checking reputable industry news sources and publications.
Methodology
Step 1 - Identification of Relevant Samples Size from Population Database


Step 2 - Approaches for Defining Global Market Size (Value, Volume* & Price*)

Note*: In applicable scenarios
Step 3 - Data Sources
Primary Research
- Web Analytics
- Survey Reports
- Research Institute
- Latest Research Reports
- Opinion Leaders
Secondary Research
- Annual Reports
- White Paper
- Latest Press Release
- Industry Association
- Paid Database
- Investor Presentations

Step 4 - Data Triangulation
Involves using different sources of information in order to increase the validity of a study
These sources are likely to be stakeholders in a program - participants, other researchers, program staff, other community members, and so on.
Then we put all data in single framework & apply various statistical tools to find out the dynamic on the market.
During the analysis stage, feedback from the stakeholder groups would be compared to determine areas of agreement as well as areas of divergence


