
Key Insights
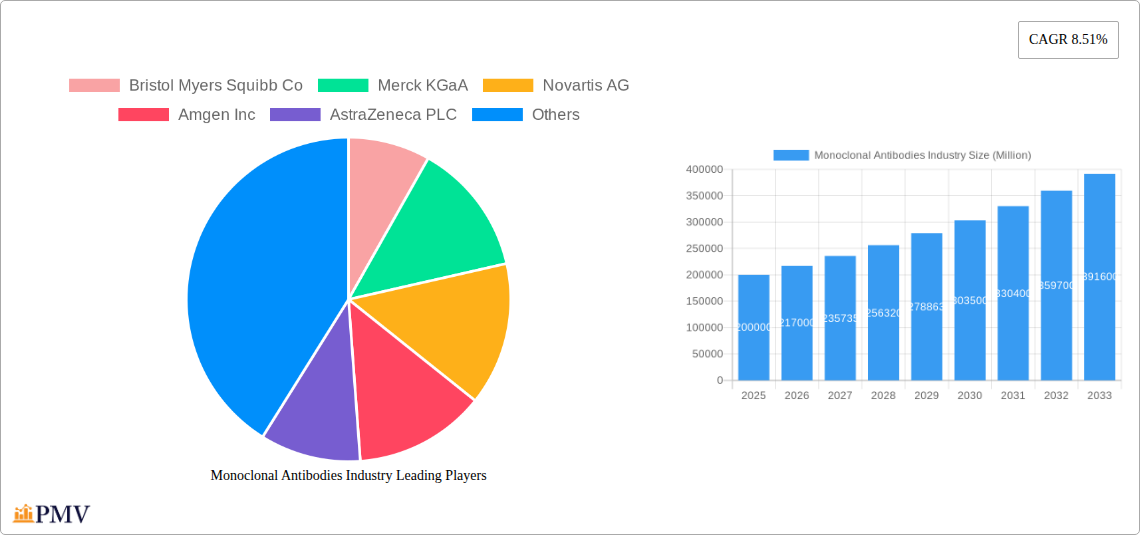
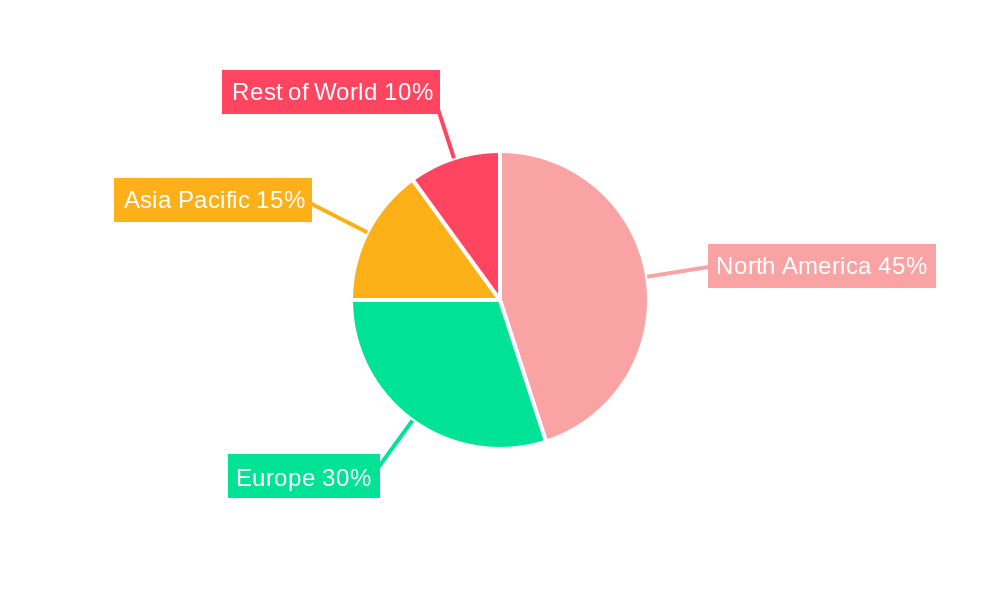
The monoclonal antibodies (mAb) market is experiencing robust growth, driven by the increasing prevalence of chronic diseases like cancer, autoimmune disorders, and infectious diseases. The market's Compound Annual Growth Rate (CAGR) of 8.51% from 2019 to 2024 suggests a significant expansion, projected to continue into the forecast period (2025-2033). This growth is fueled by several key factors: the continuous development of innovative mAb therapies targeting specific disease mechanisms, the rising success rate of clinical trials for new mAb drugs, and the increasing adoption of personalized medicine approaches. Furthermore, substantial investments in research and development by pharmaceutical giants are contributing to a pipeline of promising new mAb-based treatments. The market segmentation reveals a strong demand across various indications, with cancer therapies dominating, followed by treatments for autoimmune and infectious diseases. In terms of end-users, hospitals and research institutes represent the largest segments. The in vivo production method currently holds a larger market share compared to in vitro, while humanized and chimeric mAbs are widely used. Geographical distribution shows North America currently leads the market due to high healthcare expenditure and advanced medical infrastructure, followed by Europe and Asia Pacific, which are expected to experience significant growth in the coming years.
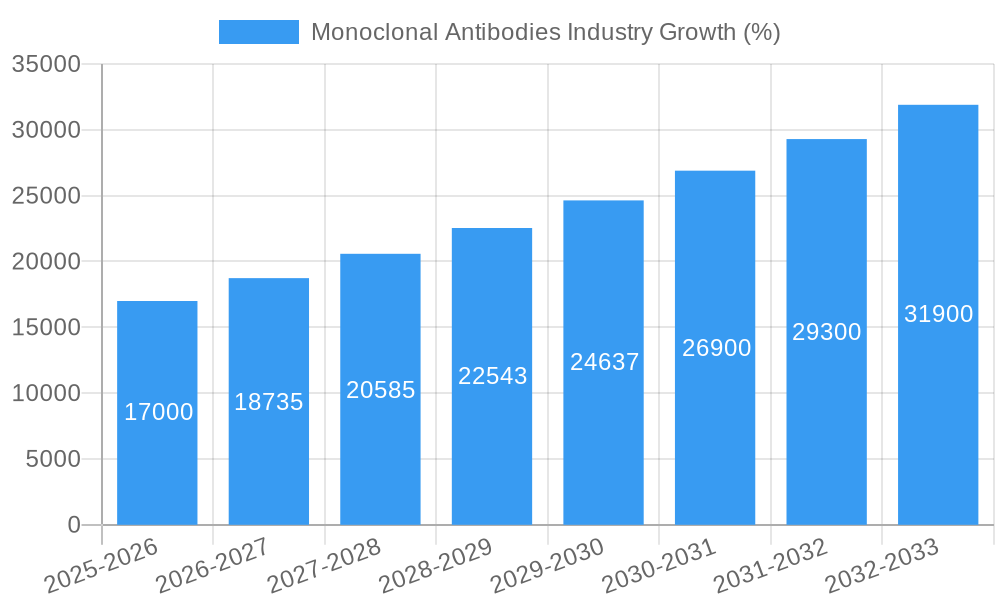
The competitive landscape is characterized by a large number of leading pharmaceutical companies actively involved in developing and marketing mAb therapies. Companies like Bristol Myers Squibb, Merck KGaA, Novartis, and Amgen are prominent players, contributing significantly to market revenue through their diverse portfolios of mAb drugs. However, increased competition and the high cost of research and development, coupled with stringent regulatory approvals, present challenges. The market also faces potential restraints such as the emergence of biosimilar competition and potential side effects associated with mAb therapies. Nevertheless, continuous innovation in mAb technology, expanding therapeutic applications, and growth in emerging markets are expected to drive significant market expansion throughout the forecast period. Considering the 8.51% CAGR from 2019-2024 and assuming a slight moderation in growth, a conservative estimate for the 2025 market size could be around $200 billion, representing substantial potential for investors and stakeholders in the biotechnology and pharmaceutical sectors.
Monoclonal Antibodies Industry: A Comprehensive Market Report (2019-2033)
This in-depth report provides a comprehensive analysis of the global monoclonal antibodies (mAbs) industry, covering market size, segmentation, competitive landscape, and future growth projections from 2019 to 2033. The report leverages extensive primary and secondary research to deliver actionable insights for industry stakeholders, investors, and researchers. With a focus on key players like Bristol Myers Squibb, Merck KGaA, Novartis, Amgen, and AstraZeneca, this report is essential for understanding this rapidly evolving market.
Monoclonal Antibodies Industry Market Structure & Competitive Dynamics
The global monoclonal antibodies market exhibits a moderately concentrated structure, dominated by a handful of large pharmaceutical and biotechnology companies. These players compete fiercely based on innovation, R&D capabilities, manufacturing scale, and regulatory approvals. The market is characterized by a dynamic innovation ecosystem, with ongoing investments in novel mAb therapies across various indications. Regulatory frameworks, particularly those concerning biosimilar approvals, significantly influence market dynamics. The presence of some substitute therapies (e.g., small molecule drugs) poses competitive pressure, although the efficacy and specificity of mAbs often give them a significant advantage. End-user trends, such as the increasing adoption of targeted therapies in cancer treatment and the rising prevalence of autoimmune diseases, are key growth drivers. The market has witnessed several significant mergers and acquisitions (M&A) in recent years, with deal values reaching xx Million in 2024. Key M&A activities often center on acquiring companies with promising drug pipelines or established manufacturing capabilities. Market share analysis reveals that the top 10 companies control approximately xx% of the market.
Monoclonal Antibodies Industry Industry Trends & Insights
The monoclonal antibodies industry is experiencing robust growth, driven primarily by the increasing prevalence of chronic diseases, advancements in biotechnology, and the rising demand for targeted therapies. The Compound Annual Growth Rate (CAGR) from 2025 to 2033 is estimated at xx%. This growth is fueled by several factors, including technological breakthroughs leading to the development of more effective and safer mAbs, increasing research and development investment by major pharmaceutical companies and growing market penetration of mAb therapies across various disease indications. Consumer preferences are shifting towards more targeted and personalized medicine, and mAbs are at the forefront of this shift. Furthermore, favorable regulatory landscapes in several key markets are also contributing significantly to the industry’s growth. Competitive dynamics are characterized by intense rivalry among established players and the emergence of innovative biotech companies developing novel mAb therapies. The market penetration of mAbs continues to increase, particularly in areas like oncology and immunology, although challenges remain in affordability and access to treatment.
Dominant Markets & Segments in Monoclonal Antibodies Industry
Leading Region: North America currently holds the largest market share, driven by high healthcare expenditure, advanced healthcare infrastructure, and a robust regulatory environment. Europe follows as a significant market, with a similar strong emphasis on advanced medicine, and Asia Pacific is witnessing rapid growth due to increasing healthcare awareness and rising disposable incomes.
Dominant Indication: Cancer treatment accounts for the largest segment within the indications category, due to the high efficacy of mAbs in targeting cancer cells with minimal damage to healthy tissues. Autoimmune diseases are also a major segment, given their significant prevalence and the increasing development of targeted treatments.
Dominant End-User: Hospitals represent the largest end-user segment due to their extensive infrastructure and specialized treatment capabilities. Research institutes significantly contribute to the market through research and development activities.
Dominant Production Method: In vitro production is gaining dominance, as it offers higher scalability, better product quality control, and reduced risk of contamination.
Dominant Source: Humanized and human monoclonal antibodies dominate the market owing to their reduced immunogenicity compared to murine or chimeric antibodies.
Key drivers for the dominance of these segments include robust government support for healthcare infrastructure, stringent regulatory approval pathways facilitating market entry for novel therapies and a strong emphasis on research and development in advanced treatment options. The economic policies promoting pharmaceutical innovation and a strong pipeline of new products in these segments are driving expansion.
Monoclonal Antibodies Industry Product Innovations
Recent innovations in monoclonal antibody technology are focused on developing next-generation mAbs with improved efficacy, safety, and delivery mechanisms. This includes advancements in antibody engineering, such as the development of bispecific antibodies and antibody-drug conjugates (ADCs), which enhance targeting and therapeutic effects. Technological advancements in drug delivery systems, such as targeted drug delivery and improved formulations, are also driving product innovation, enhancing the effectiveness of mAbs while minimizing side effects. The market is witnessing a growing trend towards personalized medicine, with the development of mAbs tailored to specific patient populations based on their genetic profiles and disease characteristics. These innovations directly translate into stronger market fit and a significant competitive advantage for companies leading these advancements.
Report Segmentation & Scope
The report segments the market based on indication (Cancer, Autoimmune Diseases, Infectious Diseases, Inflammatory Diseases, Other Indications), end-user (Hospitals, Research Institutes, Other End Users), production method (In Vivo, In Vitro), and source (Chimeric, Human, Humanized, Murine). Each segment is comprehensively analyzed, providing detailed growth projections, market size estimations (in Millions), and competitive dynamics for the period 2019-2033. For example, the cancer indication segment is projected to exhibit significant growth driven by advancements in targeted therapies. Similarly, the in-vitro production method is anticipated to dominate the market based on its scalability and efficiency.
Key Drivers of Monoclonal Antibodies Industry Growth
The growth of the monoclonal antibodies industry is propelled by several key factors. Technological advancements in antibody engineering and drug delivery systems continuously improve the efficacy and safety of mAbs, opening up new therapeutic avenues. Favorable regulatory landscapes in many countries streamline the approval process for innovative mAbs. The rising prevalence of chronic diseases like cancer and autoimmune disorders fuels demand for effective treatments. Increased investment in R&D from major pharmaceutical and biotech companies fosters continuous innovation in this sector. Government initiatives and funding for biomedical research contribute to the overall development and adoption of mAb therapies globally.
Challenges in the Monoclonal Antibodies Industry Sector
Despite significant growth, the monoclonal antibodies industry faces challenges. High research and development costs associated with bringing new mAbs to market present a substantial barrier to entry. Complex regulatory pathways and stringent approval processes can delay product launches. Supply chain disruptions can impact the availability and affordability of raw materials and finished products. Intense competition among established pharmaceutical companies and emerging biotech firms creates pressure on pricing and profit margins. Biosimilar competition is expected to intensify, potentially affecting the pricing of existing mAb therapies.
Leading Players in the Monoclonal Antibodies Industry Market
- Bristol Myers Squibb Co
- Merck KGaA
- Novartis AG
- Amgen Inc
- AstraZeneca PLC
- Eli Lilly and Company
- AbbVie Inc
- F Hoffmann-La-Roche Ltd
- Johnson & Johnson
- GlaxoSmithKline PLC
- Pfizer Inc
Key Developments in Monoclonal Antibodies Industry Sector
February 2022: Eli Lilly and Company announced FDA’s Emergency Use Authorization (EUA) for bebtelovimab, a monoclonal antibody neutralizing the Omicron variant of SARS-CoV-2. This significantly impacted the market by providing a crucial treatment option during the pandemic.
January 2022: HaemaLogiX Ltd and Lonza partnered to manufacture KappaMab, a monoclonal antibody targeting multiple myeloma. This development highlights the growing importance of strategic collaborations in mAb production.
Strategic Monoclonal Antibodies Industry Market Outlook
The future of the monoclonal antibodies industry is bright, with significant growth potential driven by continued innovation, increasing disease prevalence, and expanding applications across various therapeutic areas. Strategic opportunities lie in developing novel mAb therapies with enhanced efficacy, safety, and delivery systems, particularly focusing on unmet medical needs. Investing in advanced manufacturing technologies to enhance production efficiency and reduce costs will be crucial for maintaining competitiveness. Strategic partnerships and collaborations will become increasingly important for accessing new technologies, expanding market reach, and accelerating product development. The market is ripe for the development of personalized and targeted therapies, further driving growth and innovation in this vital sector.
Monoclonal Antibodies Industry Segmentation
-
1. Production Methods
- 1.1. In Vivo
- 1.2. In Vitro
-
2. Source
- 2.1. Chimeric
- 2.2. Human
- 2.3. Humanized
- 2.4. Murine
-
3. Indications
- 3.1. Cancer
- 3.2. Autoimmune Diseases
- 3.3. Infectious Diseases
- 3.4. Inflammatory Diseases
- 3.5. Other Indications
-
4. End Users
- 4.1. Hospitals
- 4.2. Research Institutes
- 4.3. Other End Users
Monoclonal Antibodies Industry Segmentation By Geography
-
1. North America
- 1.1. United States
- 1.2. Canada
- 1.3. Mexico
-
2. Europe
- 2.1. Germany
- 2.2. United Kingdom
- 2.3. France
- 2.4. Italy
- 2.5. Spain
- 2.6. Rest of Europe
-
3. Asia Pacific
- 3.1. China
- 3.2. Japan
- 3.3. India
- 3.4. Australia
- 3.5. South Korea
- 3.6. Rest of Asia Pacific
-
4. Middle East and Africa
- 4.1. GCC
- 4.2. South Africa
- 4.3. Rest of Middle East and Africa
-
5. South America
- 5.1. Brazil
- 5.2. Argentina
- 5.3. Rest of South America
Monoclonal Antibodies Industry REPORT HIGHLIGHTS
| Aspects | Details |
|---|---|
| Study Period | 2019-2033 |
| Base Year | 2024 |
| Estimated Year | 2025 |
| Forecast Period | 2025-2033 |
| Historical Period | 2019-2024 |
| Growth Rate | CAGR of 8.51% from 2019-2033 |
| Segmentation |
|
Table of Contents
- 1. Introduction
- 1.1. Research Scope
- 1.2. Market Segmentation
- 1.3. Research Methodology
- 1.4. Definitions and Assumptions
- 2. Executive Summary
- 2.1. Introduction
- 3. Market Dynamics
- 3.1. Introduction
- 3.2. Market Drivers
- 3.2.1. Rising Technological Advancements; Increasing Burden of Cancer and Other Chronic Diseases; Huge Funding by Government for the Research and Development
- 3.3. Market Restrains
- 3.3.1. High Cost Pertaining to the Method Involved in the Production of Monoclonal Antibodies; Loss of Patents
- 3.4. Market Trends
- 3.4.1. Cancer Monoclonal Antibodies is Estimated to Occupy a Significant Share in the Market over the Forecast Period
- 4. Market Factor Analysis
- 4.1. Porters Five Forces
- 4.2. Supply/Value Chain
- 4.3. PESTEL analysis
- 4.4. Market Entropy
- 4.5. Patent/Trademark Analysis
- 5. Global Monoclonal Antibodies Industry Analysis, Insights and Forecast, 2019-2031
- 5.1. Market Analysis, Insights and Forecast - by Production Methods
- 5.1.1. In Vivo
- 5.1.2. In Vitro
- 5.2. Market Analysis, Insights and Forecast - by Source
- 5.2.1. Chimeric
- 5.2.2. Human
- 5.2.3. Humanized
- 5.2.4. Murine
- 5.3. Market Analysis, Insights and Forecast - by Indications
- 5.3.1. Cancer
- 5.3.2. Autoimmune Diseases
- 5.3.3. Infectious Diseases
- 5.3.4. Inflammatory Diseases
- 5.3.5. Other Indications
- 5.4. Market Analysis, Insights and Forecast - by End Users
- 5.4.1. Hospitals
- 5.4.2. Research Institutes
- 5.4.3. Other End Users
- 5.5. Market Analysis, Insights and Forecast - by Region
- 5.5.1. North America
- 5.5.2. Europe
- 5.5.3. Asia Pacific
- 5.5.4. Middle East and Africa
- 5.5.5. South America
- 5.1. Market Analysis, Insights and Forecast - by Production Methods
- 6. North America Monoclonal Antibodies Industry Analysis, Insights and Forecast, 2019-2031
- 6.1. Market Analysis, Insights and Forecast - by Production Methods
- 6.1.1. In Vivo
- 6.1.2. In Vitro
- 6.2. Market Analysis, Insights and Forecast - by Source
- 6.2.1. Chimeric
- 6.2.2. Human
- 6.2.3. Humanized
- 6.2.4. Murine
- 6.3. Market Analysis, Insights and Forecast - by Indications
- 6.3.1. Cancer
- 6.3.2. Autoimmune Diseases
- 6.3.3. Infectious Diseases
- 6.3.4. Inflammatory Diseases
- 6.3.5. Other Indications
- 6.4. Market Analysis, Insights and Forecast - by End Users
- 6.4.1. Hospitals
- 6.4.2. Research Institutes
- 6.4.3. Other End Users
- 6.1. Market Analysis, Insights and Forecast - by Production Methods
- 7. Europe Monoclonal Antibodies Industry Analysis, Insights and Forecast, 2019-2031
- 7.1. Market Analysis, Insights and Forecast - by Production Methods
- 7.1.1. In Vivo
- 7.1.2. In Vitro
- 7.2. Market Analysis, Insights and Forecast - by Source
- 7.2.1. Chimeric
- 7.2.2. Human
- 7.2.3. Humanized
- 7.2.4. Murine
- 7.3. Market Analysis, Insights and Forecast - by Indications
- 7.3.1. Cancer
- 7.3.2. Autoimmune Diseases
- 7.3.3. Infectious Diseases
- 7.3.4. Inflammatory Diseases
- 7.3.5. Other Indications
- 7.4. Market Analysis, Insights and Forecast - by End Users
- 7.4.1. Hospitals
- 7.4.2. Research Institutes
- 7.4.3. Other End Users
- 7.1. Market Analysis, Insights and Forecast - by Production Methods
- 8. Asia Pacific Monoclonal Antibodies Industry Analysis, Insights and Forecast, 2019-2031
- 8.1. Market Analysis, Insights and Forecast - by Production Methods
- 8.1.1. In Vivo
- 8.1.2. In Vitro
- 8.2. Market Analysis, Insights and Forecast - by Source
- 8.2.1. Chimeric
- 8.2.2. Human
- 8.2.3. Humanized
- 8.2.4. Murine
- 8.3. Market Analysis, Insights and Forecast - by Indications
- 8.3.1. Cancer
- 8.3.2. Autoimmune Diseases
- 8.3.3. Infectious Diseases
- 8.3.4. Inflammatory Diseases
- 8.3.5. Other Indications
- 8.4. Market Analysis, Insights and Forecast - by End Users
- 8.4.1. Hospitals
- 8.4.2. Research Institutes
- 8.4.3. Other End Users
- 8.1. Market Analysis, Insights and Forecast - by Production Methods
- 9. Middle East and Africa Monoclonal Antibodies Industry Analysis, Insights and Forecast, 2019-2031
- 9.1. Market Analysis, Insights and Forecast - by Production Methods
- 9.1.1. In Vivo
- 9.1.2. In Vitro
- 9.2. Market Analysis, Insights and Forecast - by Source
- 9.2.1. Chimeric
- 9.2.2. Human
- 9.2.3. Humanized
- 9.2.4. Murine
- 9.3. Market Analysis, Insights and Forecast - by Indications
- 9.3.1. Cancer
- 9.3.2. Autoimmune Diseases
- 9.3.3. Infectious Diseases
- 9.3.4. Inflammatory Diseases
- 9.3.5. Other Indications
- 9.4. Market Analysis, Insights and Forecast - by End Users
- 9.4.1. Hospitals
- 9.4.2. Research Institutes
- 9.4.3. Other End Users
- 9.1. Market Analysis, Insights and Forecast - by Production Methods
- 10. South America Monoclonal Antibodies Industry Analysis, Insights and Forecast, 2019-2031
- 10.1. Market Analysis, Insights and Forecast - by Production Methods
- 10.1.1. In Vivo
- 10.1.2. In Vitro
- 10.2. Market Analysis, Insights and Forecast - by Source
- 10.2.1. Chimeric
- 10.2.2. Human
- 10.2.3. Humanized
- 10.2.4. Murine
- 10.3. Market Analysis, Insights and Forecast - by Indications
- 10.3.1. Cancer
- 10.3.2. Autoimmune Diseases
- 10.3.3. Infectious Diseases
- 10.3.4. Inflammatory Diseases
- 10.3.5. Other Indications
- 10.4. Market Analysis, Insights and Forecast - by End Users
- 10.4.1. Hospitals
- 10.4.2. Research Institutes
- 10.4.3. Other End Users
- 10.1. Market Analysis, Insights and Forecast - by Production Methods
- 11. North America Monoclonal Antibodies Industry Analysis, Insights and Forecast, 2019-2031
- 11.1. Market Analysis, Insights and Forecast - By Country/Sub-region
- 11.1.1 United States
- 11.1.2 Canada
- 11.1.3 Mexico
- 12. Europe Monoclonal Antibodies Industry Analysis, Insights and Forecast, 2019-2031
- 12.1. Market Analysis, Insights and Forecast - By Country/Sub-region
- 12.1.1 Germany
- 12.1.2 United Kingdom
- 12.1.3 France
- 12.1.4 Italy
- 12.1.5 Spain
- 12.1.6 Rest of Europe
- 13. Asia Pacific Monoclonal Antibodies Industry Analysis, Insights and Forecast, 2019-2031
- 13.1. Market Analysis, Insights and Forecast - By Country/Sub-region
- 13.1.1 China
- 13.1.2 Japan
- 13.1.3 India
- 13.1.4 Australia
- 13.1.5 South Korea
- 13.1.6 Rest of Asia Pacific
- 14. Middle East and Africa Monoclonal Antibodies Industry Analysis, Insights and Forecast, 2019-2031
- 14.1. Market Analysis, Insights and Forecast - By Country/Sub-region
- 14.1.1 GCC
- 14.1.2 South Africa
- 14.1.3 Rest of Middle East and Africa
- 15. South America Monoclonal Antibodies Industry Analysis, Insights and Forecast, 2019-2031
- 15.1. Market Analysis, Insights and Forecast - By Country/Sub-region
- 15.1.1 Brazil
- 15.1.2 Argentina
- 15.1.3 Rest of South America
- 16. Competitive Analysis
- 16.1. Global Market Share Analysis 2024
- 16.2. Company Profiles
- 16.2.1 Bristol Myers Squibb Co
- 16.2.1.1. Overview
- 16.2.1.2. Products
- 16.2.1.3. SWOT Analysis
- 16.2.1.4. Recent Developments
- 16.2.1.5. Financials (Based on Availability)
- 16.2.2 Merck KGaA
- 16.2.2.1. Overview
- 16.2.2.2. Products
- 16.2.2.3. SWOT Analysis
- 16.2.2.4. Recent Developments
- 16.2.2.5. Financials (Based on Availability)
- 16.2.3 Novartis AG
- 16.2.3.1. Overview
- 16.2.3.2. Products
- 16.2.3.3. SWOT Analysis
- 16.2.3.4. Recent Developments
- 16.2.3.5. Financials (Based on Availability)
- 16.2.4 Amgen Inc
- 16.2.4.1. Overview
- 16.2.4.2. Products
- 16.2.4.3. SWOT Analysis
- 16.2.4.4. Recent Developments
- 16.2.4.5. Financials (Based on Availability)
- 16.2.5 AstraZeneca PLC
- 16.2.5.1. Overview
- 16.2.5.2. Products
- 16.2.5.3. SWOT Analysis
- 16.2.5.4. Recent Developments
- 16.2.5.5. Financials (Based on Availability)
- 16.2.6 Eli Lilly and Company
- 16.2.6.1. Overview
- 16.2.6.2. Products
- 16.2.6.3. SWOT Analysis
- 16.2.6.4. Recent Developments
- 16.2.6.5. Financials (Based on Availability)
- 16.2.7 AbbVie Inc
- 16.2.7.1. Overview
- 16.2.7.2. Products
- 16.2.7.3. SWOT Analysis
- 16.2.7.4. Recent Developments
- 16.2.7.5. Financials (Based on Availability)
- 16.2.8 F Hoffmann-La-Roche Ltd
- 16.2.8.1. Overview
- 16.2.8.2. Products
- 16.2.8.3. SWOT Analysis
- 16.2.8.4. Recent Developments
- 16.2.8.5. Financials (Based on Availability)
- 16.2.9 Johnson & Johnson
- 16.2.9.1. Overview
- 16.2.9.2. Products
- 16.2.9.3. SWOT Analysis
- 16.2.9.4. Recent Developments
- 16.2.9.5. Financials (Based on Availability)
- 16.2.10 GlaxoSmithKline PLC
- 16.2.10.1. Overview
- 16.2.10.2. Products
- 16.2.10.3. SWOT Analysis
- 16.2.10.4. Recent Developments
- 16.2.10.5. Financials (Based on Availability)
- 16.2.11 Pfizer Inc
- 16.2.11.1. Overview
- 16.2.11.2. Products
- 16.2.11.3. SWOT Analysis
- 16.2.11.4. Recent Developments
- 16.2.11.5. Financials (Based on Availability)
- 16.2.1 Bristol Myers Squibb Co
List of Figures
- Figure 1: Global Monoclonal Antibodies Industry Revenue Breakdown (Million, %) by Region 2024 & 2032
- Figure 2: North America Monoclonal Antibodies Industry Revenue (Million), by Country 2024 & 2032
- Figure 3: North America Monoclonal Antibodies Industry Revenue Share (%), by Country 2024 & 2032
- Figure 4: Europe Monoclonal Antibodies Industry Revenue (Million), by Country 2024 & 2032
- Figure 5: Europe Monoclonal Antibodies Industry Revenue Share (%), by Country 2024 & 2032
- Figure 6: Asia Pacific Monoclonal Antibodies Industry Revenue (Million), by Country 2024 & 2032
- Figure 7: Asia Pacific Monoclonal Antibodies Industry Revenue Share (%), by Country 2024 & 2032
- Figure 8: Middle East and Africa Monoclonal Antibodies Industry Revenue (Million), by Country 2024 & 2032
- Figure 9: Middle East and Africa Monoclonal Antibodies Industry Revenue Share (%), by Country 2024 & 2032
- Figure 10: South America Monoclonal Antibodies Industry Revenue (Million), by Country 2024 & 2032
- Figure 11: South America Monoclonal Antibodies Industry Revenue Share (%), by Country 2024 & 2032
- Figure 12: North America Monoclonal Antibodies Industry Revenue (Million), by Production Methods 2024 & 2032
- Figure 13: North America Monoclonal Antibodies Industry Revenue Share (%), by Production Methods 2024 & 2032
- Figure 14: North America Monoclonal Antibodies Industry Revenue (Million), by Source 2024 & 2032
- Figure 15: North America Monoclonal Antibodies Industry Revenue Share (%), by Source 2024 & 2032
- Figure 16: North America Monoclonal Antibodies Industry Revenue (Million), by Indications 2024 & 2032
- Figure 17: North America Monoclonal Antibodies Industry Revenue Share (%), by Indications 2024 & 2032
- Figure 18: North America Monoclonal Antibodies Industry Revenue (Million), by End Users 2024 & 2032
- Figure 19: North America Monoclonal Antibodies Industry Revenue Share (%), by End Users 2024 & 2032
- Figure 20: North America Monoclonal Antibodies Industry Revenue (Million), by Country 2024 & 2032
- Figure 21: North America Monoclonal Antibodies Industry Revenue Share (%), by Country 2024 & 2032
- Figure 22: Europe Monoclonal Antibodies Industry Revenue (Million), by Production Methods 2024 & 2032
- Figure 23: Europe Monoclonal Antibodies Industry Revenue Share (%), by Production Methods 2024 & 2032
- Figure 24: Europe Monoclonal Antibodies Industry Revenue (Million), by Source 2024 & 2032
- Figure 25: Europe Monoclonal Antibodies Industry Revenue Share (%), by Source 2024 & 2032
- Figure 26: Europe Monoclonal Antibodies Industry Revenue (Million), by Indications 2024 & 2032
- Figure 27: Europe Monoclonal Antibodies Industry Revenue Share (%), by Indications 2024 & 2032
- Figure 28: Europe Monoclonal Antibodies Industry Revenue (Million), by End Users 2024 & 2032
- Figure 29: Europe Monoclonal Antibodies Industry Revenue Share (%), by End Users 2024 & 2032
- Figure 30: Europe Monoclonal Antibodies Industry Revenue (Million), by Country 2024 & 2032
- Figure 31: Europe Monoclonal Antibodies Industry Revenue Share (%), by Country 2024 & 2032
- Figure 32: Asia Pacific Monoclonal Antibodies Industry Revenue (Million), by Production Methods 2024 & 2032
- Figure 33: Asia Pacific Monoclonal Antibodies Industry Revenue Share (%), by Production Methods 2024 & 2032
- Figure 34: Asia Pacific Monoclonal Antibodies Industry Revenue (Million), by Source 2024 & 2032
- Figure 35: Asia Pacific Monoclonal Antibodies Industry Revenue Share (%), by Source 2024 & 2032
- Figure 36: Asia Pacific Monoclonal Antibodies Industry Revenue (Million), by Indications 2024 & 2032
- Figure 37: Asia Pacific Monoclonal Antibodies Industry Revenue Share (%), by Indications 2024 & 2032
- Figure 38: Asia Pacific Monoclonal Antibodies Industry Revenue (Million), by End Users 2024 & 2032
- Figure 39: Asia Pacific Monoclonal Antibodies Industry Revenue Share (%), by End Users 2024 & 2032
- Figure 40: Asia Pacific Monoclonal Antibodies Industry Revenue (Million), by Country 2024 & 2032
- Figure 41: Asia Pacific Monoclonal Antibodies Industry Revenue Share (%), by Country 2024 & 2032
- Figure 42: Middle East and Africa Monoclonal Antibodies Industry Revenue (Million), by Production Methods 2024 & 2032
- Figure 43: Middle East and Africa Monoclonal Antibodies Industry Revenue Share (%), by Production Methods 2024 & 2032
- Figure 44: Middle East and Africa Monoclonal Antibodies Industry Revenue (Million), by Source 2024 & 2032
- Figure 45: Middle East and Africa Monoclonal Antibodies Industry Revenue Share (%), by Source 2024 & 2032
- Figure 46: Middle East and Africa Monoclonal Antibodies Industry Revenue (Million), by Indications 2024 & 2032
- Figure 47: Middle East and Africa Monoclonal Antibodies Industry Revenue Share (%), by Indications 2024 & 2032
- Figure 48: Middle East and Africa Monoclonal Antibodies Industry Revenue (Million), by End Users 2024 & 2032
- Figure 49: Middle East and Africa Monoclonal Antibodies Industry Revenue Share (%), by End Users 2024 & 2032
- Figure 50: Middle East and Africa Monoclonal Antibodies Industry Revenue (Million), by Country 2024 & 2032
- Figure 51: Middle East and Africa Monoclonal Antibodies Industry Revenue Share (%), by Country 2024 & 2032
- Figure 52: South America Monoclonal Antibodies Industry Revenue (Million), by Production Methods 2024 & 2032
- Figure 53: South America Monoclonal Antibodies Industry Revenue Share (%), by Production Methods 2024 & 2032
- Figure 54: South America Monoclonal Antibodies Industry Revenue (Million), by Source 2024 & 2032
- Figure 55: South America Monoclonal Antibodies Industry Revenue Share (%), by Source 2024 & 2032
- Figure 56: South America Monoclonal Antibodies Industry Revenue (Million), by Indications 2024 & 2032
- Figure 57: South America Monoclonal Antibodies Industry Revenue Share (%), by Indications 2024 & 2032
- Figure 58: South America Monoclonal Antibodies Industry Revenue (Million), by End Users 2024 & 2032
- Figure 59: South America Monoclonal Antibodies Industry Revenue Share (%), by End Users 2024 & 2032
- Figure 60: South America Monoclonal Antibodies Industry Revenue (Million), by Country 2024 & 2032
- Figure 61: South America Monoclonal Antibodies Industry Revenue Share (%), by Country 2024 & 2032
List of Tables
- Table 1: Global Monoclonal Antibodies Industry Revenue Million Forecast, by Region 2019 & 2032
- Table 2: Global Monoclonal Antibodies Industry Revenue Million Forecast, by Production Methods 2019 & 2032
- Table 3: Global Monoclonal Antibodies Industry Revenue Million Forecast, by Source 2019 & 2032
- Table 4: Global Monoclonal Antibodies Industry Revenue Million Forecast, by Indications 2019 & 2032
- Table 5: Global Monoclonal Antibodies Industry Revenue Million Forecast, by End Users 2019 & 2032
- Table 6: Global Monoclonal Antibodies Industry Revenue Million Forecast, by Region 2019 & 2032
- Table 7: Global Monoclonal Antibodies Industry Revenue Million Forecast, by Country 2019 & 2032
- Table 8: United States Monoclonal Antibodies Industry Revenue (Million) Forecast, by Application 2019 & 2032
- Table 9: Canada Monoclonal Antibodies Industry Revenue (Million) Forecast, by Application 2019 & 2032
- Table 10: Mexico Monoclonal Antibodies Industry Revenue (Million) Forecast, by Application 2019 & 2032
- Table 11: Global Monoclonal Antibodies Industry Revenue Million Forecast, by Country 2019 & 2032
- Table 12: Germany Monoclonal Antibodies Industry Revenue (Million) Forecast, by Application 2019 & 2032
- Table 13: United Kingdom Monoclonal Antibodies Industry Revenue (Million) Forecast, by Application 2019 & 2032
- Table 14: France Monoclonal Antibodies Industry Revenue (Million) Forecast, by Application 2019 & 2032
- Table 15: Italy Monoclonal Antibodies Industry Revenue (Million) Forecast, by Application 2019 & 2032
- Table 16: Spain Monoclonal Antibodies Industry Revenue (Million) Forecast, by Application 2019 & 2032
- Table 17: Rest of Europe Monoclonal Antibodies Industry Revenue (Million) Forecast, by Application 2019 & 2032
- Table 18: Global Monoclonal Antibodies Industry Revenue Million Forecast, by Country 2019 & 2032
- Table 19: China Monoclonal Antibodies Industry Revenue (Million) Forecast, by Application 2019 & 2032
- Table 20: Japan Monoclonal Antibodies Industry Revenue (Million) Forecast, by Application 2019 & 2032
- Table 21: India Monoclonal Antibodies Industry Revenue (Million) Forecast, by Application 2019 & 2032
- Table 22: Australia Monoclonal Antibodies Industry Revenue (Million) Forecast, by Application 2019 & 2032
- Table 23: South Korea Monoclonal Antibodies Industry Revenue (Million) Forecast, by Application 2019 & 2032
- Table 24: Rest of Asia Pacific Monoclonal Antibodies Industry Revenue (Million) Forecast, by Application 2019 & 2032
- Table 25: Global Monoclonal Antibodies Industry Revenue Million Forecast, by Country 2019 & 2032
- Table 26: GCC Monoclonal Antibodies Industry Revenue (Million) Forecast, by Application 2019 & 2032
- Table 27: South Africa Monoclonal Antibodies Industry Revenue (Million) Forecast, by Application 2019 & 2032
- Table 28: Rest of Middle East and Africa Monoclonal Antibodies Industry Revenue (Million) Forecast, by Application 2019 & 2032
- Table 29: Global Monoclonal Antibodies Industry Revenue Million Forecast, by Country 2019 & 2032
- Table 30: Brazil Monoclonal Antibodies Industry Revenue (Million) Forecast, by Application 2019 & 2032
- Table 31: Argentina Monoclonal Antibodies Industry Revenue (Million) Forecast, by Application 2019 & 2032
- Table 32: Rest of South America Monoclonal Antibodies Industry Revenue (Million) Forecast, by Application 2019 & 2032
- Table 33: Global Monoclonal Antibodies Industry Revenue Million Forecast, by Production Methods 2019 & 2032
- Table 34: Global Monoclonal Antibodies Industry Revenue Million Forecast, by Source 2019 & 2032
- Table 35: Global Monoclonal Antibodies Industry Revenue Million Forecast, by Indications 2019 & 2032
- Table 36: Global Monoclonal Antibodies Industry Revenue Million Forecast, by End Users 2019 & 2032
- Table 37: Global Monoclonal Antibodies Industry Revenue Million Forecast, by Country 2019 & 2032
- Table 38: United States Monoclonal Antibodies Industry Revenue (Million) Forecast, by Application 2019 & 2032
- Table 39: Canada Monoclonal Antibodies Industry Revenue (Million) Forecast, by Application 2019 & 2032
- Table 40: Mexico Monoclonal Antibodies Industry Revenue (Million) Forecast, by Application 2019 & 2032
- Table 41: Global Monoclonal Antibodies Industry Revenue Million Forecast, by Production Methods 2019 & 2032
- Table 42: Global Monoclonal Antibodies Industry Revenue Million Forecast, by Source 2019 & 2032
- Table 43: Global Monoclonal Antibodies Industry Revenue Million Forecast, by Indications 2019 & 2032
- Table 44: Global Monoclonal Antibodies Industry Revenue Million Forecast, by End Users 2019 & 2032
- Table 45: Global Monoclonal Antibodies Industry Revenue Million Forecast, by Country 2019 & 2032
- Table 46: Germany Monoclonal Antibodies Industry Revenue (Million) Forecast, by Application 2019 & 2032
- Table 47: United Kingdom Monoclonal Antibodies Industry Revenue (Million) Forecast, by Application 2019 & 2032
- Table 48: France Monoclonal Antibodies Industry Revenue (Million) Forecast, by Application 2019 & 2032
- Table 49: Italy Monoclonal Antibodies Industry Revenue (Million) Forecast, by Application 2019 & 2032
- Table 50: Spain Monoclonal Antibodies Industry Revenue (Million) Forecast, by Application 2019 & 2032
- Table 51: Rest of Europe Monoclonal Antibodies Industry Revenue (Million) Forecast, by Application 2019 & 2032
- Table 52: Global Monoclonal Antibodies Industry Revenue Million Forecast, by Production Methods 2019 & 2032
- Table 53: Global Monoclonal Antibodies Industry Revenue Million Forecast, by Source 2019 & 2032
- Table 54: Global Monoclonal Antibodies Industry Revenue Million Forecast, by Indications 2019 & 2032
- Table 55: Global Monoclonal Antibodies Industry Revenue Million Forecast, by End Users 2019 & 2032
- Table 56: Global Monoclonal Antibodies Industry Revenue Million Forecast, by Country 2019 & 2032
- Table 57: China Monoclonal Antibodies Industry Revenue (Million) Forecast, by Application 2019 & 2032
- Table 58: Japan Monoclonal Antibodies Industry Revenue (Million) Forecast, by Application 2019 & 2032
- Table 59: India Monoclonal Antibodies Industry Revenue (Million) Forecast, by Application 2019 & 2032
- Table 60: Australia Monoclonal Antibodies Industry Revenue (Million) Forecast, by Application 2019 & 2032
- Table 61: South Korea Monoclonal Antibodies Industry Revenue (Million) Forecast, by Application 2019 & 2032
- Table 62: Rest of Asia Pacific Monoclonal Antibodies Industry Revenue (Million) Forecast, by Application 2019 & 2032
- Table 63: Global Monoclonal Antibodies Industry Revenue Million Forecast, by Production Methods 2019 & 2032
- Table 64: Global Monoclonal Antibodies Industry Revenue Million Forecast, by Source 2019 & 2032
- Table 65: Global Monoclonal Antibodies Industry Revenue Million Forecast, by Indications 2019 & 2032
- Table 66: Global Monoclonal Antibodies Industry Revenue Million Forecast, by End Users 2019 & 2032
- Table 67: Global Monoclonal Antibodies Industry Revenue Million Forecast, by Country 2019 & 2032
- Table 68: GCC Monoclonal Antibodies Industry Revenue (Million) Forecast, by Application 2019 & 2032
- Table 69: South Africa Monoclonal Antibodies Industry Revenue (Million) Forecast, by Application 2019 & 2032
- Table 70: Rest of Middle East and Africa Monoclonal Antibodies Industry Revenue (Million) Forecast, by Application 2019 & 2032
- Table 71: Global Monoclonal Antibodies Industry Revenue Million Forecast, by Production Methods 2019 & 2032
- Table 72: Global Monoclonal Antibodies Industry Revenue Million Forecast, by Source 2019 & 2032
- Table 73: Global Monoclonal Antibodies Industry Revenue Million Forecast, by Indications 2019 & 2032
- Table 74: Global Monoclonal Antibodies Industry Revenue Million Forecast, by End Users 2019 & 2032
- Table 75: Global Monoclonal Antibodies Industry Revenue Million Forecast, by Country 2019 & 2032
- Table 76: Brazil Monoclonal Antibodies Industry Revenue (Million) Forecast, by Application 2019 & 2032
- Table 77: Argentina Monoclonal Antibodies Industry Revenue (Million) Forecast, by Application 2019 & 2032
- Table 78: Rest of South America Monoclonal Antibodies Industry Revenue (Million) Forecast, by Application 2019 & 2032
Frequently Asked Questions
1. What is the projected Compound Annual Growth Rate (CAGR) of the Monoclonal Antibodies Industry?
The projected CAGR is approximately 8.51%.
2. Which companies are prominent players in the Monoclonal Antibodies Industry?
Key companies in the market include Bristol Myers Squibb Co, Merck KGaA, Novartis AG, Amgen Inc, AstraZeneca PLC, Eli Lilly and Company, AbbVie Inc, F Hoffmann-La-Roche Ltd, Johnson & Johnson, GlaxoSmithKline PLC, Pfizer Inc.
3. What are the main segments of the Monoclonal Antibodies Industry?
The market segments include Production Methods, Source, Indications, End Users.
4. Can you provide details about the market size?
The market size is estimated to be USD XX Million as of 2022.
5. What are some drivers contributing to market growth?
Rising Technological Advancements; Increasing Burden of Cancer and Other Chronic Diseases; Huge Funding by Government for the Research and Development.
6. What are the notable trends driving market growth?
Cancer Monoclonal Antibodies is Estimated to Occupy a Significant Share in the Market over the Forecast Period.
7. Are there any restraints impacting market growth?
High Cost Pertaining to the Method Involved in the Production of Monoclonal Antibodies; Loss of Patents.
8. Can you provide examples of recent developments in the market?
In February 2022, Eli Lilly and Company announced that United States Food and Drug Administration (FDA) has issued an Emergency Use Authorization (EUA) for bebtelovimab, an antibody that demonstrates neutralization against the Omicron variant. Bebtelovimab is a neutralizing IgG1 monoclonal antibody (mAb) directed against the spike protein of SARS-CoV-2.
9. What pricing options are available for accessing the report?
Pricing options include single-user, multi-user, and enterprise licenses priced at USD 4750, USD 5250, and USD 8750 respectively.
10. Is the market size provided in terms of value or volume?
The market size is provided in terms of value, measured in Million.
11. Are there any specific market keywords associated with the report?
Yes, the market keyword associated with the report is "Monoclonal Antibodies Industry," which aids in identifying and referencing the specific market segment covered.
12. How do I determine which pricing option suits my needs best?
The pricing options vary based on user requirements and access needs. Individual users may opt for single-user licenses, while businesses requiring broader access may choose multi-user or enterprise licenses for cost-effective access to the report.
13. Are there any additional resources or data provided in the Monoclonal Antibodies Industry report?
While the report offers comprehensive insights, it's advisable to review the specific contents or supplementary materials provided to ascertain if additional resources or data are available.
14. How can I stay updated on further developments or reports in the Monoclonal Antibodies Industry?
To stay informed about further developments, trends, and reports in the Monoclonal Antibodies Industry, consider subscribing to industry newsletters, following relevant companies and organizations, or regularly checking reputable industry news sources and publications.
Methodology
Step 1 - Identification of Relevant Samples Size from Population Database


Step 2 - Approaches for Defining Global Market Size (Value, Volume* & Price*)

Note*: In applicable scenarios
Step 3 - Data Sources
Primary Research
- Web Analytics
- Survey Reports
- Research Institute
- Latest Research Reports
- Opinion Leaders
Secondary Research
- Annual Reports
- White Paper
- Latest Press Release
- Industry Association
- Paid Database
- Investor Presentations

Step 4 - Data Triangulation
Involves using different sources of information in order to increase the validity of a study
These sources are likely to be stakeholders in a program - participants, other researchers, program staff, other community members, and so on.
Then we put all data in single framework & apply various statistical tools to find out the dynamic on the market.
During the analysis stage, feedback from the stakeholder groups would be compared to determine areas of agreement as well as areas of divergence


