
Key Insights
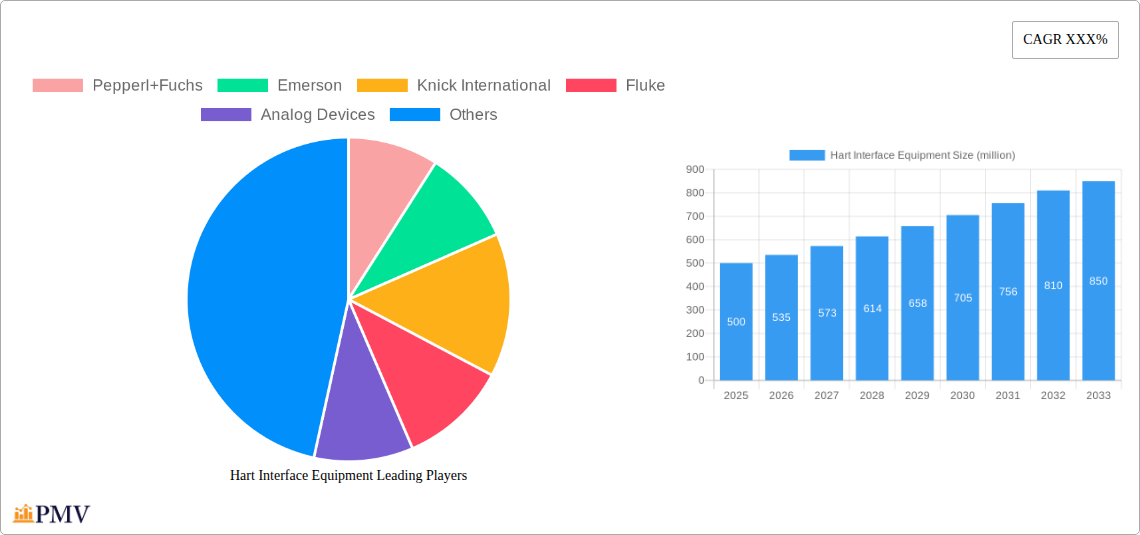
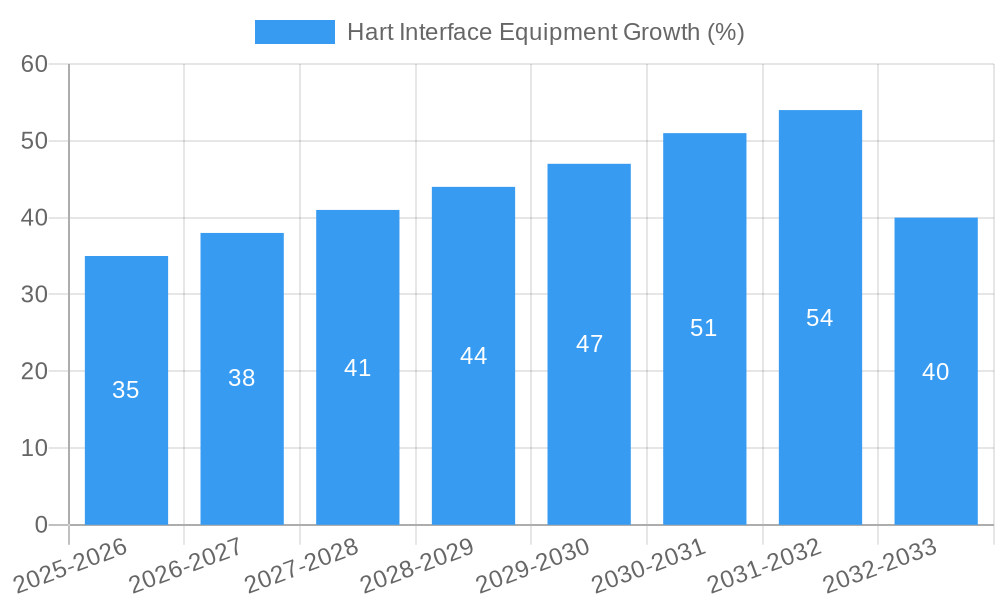
The HART (Highway Addressable Remote Transducer) interface equipment market is experiencing robust growth, driven by increasing automation in process industries and the demand for reliable, efficient, and cost-effective process monitoring and control solutions. The market, estimated at $500 million in 2025, is projected to witness a Compound Annual Growth Rate (CAGR) of 7% from 2025 to 2033, reaching approximately $850 million by 2033. Key drivers include the expanding adoption of smart manufacturing technologies, the need for enhanced process optimization, and stringent regulatory compliance requirements across various sectors like oil & gas, chemicals, water & wastewater, and pharmaceuticals. The market is segmented by equipment type (transmitters, communication modules, handheld communicators), application (flow, level, pressure, temperature), and geography. Leading players like Pepperl+Fuchs, Emerson, and Rockwell Automation are actively contributing to the market growth through product innovation, strategic partnerships, and expansion into emerging markets. The rising adoption of IIoT (Industrial Internet of Things) and the increasing integration of HART devices within larger automation systems are shaping future market trends.
Despite strong growth prospects, certain restraints exist. These include the high initial investment costs associated with HART implementation, the need for specialized expertise in installation and maintenance, and the potential challenges of integrating legacy systems with newer HART-based technologies. However, ongoing technological advancements, decreasing equipment costs, and the availability of comprehensive training programs are mitigating these restraints, paving the way for continued expansion of the HART interface equipment market. The competitive landscape is marked by both established players and emerging companies, fostering innovation and driving market growth. Companies are focusing on developing advanced features such as improved diagnostics capabilities, enhanced data security, and seamless integration with other industrial communication protocols to gain a competitive edge. The Asia-Pacific region is expected to showcase significant growth driven by substantial industrial investment and rapid infrastructure development.
Hart Interface Equipment Market: A Comprehensive Analysis (2019-2033)
This detailed report provides a comprehensive analysis of the Hart Interface Equipment market, offering invaluable insights for businesses, investors, and researchers. The study covers the period 2019-2033, with a focus on the forecast period 2025-2033, using 2025 as the base year. The report encompasses a detailed examination of market structure, competitive dynamics, industry trends, key players, and future growth prospects, with a market value exceeding $XX million in 2025, projected to reach $XX million by 2033, exhibiting a CAGR of XX%.
Hart Interface Equipment Market Structure & Competitive Dynamics
The Hart Interface Equipment market exhibits a moderately consolidated structure, with key players holding significant market share. Pepperl+Fuchs, Emerson, and Rockwell Automation are among the leading companies, collectively accounting for an estimated xx% of the global market share in 2025. The market is characterized by a dynamic innovation ecosystem, driven by continuous technological advancements and the emergence of smart manufacturing solutions. Regulatory frameworks, particularly those related to industrial safety and data security, play a crucial role in shaping market dynamics. Product substitutes, such as other fieldbus communication protocols, pose a competitive challenge, but the robustness and wide adoption of HART protocol continues to maintain its strong position. End-user trends, driven by the increasing demand for automation and process optimization across various industries, are a key market driver. Mergers and acquisitions (M&A) activities have been relatively frequent, with deal values exceeding $XX million in recent years, indicating ongoing consolidation within the market. Specific M&A examples include [insert specific M&A details if available, with deal values].
Hart Interface Equipment Industry Trends & Insights
The Hart Interface Equipment market is witnessing robust growth fueled by several key factors. The increasing adoption of automation and digitization across process industries, such as oil and gas, water, and chemicals, is a major driver. The rising demand for enhanced process efficiency, improved safety, and reduced operational costs is further propelling market growth. Technological disruptions, such as the integration of IIoT (Industrial Internet of Things) and advanced analytics, are transforming the landscape. Consumer preferences are shifting towards more sophisticated, reliable, and easily integrated Hart interface equipment. The competitive landscape is highly dynamic, with companies focusing on innovation, product differentiation, and strategic partnerships to gain a competitive edge. The market penetration of HART technology in emerging economies is also increasing, leading to substantial growth opportunities. The global market is experiencing a Compound Annual Growth Rate (CAGR) of XX% during the forecast period.
Dominant Markets & Segments in Hart Interface Equipment
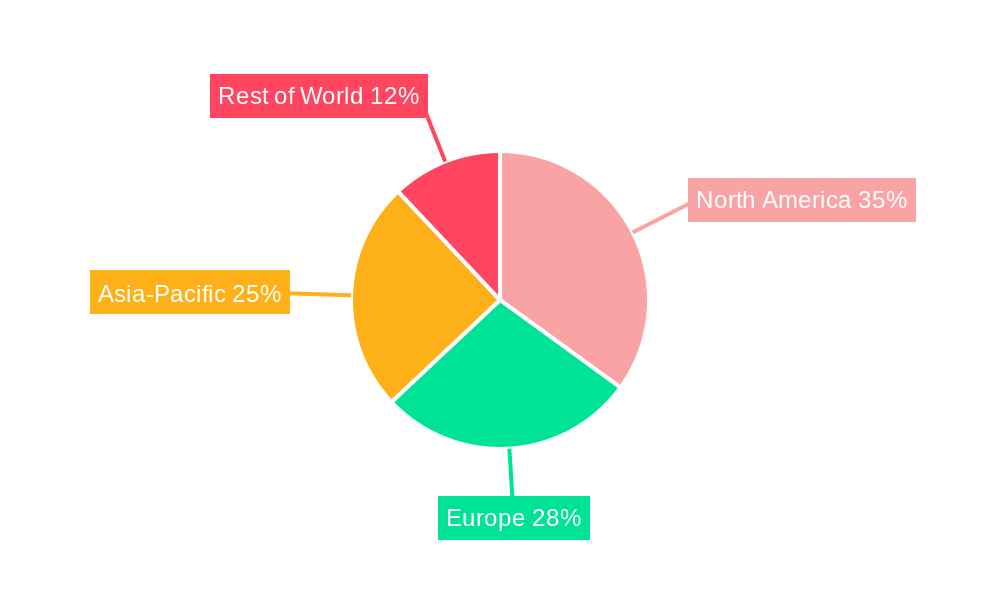
The North American region currently holds a dominant position in the Hart Interface Equipment market, driven by factors such as a mature industrial infrastructure, strong technological advancements, and high adoption rates within various industries.
- Key Drivers in North America:
- Robust industrial base and significant investments in automation and process optimization.
- Favorable regulatory environment supporting the adoption of advanced technologies.
- High technological expertise and skilled workforce.
- Established supply chains and well-developed distribution networks.
Detailed analysis indicates that the [Specific Segment e.g., Oil and Gas segment] within the North American market displays particularly strong growth, driven by increasing exploration and production activities, along with the need for enhanced monitoring and control systems. [Further analysis of other regions/segments and their drivers could be included here, if the information is available. The same structure of bullet points and paragraphs can be maintained].
Hart Interface Equipment Product Innovations
Recent innovations in Hart Interface Equipment focus on enhancing functionalities, improving reliability, and facilitating seamless integration with existing systems. The integration of advanced communication protocols, such as wireless technologies, is enhancing flexibility and reducing installation complexities. Miniaturization and improved power efficiency are key trends, leading to the development of compact and energy-efficient devices. These innovations cater to evolving market demands for enhanced performance, cost-effectiveness, and ease of use. New applications are emerging in the areas of smart field devices and predictive maintenance, contributing to the market's overall growth.
Report Segmentation & Scope
This report segments the Hart Interface Equipment market based on several factors including product type (e.g., transmitters, communication modules, etc.), application (e.g., process control, monitoring, etc.), and geography (North America, Europe, Asia Pacific, etc.). Each segment's market size, growth projections, and competitive dynamics are analyzed in detail. The report also incorporates a comprehensive competitive landscape analysis, focusing on key players and their market positions.
Key Drivers of Hart Interface Equipment Growth
The Hart Interface Equipment market's growth is primarily driven by several factors. Technological advancements leading to more sophisticated and efficient devices are a key driver. The growing adoption of industrial automation and the increasing demand for optimized process control across industries further fuel market growth. Favorable government policies and regulations promoting the adoption of advanced technologies in various sectors also contribute significantly.
Challenges in the Hart Interface Equipment Sector
The Hart Interface Equipment sector faces several challenges. The high initial investment costs associated with implementing HART-based systems can be a barrier to entry for some companies, particularly small and medium-sized enterprises (SMEs). The increasing complexity of integrated systems and the need for specialized expertise to operate and maintain them pose further challenges. Supply chain disruptions and fluctuations in raw material prices can also impact market dynamics and profitability. Competitive pressures from alternative communication protocols and the continuous evolution of technologies necessitate ongoing innovation and adaptation. These challenges can impede market growth, requiring careful consideration by industry stakeholders.
Leading Players in the Hart Interface Equipment Market
- Pepperl+Fuchs
- Emerson
- Knick International
- Fluke
- Analog Devices
- Rockwell Automation
- Softing Industrial Automation
- Tradinco
- GM International
- Beijing North Electronic Technology
Key Developments in Hart Interface Equipment Sector
- 2022 Q4: Emerson launched a new line of HART communication modules with enhanced security features.
- 2023 Q1: Pepperl+Fuchs announced a strategic partnership with a leading software provider to integrate HART data into cloud-based platforms.
- 2023 Q3: [Insert other key developments with dates and brief descriptions of their impact. Include at least 3-5 examples.]
Strategic Hart Interface Equipment Market Outlook
The Hart Interface Equipment market is poised for continued growth, driven by ongoing technological advancements, expanding industrial automation, and the increasing adoption of smart manufacturing practices across diverse industries. Strategic opportunities exist for companies to leverage the growing demand for enhanced process efficiency, improved safety, and reduced operational costs. Focusing on developing innovative solutions that address specific industry needs, particularly within high-growth sectors, will be key to achieving success in this dynamic market.
Hart Interface Equipment Segmentation
-
1. Application
- 1.1. Chemical Industry
- 1.2. Communication
- 1.3. Energy
- 1.4. Others
-
2. Type
- 2.1. Guide Rail Type
- 2.2. Master Format
Hart Interface Equipment Segmentation By Geography
-
1. North America
- 1.1. United States
- 1.2. Canada
- 1.3. Mexico
-
2. South America
- 2.1. Brazil
- 2.2. Argentina
- 2.3. Rest of South America
-
3. Europe
- 3.1. United Kingdom
- 3.2. Germany
- 3.3. France
- 3.4. Italy
- 3.5. Spain
- 3.6. Russia
- 3.7. Benelux
- 3.8. Nordics
- 3.9. Rest of Europe
-
4. Middle East & Africa
- 4.1. Turkey
- 4.2. Israel
- 4.3. GCC
- 4.4. North Africa
- 4.5. South Africa
- 4.6. Rest of Middle East & Africa
-
5. Asia Pacific
- 5.1. China
- 5.2. India
- 5.3. Japan
- 5.4. South Korea
- 5.5. ASEAN
- 5.6. Oceania
- 5.7. Rest of Asia Pacific
Hart Interface Equipment REPORT HIGHLIGHTS
| Aspects | Details |
|---|---|
| Study Period | 2019-2033 |
| Base Year | 2024 |
| Estimated Year | 2025 |
| Forecast Period | 2025-2033 |
| Historical Period | 2019-2024 |
| Growth Rate | CAGR of XXX% from 2019-2033 |
| Segmentation |
|
Table of Contents
- 1. Introduction
- 1.1. Research Scope
- 1.2. Market Segmentation
- 1.3. Research Methodology
- 1.4. Definitions and Assumptions
- 2. Executive Summary
- 2.1. Introduction
- 3. Market Dynamics
- 3.1. Introduction
- 3.2. Market Drivers
- 3.3. Market Restrains
- 3.4. Market Trends
- 4. Market Factor Analysis
- 4.1. Porters Five Forces
- 4.2. Supply/Value Chain
- 4.3. PESTEL analysis
- 4.4. Market Entropy
- 4.5. Patent/Trademark Analysis
- 5. Global Hart Interface Equipment Analysis, Insights and Forecast, 2019-2031
- 5.1. Market Analysis, Insights and Forecast - by Application
- 5.1.1. Chemical Industry
- 5.1.2. Communication
- 5.1.3. Energy
- 5.1.4. Others
- 5.2. Market Analysis, Insights and Forecast - by Type
- 5.2.1. Guide Rail Type
- 5.2.2. Master Format
- 5.3. Market Analysis, Insights and Forecast - by Region
- 5.3.1. North America
- 5.3.2. South America
- 5.3.3. Europe
- 5.3.4. Middle East & Africa
- 5.3.5. Asia Pacific
- 5.1. Market Analysis, Insights and Forecast - by Application
- 6. North America Hart Interface Equipment Analysis, Insights and Forecast, 2019-2031
- 6.1. Market Analysis, Insights and Forecast - by Application
- 6.1.1. Chemical Industry
- 6.1.2. Communication
- 6.1.3. Energy
- 6.1.4. Others
- 6.2. Market Analysis, Insights and Forecast - by Type
- 6.2.1. Guide Rail Type
- 6.2.2. Master Format
- 6.1. Market Analysis, Insights and Forecast - by Application
- 7. South America Hart Interface Equipment Analysis, Insights and Forecast, 2019-2031
- 7.1. Market Analysis, Insights and Forecast - by Application
- 7.1.1. Chemical Industry
- 7.1.2. Communication
- 7.1.3. Energy
- 7.1.4. Others
- 7.2. Market Analysis, Insights and Forecast - by Type
- 7.2.1. Guide Rail Type
- 7.2.2. Master Format
- 7.1. Market Analysis, Insights and Forecast - by Application
- 8. Europe Hart Interface Equipment Analysis, Insights and Forecast, 2019-2031
- 8.1. Market Analysis, Insights and Forecast - by Application
- 8.1.1. Chemical Industry
- 8.1.2. Communication
- 8.1.3. Energy
- 8.1.4. Others
- 8.2. Market Analysis, Insights and Forecast - by Type
- 8.2.1. Guide Rail Type
- 8.2.2. Master Format
- 8.1. Market Analysis, Insights and Forecast - by Application
- 9. Middle East & Africa Hart Interface Equipment Analysis, Insights and Forecast, 2019-2031
- 9.1. Market Analysis, Insights and Forecast - by Application
- 9.1.1. Chemical Industry
- 9.1.2. Communication
- 9.1.3. Energy
- 9.1.4. Others
- 9.2. Market Analysis, Insights and Forecast - by Type
- 9.2.1. Guide Rail Type
- 9.2.2. Master Format
- 9.1. Market Analysis, Insights and Forecast - by Application
- 10. Asia Pacific Hart Interface Equipment Analysis, Insights and Forecast, 2019-2031
- 10.1. Market Analysis, Insights and Forecast - by Application
- 10.1.1. Chemical Industry
- 10.1.2. Communication
- 10.1.3. Energy
- 10.1.4. Others
- 10.2. Market Analysis, Insights and Forecast - by Type
- 10.2.1. Guide Rail Type
- 10.2.2. Master Format
- 10.1. Market Analysis, Insights and Forecast - by Application
- 11. Competitive Analysis
- 11.1. Global Market Share Analysis 2024
- 11.2. Company Profiles
- 11.2.1 Pepperl+Fuchs
- 11.2.1.1. Overview
- 11.2.1.2. Products
- 11.2.1.3. SWOT Analysis
- 11.2.1.4. Recent Developments
- 11.2.1.5. Financials (Based on Availability)
- 11.2.2 Emerson
- 11.2.2.1. Overview
- 11.2.2.2. Products
- 11.2.2.3. SWOT Analysis
- 11.2.2.4. Recent Developments
- 11.2.2.5. Financials (Based on Availability)
- 11.2.3 Knick International
- 11.2.3.1. Overview
- 11.2.3.2. Products
- 11.2.3.3. SWOT Analysis
- 11.2.3.4. Recent Developments
- 11.2.3.5. Financials (Based on Availability)
- 11.2.4 Fluke
- 11.2.4.1. Overview
- 11.2.4.2. Products
- 11.2.4.3. SWOT Analysis
- 11.2.4.4. Recent Developments
- 11.2.4.5. Financials (Based on Availability)
- 11.2.5 Analog Devices
- 11.2.5.1. Overview
- 11.2.5.2. Products
- 11.2.5.3. SWOT Analysis
- 11.2.5.4. Recent Developments
- 11.2.5.5. Financials (Based on Availability)
- 11.2.6 Rockwell Automation
- 11.2.6.1. Overview
- 11.2.6.2. Products
- 11.2.6.3. SWOT Analysis
- 11.2.6.4. Recent Developments
- 11.2.6.5. Financials (Based on Availability)
- 11.2.7 Softing Industrial Automation
- 11.2.7.1. Overview
- 11.2.7.2. Products
- 11.2.7.3. SWOT Analysis
- 11.2.7.4. Recent Developments
- 11.2.7.5. Financials (Based on Availability)
- 11.2.8 Tradinco
- 11.2.8.1. Overview
- 11.2.8.2. Products
- 11.2.8.3. SWOT Analysis
- 11.2.8.4. Recent Developments
- 11.2.8.5. Financials (Based on Availability)
- 11.2.9 GM International
- 11.2.9.1. Overview
- 11.2.9.2. Products
- 11.2.9.3. SWOT Analysis
- 11.2.9.4. Recent Developments
- 11.2.9.5. Financials (Based on Availability)
- 11.2.10 Beijing North Electronic Technology
- 11.2.10.1. Overview
- 11.2.10.2. Products
- 11.2.10.3. SWOT Analysis
- 11.2.10.4. Recent Developments
- 11.2.10.5. Financials (Based on Availability)
- 11.2.1 Pepperl+Fuchs
List of Figures
- Figure 1: Global Hart Interface Equipment Revenue Breakdown (million, %) by Region 2024 & 2032
- Figure 2: Global Hart Interface Equipment Volume Breakdown (K, %) by Region 2024 & 2032
- Figure 3: North America Hart Interface Equipment Revenue (million), by Application 2024 & 2032
- Figure 4: North America Hart Interface Equipment Volume (K), by Application 2024 & 2032
- Figure 5: North America Hart Interface Equipment Revenue Share (%), by Application 2024 & 2032
- Figure 6: North America Hart Interface Equipment Volume Share (%), by Application 2024 & 2032
- Figure 7: North America Hart Interface Equipment Revenue (million), by Type 2024 & 2032
- Figure 8: North America Hart Interface Equipment Volume (K), by Type 2024 & 2032
- Figure 9: North America Hart Interface Equipment Revenue Share (%), by Type 2024 & 2032
- Figure 10: North America Hart Interface Equipment Volume Share (%), by Type 2024 & 2032
- Figure 11: North America Hart Interface Equipment Revenue (million), by Country 2024 & 2032
- Figure 12: North America Hart Interface Equipment Volume (K), by Country 2024 & 2032
- Figure 13: North America Hart Interface Equipment Revenue Share (%), by Country 2024 & 2032
- Figure 14: North America Hart Interface Equipment Volume Share (%), by Country 2024 & 2032
- Figure 15: South America Hart Interface Equipment Revenue (million), by Application 2024 & 2032
- Figure 16: South America Hart Interface Equipment Volume (K), by Application 2024 & 2032
- Figure 17: South America Hart Interface Equipment Revenue Share (%), by Application 2024 & 2032
- Figure 18: South America Hart Interface Equipment Volume Share (%), by Application 2024 & 2032
- Figure 19: South America Hart Interface Equipment Revenue (million), by Type 2024 & 2032
- Figure 20: South America Hart Interface Equipment Volume (K), by Type 2024 & 2032
- Figure 21: South America Hart Interface Equipment Revenue Share (%), by Type 2024 & 2032
- Figure 22: South America Hart Interface Equipment Volume Share (%), by Type 2024 & 2032
- Figure 23: South America Hart Interface Equipment Revenue (million), by Country 2024 & 2032
- Figure 24: South America Hart Interface Equipment Volume (K), by Country 2024 & 2032
- Figure 25: South America Hart Interface Equipment Revenue Share (%), by Country 2024 & 2032
- Figure 26: South America Hart Interface Equipment Volume Share (%), by Country 2024 & 2032
- Figure 27: Europe Hart Interface Equipment Revenue (million), by Application 2024 & 2032
- Figure 28: Europe Hart Interface Equipment Volume (K), by Application 2024 & 2032
- Figure 29: Europe Hart Interface Equipment Revenue Share (%), by Application 2024 & 2032
- Figure 30: Europe Hart Interface Equipment Volume Share (%), by Application 2024 & 2032
- Figure 31: Europe Hart Interface Equipment Revenue (million), by Type 2024 & 2032
- Figure 32: Europe Hart Interface Equipment Volume (K), by Type 2024 & 2032
- Figure 33: Europe Hart Interface Equipment Revenue Share (%), by Type 2024 & 2032
- Figure 34: Europe Hart Interface Equipment Volume Share (%), by Type 2024 & 2032
- Figure 35: Europe Hart Interface Equipment Revenue (million), by Country 2024 & 2032
- Figure 36: Europe Hart Interface Equipment Volume (K), by Country 2024 & 2032
- Figure 37: Europe Hart Interface Equipment Revenue Share (%), by Country 2024 & 2032
- Figure 38: Europe Hart Interface Equipment Volume Share (%), by Country 2024 & 2032
- Figure 39: Middle East & Africa Hart Interface Equipment Revenue (million), by Application 2024 & 2032
- Figure 40: Middle East & Africa Hart Interface Equipment Volume (K), by Application 2024 & 2032
- Figure 41: Middle East & Africa Hart Interface Equipment Revenue Share (%), by Application 2024 & 2032
- Figure 42: Middle East & Africa Hart Interface Equipment Volume Share (%), by Application 2024 & 2032
- Figure 43: Middle East & Africa Hart Interface Equipment Revenue (million), by Type 2024 & 2032
- Figure 44: Middle East & Africa Hart Interface Equipment Volume (K), by Type 2024 & 2032
- Figure 45: Middle East & Africa Hart Interface Equipment Revenue Share (%), by Type 2024 & 2032
- Figure 46: Middle East & Africa Hart Interface Equipment Volume Share (%), by Type 2024 & 2032
- Figure 47: Middle East & Africa Hart Interface Equipment Revenue (million), by Country 2024 & 2032
- Figure 48: Middle East & Africa Hart Interface Equipment Volume (K), by Country 2024 & 2032
- Figure 49: Middle East & Africa Hart Interface Equipment Revenue Share (%), by Country 2024 & 2032
- Figure 50: Middle East & Africa Hart Interface Equipment Volume Share (%), by Country 2024 & 2032
- Figure 51: Asia Pacific Hart Interface Equipment Revenue (million), by Application 2024 & 2032
- Figure 52: Asia Pacific Hart Interface Equipment Volume (K), by Application 2024 & 2032
- Figure 53: Asia Pacific Hart Interface Equipment Revenue Share (%), by Application 2024 & 2032
- Figure 54: Asia Pacific Hart Interface Equipment Volume Share (%), by Application 2024 & 2032
- Figure 55: Asia Pacific Hart Interface Equipment Revenue (million), by Type 2024 & 2032
- Figure 56: Asia Pacific Hart Interface Equipment Volume (K), by Type 2024 & 2032
- Figure 57: Asia Pacific Hart Interface Equipment Revenue Share (%), by Type 2024 & 2032
- Figure 58: Asia Pacific Hart Interface Equipment Volume Share (%), by Type 2024 & 2032
- Figure 59: Asia Pacific Hart Interface Equipment Revenue (million), by Country 2024 & 2032
- Figure 60: Asia Pacific Hart Interface Equipment Volume (K), by Country 2024 & 2032
- Figure 61: Asia Pacific Hart Interface Equipment Revenue Share (%), by Country 2024 & 2032
- Figure 62: Asia Pacific Hart Interface Equipment Volume Share (%), by Country 2024 & 2032
List of Tables
- Table 1: Global Hart Interface Equipment Revenue million Forecast, by Region 2019 & 2032
- Table 2: Global Hart Interface Equipment Volume K Forecast, by Region 2019 & 2032
- Table 3: Global Hart Interface Equipment Revenue million Forecast, by Application 2019 & 2032
- Table 4: Global Hart Interface Equipment Volume K Forecast, by Application 2019 & 2032
- Table 5: Global Hart Interface Equipment Revenue million Forecast, by Type 2019 & 2032
- Table 6: Global Hart Interface Equipment Volume K Forecast, by Type 2019 & 2032
- Table 7: Global Hart Interface Equipment Revenue million Forecast, by Region 2019 & 2032
- Table 8: Global Hart Interface Equipment Volume K Forecast, by Region 2019 & 2032
- Table 9: Global Hart Interface Equipment Revenue million Forecast, by Application 2019 & 2032
- Table 10: Global Hart Interface Equipment Volume K Forecast, by Application 2019 & 2032
- Table 11: Global Hart Interface Equipment Revenue million Forecast, by Type 2019 & 2032
- Table 12: Global Hart Interface Equipment Volume K Forecast, by Type 2019 & 2032
- Table 13: Global Hart Interface Equipment Revenue million Forecast, by Country 2019 & 2032
- Table 14: Global Hart Interface Equipment Volume K Forecast, by Country 2019 & 2032
- Table 15: United States Hart Interface Equipment Revenue (million) Forecast, by Application 2019 & 2032
- Table 16: United States Hart Interface Equipment Volume (K) Forecast, by Application 2019 & 2032
- Table 17: Canada Hart Interface Equipment Revenue (million) Forecast, by Application 2019 & 2032
- Table 18: Canada Hart Interface Equipment Volume (K) Forecast, by Application 2019 & 2032
- Table 19: Mexico Hart Interface Equipment Revenue (million) Forecast, by Application 2019 & 2032
- Table 20: Mexico Hart Interface Equipment Volume (K) Forecast, by Application 2019 & 2032
- Table 21: Global Hart Interface Equipment Revenue million Forecast, by Application 2019 & 2032
- Table 22: Global Hart Interface Equipment Volume K Forecast, by Application 2019 & 2032
- Table 23: Global Hart Interface Equipment Revenue million Forecast, by Type 2019 & 2032
- Table 24: Global Hart Interface Equipment Volume K Forecast, by Type 2019 & 2032
- Table 25: Global Hart Interface Equipment Revenue million Forecast, by Country 2019 & 2032
- Table 26: Global Hart Interface Equipment Volume K Forecast, by Country 2019 & 2032
- Table 27: Brazil Hart Interface Equipment Revenue (million) Forecast, by Application 2019 & 2032
- Table 28: Brazil Hart Interface Equipment Volume (K) Forecast, by Application 2019 & 2032
- Table 29: Argentina Hart Interface Equipment Revenue (million) Forecast, by Application 2019 & 2032
- Table 30: Argentina Hart Interface Equipment Volume (K) Forecast, by Application 2019 & 2032
- Table 31: Rest of South America Hart Interface Equipment Revenue (million) Forecast, by Application 2019 & 2032
- Table 32: Rest of South America Hart Interface Equipment Volume (K) Forecast, by Application 2019 & 2032
- Table 33: Global Hart Interface Equipment Revenue million Forecast, by Application 2019 & 2032
- Table 34: Global Hart Interface Equipment Volume K Forecast, by Application 2019 & 2032
- Table 35: Global Hart Interface Equipment Revenue million Forecast, by Type 2019 & 2032
- Table 36: Global Hart Interface Equipment Volume K Forecast, by Type 2019 & 2032
- Table 37: Global Hart Interface Equipment Revenue million Forecast, by Country 2019 & 2032
- Table 38: Global Hart Interface Equipment Volume K Forecast, by Country 2019 & 2032
- Table 39: United Kingdom Hart Interface Equipment Revenue (million) Forecast, by Application 2019 & 2032
- Table 40: United Kingdom Hart Interface Equipment Volume (K) Forecast, by Application 2019 & 2032
- Table 41: Germany Hart Interface Equipment Revenue (million) Forecast, by Application 2019 & 2032
- Table 42: Germany Hart Interface Equipment Volume (K) Forecast, by Application 2019 & 2032
- Table 43: France Hart Interface Equipment Revenue (million) Forecast, by Application 2019 & 2032
- Table 44: France Hart Interface Equipment Volume (K) Forecast, by Application 2019 & 2032
- Table 45: Italy Hart Interface Equipment Revenue (million) Forecast, by Application 2019 & 2032
- Table 46: Italy Hart Interface Equipment Volume (K) Forecast, by Application 2019 & 2032
- Table 47: Spain Hart Interface Equipment Revenue (million) Forecast, by Application 2019 & 2032
- Table 48: Spain Hart Interface Equipment Volume (K) Forecast, by Application 2019 & 2032
- Table 49: Russia Hart Interface Equipment Revenue (million) Forecast, by Application 2019 & 2032
- Table 50: Russia Hart Interface Equipment Volume (K) Forecast, by Application 2019 & 2032
- Table 51: Benelux Hart Interface Equipment Revenue (million) Forecast, by Application 2019 & 2032
- Table 52: Benelux Hart Interface Equipment Volume (K) Forecast, by Application 2019 & 2032
- Table 53: Nordics Hart Interface Equipment Revenue (million) Forecast, by Application 2019 & 2032
- Table 54: Nordics Hart Interface Equipment Volume (K) Forecast, by Application 2019 & 2032
- Table 55: Rest of Europe Hart Interface Equipment Revenue (million) Forecast, by Application 2019 & 2032
- Table 56: Rest of Europe Hart Interface Equipment Volume (K) Forecast, by Application 2019 & 2032
- Table 57: Global Hart Interface Equipment Revenue million Forecast, by Application 2019 & 2032
- Table 58: Global Hart Interface Equipment Volume K Forecast, by Application 2019 & 2032
- Table 59: Global Hart Interface Equipment Revenue million Forecast, by Type 2019 & 2032
- Table 60: Global Hart Interface Equipment Volume K Forecast, by Type 2019 & 2032
- Table 61: Global Hart Interface Equipment Revenue million Forecast, by Country 2019 & 2032
- Table 62: Global Hart Interface Equipment Volume K Forecast, by Country 2019 & 2032
- Table 63: Turkey Hart Interface Equipment Revenue (million) Forecast, by Application 2019 & 2032
- Table 64: Turkey Hart Interface Equipment Volume (K) Forecast, by Application 2019 & 2032
- Table 65: Israel Hart Interface Equipment Revenue (million) Forecast, by Application 2019 & 2032
- Table 66: Israel Hart Interface Equipment Volume (K) Forecast, by Application 2019 & 2032
- Table 67: GCC Hart Interface Equipment Revenue (million) Forecast, by Application 2019 & 2032
- Table 68: GCC Hart Interface Equipment Volume (K) Forecast, by Application 2019 & 2032
- Table 69: North Africa Hart Interface Equipment Revenue (million) Forecast, by Application 2019 & 2032
- Table 70: North Africa Hart Interface Equipment Volume (K) Forecast, by Application 2019 & 2032
- Table 71: South Africa Hart Interface Equipment Revenue (million) Forecast, by Application 2019 & 2032
- Table 72: South Africa Hart Interface Equipment Volume (K) Forecast, by Application 2019 & 2032
- Table 73: Rest of Middle East & Africa Hart Interface Equipment Revenue (million) Forecast, by Application 2019 & 2032
- Table 74: Rest of Middle East & Africa Hart Interface Equipment Volume (K) Forecast, by Application 2019 & 2032
- Table 75: Global Hart Interface Equipment Revenue million Forecast, by Application 2019 & 2032
- Table 76: Global Hart Interface Equipment Volume K Forecast, by Application 2019 & 2032
- Table 77: Global Hart Interface Equipment Revenue million Forecast, by Type 2019 & 2032
- Table 78: Global Hart Interface Equipment Volume K Forecast, by Type 2019 & 2032
- Table 79: Global Hart Interface Equipment Revenue million Forecast, by Country 2019 & 2032
- Table 80: Global Hart Interface Equipment Volume K Forecast, by Country 2019 & 2032
- Table 81: China Hart Interface Equipment Revenue (million) Forecast, by Application 2019 & 2032
- Table 82: China Hart Interface Equipment Volume (K) Forecast, by Application 2019 & 2032
- Table 83: India Hart Interface Equipment Revenue (million) Forecast, by Application 2019 & 2032
- Table 84: India Hart Interface Equipment Volume (K) Forecast, by Application 2019 & 2032
- Table 85: Japan Hart Interface Equipment Revenue (million) Forecast, by Application 2019 & 2032
- Table 86: Japan Hart Interface Equipment Volume (K) Forecast, by Application 2019 & 2032
- Table 87: South Korea Hart Interface Equipment Revenue (million) Forecast, by Application 2019 & 2032
- Table 88: South Korea Hart Interface Equipment Volume (K) Forecast, by Application 2019 & 2032
- Table 89: ASEAN Hart Interface Equipment Revenue (million) Forecast, by Application 2019 & 2032
- Table 90: ASEAN Hart Interface Equipment Volume (K) Forecast, by Application 2019 & 2032
- Table 91: Oceania Hart Interface Equipment Revenue (million) Forecast, by Application 2019 & 2032
- Table 92: Oceania Hart Interface Equipment Volume (K) Forecast, by Application 2019 & 2032
- Table 93: Rest of Asia Pacific Hart Interface Equipment Revenue (million) Forecast, by Application 2019 & 2032
- Table 94: Rest of Asia Pacific Hart Interface Equipment Volume (K) Forecast, by Application 2019 & 2032
Frequently Asked Questions
1. What is the projected Compound Annual Growth Rate (CAGR) of the Hart Interface Equipment?
The projected CAGR is approximately XXX%.
2. Which companies are prominent players in the Hart Interface Equipment?
Key companies in the market include Pepperl+Fuchs, Emerson, Knick International, Fluke, Analog Devices, Rockwell Automation, Softing Industrial Automation, Tradinco, GM International, Beijing North Electronic Technology.
3. What are the main segments of the Hart Interface Equipment?
The market segments include Application, Type.
4. Can you provide details about the market size?
The market size is estimated to be USD XXX million as of 2022.
5. What are some drivers contributing to market growth?
N/A
6. What are the notable trends driving market growth?
N/A
7. Are there any restraints impacting market growth?
N/A
8. Can you provide examples of recent developments in the market?
N/A
9. What pricing options are available for accessing the report?
Pricing options include single-user, multi-user, and enterprise licenses priced at USD 3950.00, USD 5925.00, and USD 7900.00 respectively.
10. Is the market size provided in terms of value or volume?
The market size is provided in terms of value, measured in million and volume, measured in K.
11. Are there any specific market keywords associated with the report?
Yes, the market keyword associated with the report is "Hart Interface Equipment," which aids in identifying and referencing the specific market segment covered.
12. How do I determine which pricing option suits my needs best?
The pricing options vary based on user requirements and access needs. Individual users may opt for single-user licenses, while businesses requiring broader access may choose multi-user or enterprise licenses for cost-effective access to the report.
13. Are there any additional resources or data provided in the Hart Interface Equipment report?
While the report offers comprehensive insights, it's advisable to review the specific contents or supplementary materials provided to ascertain if additional resources or data are available.
14. How can I stay updated on further developments or reports in the Hart Interface Equipment?
To stay informed about further developments, trends, and reports in the Hart Interface Equipment, consider subscribing to industry newsletters, following relevant companies and organizations, or regularly checking reputable industry news sources and publications.
Methodology
Step 1 - Identification of Relevant Samples Size from Population Database


Step 2 - Approaches for Defining Global Market Size (Value, Volume* & Price*)

Note*: In applicable scenarios
Step 3 - Data Sources
Primary Research
- Web Analytics
- Survey Reports
- Research Institute
- Latest Research Reports
- Opinion Leaders
Secondary Research
- Annual Reports
- White Paper
- Latest Press Release
- Industry Association
- Paid Database
- Investor Presentations

Step 4 - Data Triangulation
Involves using different sources of information in order to increase the validity of a study
These sources are likely to be stakeholders in a program - participants, other researchers, program staff, other community members, and so on.
Then we put all data in single framework & apply various statistical tools to find out the dynamic on the market.
During the analysis stage, feedback from the stakeholder groups would be compared to determine areas of agreement as well as areas of divergence


