
Key Insights
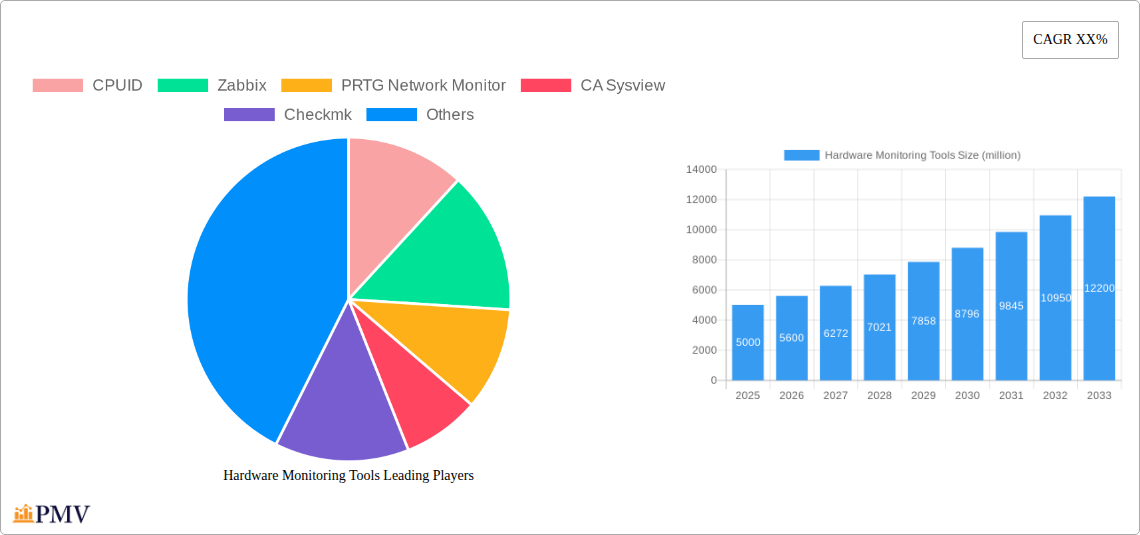
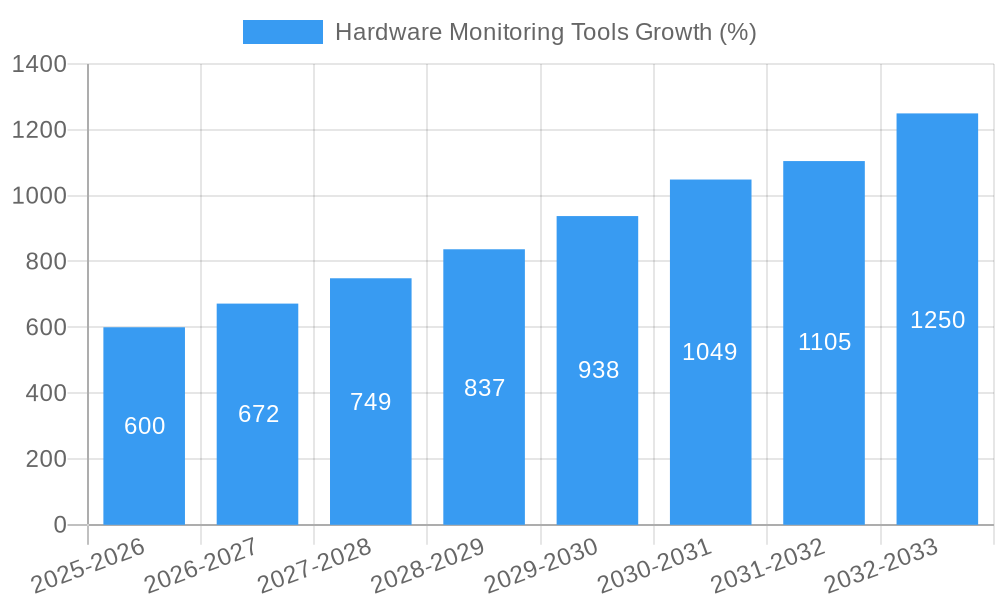
The global market for hardware monitoring tools is experiencing robust growth, driven by the increasing complexity of IT infrastructure and the rising demand for proactive system management. The market, estimated at $5 billion in 2025, is projected to exhibit a Compound Annual Growth Rate (CAGR) of 12% from 2025 to 2033, reaching approximately $12 billion by 2033. This expansion is fueled by several key factors. Firstly, the proliferation of cloud computing, big data analytics, and the Internet of Things (IoT) necessitates comprehensive hardware monitoring to ensure optimal performance, prevent outages, and maintain data integrity. Secondly, the adoption of advanced monitoring technologies, such as AI-powered predictive analytics and automated alert systems, is improving efficiency and reducing operational costs. Finally, stringent regulatory compliance requirements in sectors like finance and healthcare are driving the demand for robust and reliable hardware monitoring solutions. Leading vendors, including Splunk, IBM, ManageEngine, and others mentioned, are actively innovating to cater to this evolving landscape, offering diverse solutions ranging from basic hardware monitoring to sophisticated performance management suites.
However, market growth faces certain challenges. The high initial investment required for deploying comprehensive monitoring solutions can be a barrier to entry, particularly for small and medium-sized enterprises (SMEs). Furthermore, the complexity of integrating various monitoring tools within diverse IT environments can pose integration hurdles. Overcoming these challenges requires vendors to develop user-friendly, cost-effective solutions and to focus on seamless integration capabilities. The market is segmented by tool type (e.g., network monitoring, server monitoring, storage monitoring), deployment model (cloud, on-premise), and industry vertical (e.g., IT, finance, healthcare). Future growth will likely be driven by the increasing adoption of cloud-based monitoring solutions and the integration of advanced analytics for proactive problem identification and resolution. This will create opportunities for vendors who can provide scalable, secure, and intelligent hardware monitoring solutions that address the specific needs of different industries.
Hardware Monitoring Tools Market Report: 2019-2033
This comprehensive report provides a detailed analysis of the global Hardware Monitoring Tools market, offering invaluable insights for businesses, investors, and industry stakeholders. The study period covers 2019-2033, with a base year of 2025 and a forecast period of 2025-2033. The report projects a market value exceeding $xx million by 2033, exhibiting a Compound Annual Growth Rate (CAGR) of xx% during the forecast period. This in-depth analysis covers key market segments, competitive dynamics, technological advancements, and growth drivers, providing actionable intelligence to navigate the evolving landscape of hardware monitoring.
Hardware Monitoring Tools Market Structure & Competitive Dynamics
The global Hardware Monitoring Tools market is characterized by a moderately concentrated structure, with a handful of major players holding significant market share. In 2025, the top five companies—including CPUID, Zabbix, PRTG Network Monitor, Splunk, and ManageEngine—are estimated to account for approximately xx% of the total market value, exceeding $xx million. The market exhibits a dynamic innovation ecosystem, with continuous development of new tools and features driven by increasing demand for advanced monitoring capabilities.
Regulatory frameworks, including data privacy regulations like GDPR and CCPA, significantly influence market operations. Product substitutes, such as cloud-based monitoring solutions, present competitive challenges. End-user trends, particularly towards cloud adoption and the Internet of Things (IoT), are driving market expansion. M&A activity within the sector remains robust, with several significant deals valued at over $xx million in the recent historical period (2019-2024). These transactions have contributed to market consolidation and enhanced technological capabilities of leading players.
Hardware Monitoring Tools Industry Trends & Insights
The Hardware Monitoring Tools market experienced substantial growth in the historical period (2019-2024), driven by the rising adoption of cloud computing, the proliferation of IoT devices, and the increasing need for proactive system management. The market exhibited a CAGR of xx% during this period, reaching a value exceeding $xx million in 2024. Technological disruptions, such as the rise of AI-powered monitoring and the increasing use of machine learning for predictive maintenance, are reshaping the competitive landscape. Consumer preferences are shifting towards integrated solutions offering comprehensive monitoring and analysis capabilities, with a strong emphasis on user-friendly interfaces and real-time data visualization. The market penetration of advanced monitoring tools is expected to increase significantly in the forecast period, driven by growing awareness of the benefits of predictive maintenance and proactive risk management. The projected CAGR of xx% indicates strong growth potential, primarily fueled by increased IT spending across various sectors.
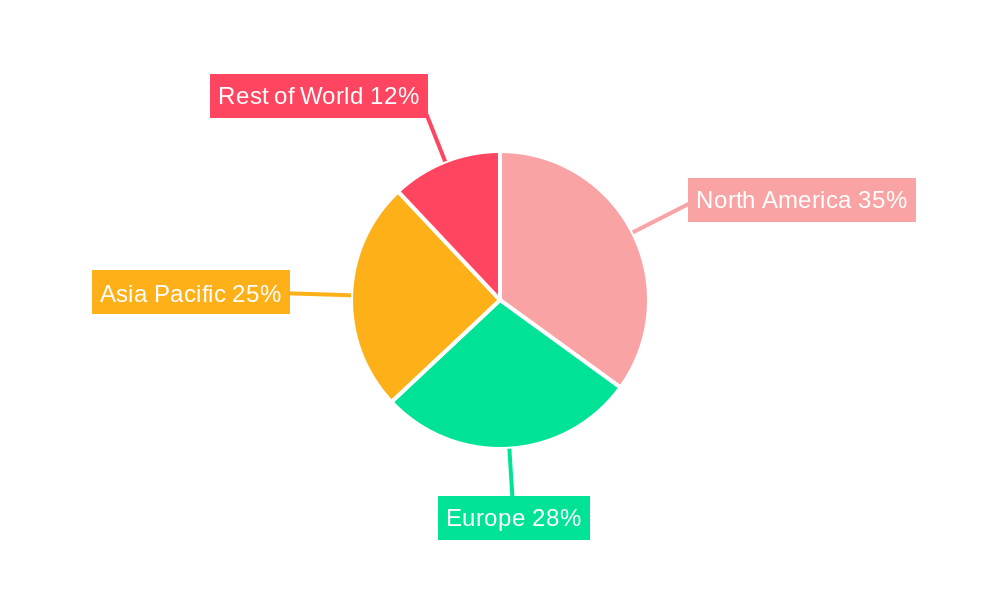
Dominant Markets & Segments in Hardware Monitoring Tools
North America currently holds the dominant position in the global Hardware Monitoring Tools market, accounting for approximately xx% of the total market value in 2025. This dominance is primarily attributed to the region's high concentration of technology companies, advanced IT infrastructure, and strong adoption of cloud-based solutions.
- Key Drivers in North America:
- Robust investment in IT infrastructure.
- High rate of cloud adoption.
- Stringent data security and compliance regulations.
- Well-established technology ecosystem.
Europe is also a significant market, exhibiting healthy growth, driven by increasing digital transformation initiatives across various industries. The Asia-Pacific region is projected to experience the fastest growth in the forecast period, primarily driven by expanding economies, increasing IT spending, and rising demand for advanced monitoring solutions.
Hardware Monitoring Tools Product Innovations
Recent innovations in Hardware Monitoring Tools include the integration of AI and machine learning for predictive analytics, enabling proactive identification of potential issues and optimization of system performance. The development of cloud-based solutions provides scalability, flexibility, and remote accessibility, while advancements in data visualization and user-friendly interfaces improve usability and enhance decision-making capabilities. These innovations cater to the growing demand for efficient, scalable, and intelligent monitoring systems across various industries.
Report Segmentation & Scope
This report segments the Hardware Monitoring Tools market based on several factors including deployment type (cloud, on-premise), organization size (small, medium, large enterprises), industry vertical (IT, telecom, healthcare, manufacturing, etc.), and geographic location. Each segment provides a detailed analysis of market size, growth projections, and competitive dynamics. The growth projections for each segment are based on various market influencing factors specific to that category.
Key Drivers of Hardware Monitoring Tools Growth
Several factors contribute to the growth of the Hardware Monitoring Tools market. The increasing adoption of cloud computing and IoT devices necessitates robust monitoring solutions. Furthermore, stringent data security and regulatory compliance requirements drive demand for advanced security and compliance monitoring tools. The increasing focus on proactive system management and predictive maintenance also promotes the adoption of these tools.
Challenges in the Hardware Monitoring Tools Sector
Challenges facing the Hardware Monitoring Tools sector include integrating diverse data sources, ensuring data security and privacy compliance, and managing the increasing complexity of IT infrastructures. Competition from both established and emerging players also puts pressure on margins. Supply chain disruptions can impact the availability and cost of hardware components, potentially affecting market growth.
Leading Players in the Hardware Monitoring Tools Market
- CPUID
- Zabbix
- PRTG Network Monitor
- CA Sysview
- Checkmk
- HWiNFO
- IBM i Server Suites
- ManageEngine
- Sematext
- Sensu
- SignalFx
- Splunk
- Wavefront
Key Developments in Hardware Monitoring Tools Sector
- 2022 Q4: Splunk acquired a smaller monitoring company, expanding its capabilities.
- 2023 Q1: Zabbix released a major update incorporating AI-powered anomaly detection.
- 2023 Q3: ManageEngine launched a new cloud-based monitoring platform.
- Further developments are expected throughout the forecast period.
Strategic Hardware Monitoring Tools Market Outlook
The Hardware Monitoring Tools market presents significant growth opportunities in the coming years, driven by increasing digitization across various industries and the growing need for proactive system management. Strategic focus on innovation, particularly in areas such as AI-powered analytics and cloud-based solutions, will be crucial for success. Companies must also address challenges related to data security, integration complexity, and competitive pressures to capture market share and maximize returns.
Hardware Monitoring Tools Segmentation
-
1. Application
- 1.1. Large Enterprises
- 1.2. SMEs
-
2. Types
- 2.1. Cloud Based
- 2.2. On-Premises
Hardware Monitoring Tools Segmentation By Geography
-
1. North America
- 1.1. United States
- 1.2. Canada
- 1.3. Mexico
-
2. South America
- 2.1. Brazil
- 2.2. Argentina
- 2.3. Rest of South America
-
3. Europe
- 3.1. United Kingdom
- 3.2. Germany
- 3.3. France
- 3.4. Italy
- 3.5. Spain
- 3.6. Russia
- 3.7. Benelux
- 3.8. Nordics
- 3.9. Rest of Europe
-
4. Middle East & Africa
- 4.1. Turkey
- 4.2. Israel
- 4.3. GCC
- 4.4. North Africa
- 4.5. South Africa
- 4.6. Rest of Middle East & Africa
-
5. Asia Pacific
- 5.1. China
- 5.2. India
- 5.3. Japan
- 5.4. South Korea
- 5.5. ASEAN
- 5.6. Oceania
- 5.7. Rest of Asia Pacific
Hardware Monitoring Tools REPORT HIGHLIGHTS
| Aspects | Details |
|---|---|
| Study Period | 2019-2033 |
| Base Year | 2024 |
| Estimated Year | 2025 |
| Forecast Period | 2025-2033 |
| Historical Period | 2019-2024 |
| Growth Rate | CAGR of XX% from 2019-2033 |
| Segmentation |
|
Table of Contents
- 1. Introduction
- 1.1. Research Scope
- 1.2. Market Segmentation
- 1.3. Research Methodology
- 1.4. Definitions and Assumptions
- 2. Executive Summary
- 2.1. Introduction
- 3. Market Dynamics
- 3.1. Introduction
- 3.2. Market Drivers
- 3.3. Market Restrains
- 3.4. Market Trends
- 4. Market Factor Analysis
- 4.1. Porters Five Forces
- 4.2. Supply/Value Chain
- 4.3. PESTEL analysis
- 4.4. Market Entropy
- 4.5. Patent/Trademark Analysis
- 5. Global Hardware Monitoring Tools Analysis, Insights and Forecast, 2019-2031
- 5.1. Market Analysis, Insights and Forecast - by Application
- 5.1.1. Large Enterprises
- 5.1.2. SMEs
- 5.2. Market Analysis, Insights and Forecast - by Types
- 5.2.1. Cloud Based
- 5.2.2. On-Premises
- 5.3. Market Analysis, Insights and Forecast - by Region
- 5.3.1. North America
- 5.3.2. South America
- 5.3.3. Europe
- 5.3.4. Middle East & Africa
- 5.3.5. Asia Pacific
- 5.1. Market Analysis, Insights and Forecast - by Application
- 6. North America Hardware Monitoring Tools Analysis, Insights and Forecast, 2019-2031
- 6.1. Market Analysis, Insights and Forecast - by Application
- 6.1.1. Large Enterprises
- 6.1.2. SMEs
- 6.2. Market Analysis, Insights and Forecast - by Types
- 6.2.1. Cloud Based
- 6.2.2. On-Premises
- 6.1. Market Analysis, Insights and Forecast - by Application
- 7. South America Hardware Monitoring Tools Analysis, Insights and Forecast, 2019-2031
- 7.1. Market Analysis, Insights and Forecast - by Application
- 7.1.1. Large Enterprises
- 7.1.2. SMEs
- 7.2. Market Analysis, Insights and Forecast - by Types
- 7.2.1. Cloud Based
- 7.2.2. On-Premises
- 7.1. Market Analysis, Insights and Forecast - by Application
- 8. Europe Hardware Monitoring Tools Analysis, Insights and Forecast, 2019-2031
- 8.1. Market Analysis, Insights and Forecast - by Application
- 8.1.1. Large Enterprises
- 8.1.2. SMEs
- 8.2. Market Analysis, Insights and Forecast - by Types
- 8.2.1. Cloud Based
- 8.2.2. On-Premises
- 8.1. Market Analysis, Insights and Forecast - by Application
- 9. Middle East & Africa Hardware Monitoring Tools Analysis, Insights and Forecast, 2019-2031
- 9.1. Market Analysis, Insights and Forecast - by Application
- 9.1.1. Large Enterprises
- 9.1.2. SMEs
- 9.2. Market Analysis, Insights and Forecast - by Types
- 9.2.1. Cloud Based
- 9.2.2. On-Premises
- 9.1. Market Analysis, Insights and Forecast - by Application
- 10. Asia Pacific Hardware Monitoring Tools Analysis, Insights and Forecast, 2019-2031
- 10.1. Market Analysis, Insights and Forecast - by Application
- 10.1.1. Large Enterprises
- 10.1.2. SMEs
- 10.2. Market Analysis, Insights and Forecast - by Types
- 10.2.1. Cloud Based
- 10.2.2. On-Premises
- 10.1. Market Analysis, Insights and Forecast - by Application
- 11. Competitive Analysis
- 11.1. Global Market Share Analysis 2024
- 11.2. Company Profiles
- 11.2.1 CPUID
- 11.2.1.1. Overview
- 11.2.1.2. Products
- 11.2.1.3. SWOT Analysis
- 11.2.1.4. Recent Developments
- 11.2.1.5. Financials (Based on Availability)
- 11.2.2 Zabbix
- 11.2.2.1. Overview
- 11.2.2.2. Products
- 11.2.2.3. SWOT Analysis
- 11.2.2.4. Recent Developments
- 11.2.2.5. Financials (Based on Availability)
- 11.2.3 PRTG Network Monitor
- 11.2.3.1. Overview
- 11.2.3.2. Products
- 11.2.3.3. SWOT Analysis
- 11.2.3.4. Recent Developments
- 11.2.3.5. Financials (Based on Availability)
- 11.2.4 CA Sysview
- 11.2.4.1. Overview
- 11.2.4.2. Products
- 11.2.4.3. SWOT Analysis
- 11.2.4.4. Recent Developments
- 11.2.4.5. Financials (Based on Availability)
- 11.2.5 Checkmk
- 11.2.5.1. Overview
- 11.2.5.2. Products
- 11.2.5.3. SWOT Analysis
- 11.2.5.4. Recent Developments
- 11.2.5.5. Financials (Based on Availability)
- 11.2.6 HWiNFO
- 11.2.6.1. Overview
- 11.2.6.2. Products
- 11.2.6.3. SWOT Analysis
- 11.2.6.4. Recent Developments
- 11.2.6.5. Financials (Based on Availability)
- 11.2.7 IBM i Server Suites
- 11.2.7.1. Overview
- 11.2.7.2. Products
- 11.2.7.3. SWOT Analysis
- 11.2.7.4. Recent Developments
- 11.2.7.5. Financials (Based on Availability)
- 11.2.8 ManageEngine
- 11.2.8.1. Overview
- 11.2.8.2. Products
- 11.2.8.3. SWOT Analysis
- 11.2.8.4. Recent Developments
- 11.2.8.5. Financials (Based on Availability)
- 11.2.9 Sematext
- 11.2.9.1. Overview
- 11.2.9.2. Products
- 11.2.9.3. SWOT Analysis
- 11.2.9.4. Recent Developments
- 11.2.9.5. Financials (Based on Availability)
- 11.2.10 Sensu
- 11.2.10.1. Overview
- 11.2.10.2. Products
- 11.2.10.3. SWOT Analysis
- 11.2.10.4. Recent Developments
- 11.2.10.5. Financials (Based on Availability)
- 11.2.11 SignalFx
- 11.2.11.1. Overview
- 11.2.11.2. Products
- 11.2.11.3. SWOT Analysis
- 11.2.11.4. Recent Developments
- 11.2.11.5. Financials (Based on Availability)
- 11.2.12 Splunk
- 11.2.12.1. Overview
- 11.2.12.2. Products
- 11.2.12.3. SWOT Analysis
- 11.2.12.4. Recent Developments
- 11.2.12.5. Financials (Based on Availability)
- 11.2.13 Wavefront
- 11.2.13.1. Overview
- 11.2.13.2. Products
- 11.2.13.3. SWOT Analysis
- 11.2.13.4. Recent Developments
- 11.2.13.5. Financials (Based on Availability)
- 11.2.1 CPUID
List of Figures
- Figure 1: Global Hardware Monitoring Tools Revenue Breakdown (million, %) by Region 2024 & 2032
- Figure 2: North America Hardware Monitoring Tools Revenue (million), by Application 2024 & 2032
- Figure 3: North America Hardware Monitoring Tools Revenue Share (%), by Application 2024 & 2032
- Figure 4: North America Hardware Monitoring Tools Revenue (million), by Types 2024 & 2032
- Figure 5: North America Hardware Monitoring Tools Revenue Share (%), by Types 2024 & 2032
- Figure 6: North America Hardware Monitoring Tools Revenue (million), by Country 2024 & 2032
- Figure 7: North America Hardware Monitoring Tools Revenue Share (%), by Country 2024 & 2032
- Figure 8: South America Hardware Monitoring Tools Revenue (million), by Application 2024 & 2032
- Figure 9: South America Hardware Monitoring Tools Revenue Share (%), by Application 2024 & 2032
- Figure 10: South America Hardware Monitoring Tools Revenue (million), by Types 2024 & 2032
- Figure 11: South America Hardware Monitoring Tools Revenue Share (%), by Types 2024 & 2032
- Figure 12: South America Hardware Monitoring Tools Revenue (million), by Country 2024 & 2032
- Figure 13: South America Hardware Monitoring Tools Revenue Share (%), by Country 2024 & 2032
- Figure 14: Europe Hardware Monitoring Tools Revenue (million), by Application 2024 & 2032
- Figure 15: Europe Hardware Monitoring Tools Revenue Share (%), by Application 2024 & 2032
- Figure 16: Europe Hardware Monitoring Tools Revenue (million), by Types 2024 & 2032
- Figure 17: Europe Hardware Monitoring Tools Revenue Share (%), by Types 2024 & 2032
- Figure 18: Europe Hardware Monitoring Tools Revenue (million), by Country 2024 & 2032
- Figure 19: Europe Hardware Monitoring Tools Revenue Share (%), by Country 2024 & 2032
- Figure 20: Middle East & Africa Hardware Monitoring Tools Revenue (million), by Application 2024 & 2032
- Figure 21: Middle East & Africa Hardware Monitoring Tools Revenue Share (%), by Application 2024 & 2032
- Figure 22: Middle East & Africa Hardware Monitoring Tools Revenue (million), by Types 2024 & 2032
- Figure 23: Middle East & Africa Hardware Monitoring Tools Revenue Share (%), by Types 2024 & 2032
- Figure 24: Middle East & Africa Hardware Monitoring Tools Revenue (million), by Country 2024 & 2032
- Figure 25: Middle East & Africa Hardware Monitoring Tools Revenue Share (%), by Country 2024 & 2032
- Figure 26: Asia Pacific Hardware Monitoring Tools Revenue (million), by Application 2024 & 2032
- Figure 27: Asia Pacific Hardware Monitoring Tools Revenue Share (%), by Application 2024 & 2032
- Figure 28: Asia Pacific Hardware Monitoring Tools Revenue (million), by Types 2024 & 2032
- Figure 29: Asia Pacific Hardware Monitoring Tools Revenue Share (%), by Types 2024 & 2032
- Figure 30: Asia Pacific Hardware Monitoring Tools Revenue (million), by Country 2024 & 2032
- Figure 31: Asia Pacific Hardware Monitoring Tools Revenue Share (%), by Country 2024 & 2032
List of Tables
- Table 1: Global Hardware Monitoring Tools Revenue million Forecast, by Region 2019 & 2032
- Table 2: Global Hardware Monitoring Tools Revenue million Forecast, by Application 2019 & 2032
- Table 3: Global Hardware Monitoring Tools Revenue million Forecast, by Types 2019 & 2032
- Table 4: Global Hardware Monitoring Tools Revenue million Forecast, by Region 2019 & 2032
- Table 5: Global Hardware Monitoring Tools Revenue million Forecast, by Application 2019 & 2032
- Table 6: Global Hardware Monitoring Tools Revenue million Forecast, by Types 2019 & 2032
- Table 7: Global Hardware Monitoring Tools Revenue million Forecast, by Country 2019 & 2032
- Table 8: United States Hardware Monitoring Tools Revenue (million) Forecast, by Application 2019 & 2032
- Table 9: Canada Hardware Monitoring Tools Revenue (million) Forecast, by Application 2019 & 2032
- Table 10: Mexico Hardware Monitoring Tools Revenue (million) Forecast, by Application 2019 & 2032
- Table 11: Global Hardware Monitoring Tools Revenue million Forecast, by Application 2019 & 2032
- Table 12: Global Hardware Monitoring Tools Revenue million Forecast, by Types 2019 & 2032
- Table 13: Global Hardware Monitoring Tools Revenue million Forecast, by Country 2019 & 2032
- Table 14: Brazil Hardware Monitoring Tools Revenue (million) Forecast, by Application 2019 & 2032
- Table 15: Argentina Hardware Monitoring Tools Revenue (million) Forecast, by Application 2019 & 2032
- Table 16: Rest of South America Hardware Monitoring Tools Revenue (million) Forecast, by Application 2019 & 2032
- Table 17: Global Hardware Monitoring Tools Revenue million Forecast, by Application 2019 & 2032
- Table 18: Global Hardware Monitoring Tools Revenue million Forecast, by Types 2019 & 2032
- Table 19: Global Hardware Monitoring Tools Revenue million Forecast, by Country 2019 & 2032
- Table 20: United Kingdom Hardware Monitoring Tools Revenue (million) Forecast, by Application 2019 & 2032
- Table 21: Germany Hardware Monitoring Tools Revenue (million) Forecast, by Application 2019 & 2032
- Table 22: France Hardware Monitoring Tools Revenue (million) Forecast, by Application 2019 & 2032
- Table 23: Italy Hardware Monitoring Tools Revenue (million) Forecast, by Application 2019 & 2032
- Table 24: Spain Hardware Monitoring Tools Revenue (million) Forecast, by Application 2019 & 2032
- Table 25: Russia Hardware Monitoring Tools Revenue (million) Forecast, by Application 2019 & 2032
- Table 26: Benelux Hardware Monitoring Tools Revenue (million) Forecast, by Application 2019 & 2032
- Table 27: Nordics Hardware Monitoring Tools Revenue (million) Forecast, by Application 2019 & 2032
- Table 28: Rest of Europe Hardware Monitoring Tools Revenue (million) Forecast, by Application 2019 & 2032
- Table 29: Global Hardware Monitoring Tools Revenue million Forecast, by Application 2019 & 2032
- Table 30: Global Hardware Monitoring Tools Revenue million Forecast, by Types 2019 & 2032
- Table 31: Global Hardware Monitoring Tools Revenue million Forecast, by Country 2019 & 2032
- Table 32: Turkey Hardware Monitoring Tools Revenue (million) Forecast, by Application 2019 & 2032
- Table 33: Israel Hardware Monitoring Tools Revenue (million) Forecast, by Application 2019 & 2032
- Table 34: GCC Hardware Monitoring Tools Revenue (million) Forecast, by Application 2019 & 2032
- Table 35: North Africa Hardware Monitoring Tools Revenue (million) Forecast, by Application 2019 & 2032
- Table 36: South Africa Hardware Monitoring Tools Revenue (million) Forecast, by Application 2019 & 2032
- Table 37: Rest of Middle East & Africa Hardware Monitoring Tools Revenue (million) Forecast, by Application 2019 & 2032
- Table 38: Global Hardware Monitoring Tools Revenue million Forecast, by Application 2019 & 2032
- Table 39: Global Hardware Monitoring Tools Revenue million Forecast, by Types 2019 & 2032
- Table 40: Global Hardware Monitoring Tools Revenue million Forecast, by Country 2019 & 2032
- Table 41: China Hardware Monitoring Tools Revenue (million) Forecast, by Application 2019 & 2032
- Table 42: India Hardware Monitoring Tools Revenue (million) Forecast, by Application 2019 & 2032
- Table 43: Japan Hardware Monitoring Tools Revenue (million) Forecast, by Application 2019 & 2032
- Table 44: South Korea Hardware Monitoring Tools Revenue (million) Forecast, by Application 2019 & 2032
- Table 45: ASEAN Hardware Monitoring Tools Revenue (million) Forecast, by Application 2019 & 2032
- Table 46: Oceania Hardware Monitoring Tools Revenue (million) Forecast, by Application 2019 & 2032
- Table 47: Rest of Asia Pacific Hardware Monitoring Tools Revenue (million) Forecast, by Application 2019 & 2032
Frequently Asked Questions
1. What is the projected Compound Annual Growth Rate (CAGR) of the Hardware Monitoring Tools?
The projected CAGR is approximately XX%.
2. Which companies are prominent players in the Hardware Monitoring Tools?
Key companies in the market include CPUID, Zabbix, PRTG Network Monitor, CA Sysview, Checkmk, HWiNFO, IBM i Server Suites, ManageEngine, Sematext, Sensu, SignalFx, Splunk, Wavefront.
3. What are the main segments of the Hardware Monitoring Tools?
The market segments include Application, Types.
4. Can you provide details about the market size?
The market size is estimated to be USD XXX million as of 2022.
5. What are some drivers contributing to market growth?
N/A
6. What are the notable trends driving market growth?
N/A
7. Are there any restraints impacting market growth?
N/A
8. Can you provide examples of recent developments in the market?
N/A
9. What pricing options are available for accessing the report?
Pricing options include single-user, multi-user, and enterprise licenses priced at USD 3350.00, USD 5025.00, and USD 6700.00 respectively.
10. Is the market size provided in terms of value or volume?
The market size is provided in terms of value, measured in million.
11. Are there any specific market keywords associated with the report?
Yes, the market keyword associated with the report is "Hardware Monitoring Tools," which aids in identifying and referencing the specific market segment covered.
12. How do I determine which pricing option suits my needs best?
The pricing options vary based on user requirements and access needs. Individual users may opt for single-user licenses, while businesses requiring broader access may choose multi-user or enterprise licenses for cost-effective access to the report.
13. Are there any additional resources or data provided in the Hardware Monitoring Tools report?
While the report offers comprehensive insights, it's advisable to review the specific contents or supplementary materials provided to ascertain if additional resources or data are available.
14. How can I stay updated on further developments or reports in the Hardware Monitoring Tools?
To stay informed about further developments, trends, and reports in the Hardware Monitoring Tools, consider subscribing to industry newsletters, following relevant companies and organizations, or regularly checking reputable industry news sources and publications.
Methodology
Step 1 - Identification of Relevant Samples Size from Population Database


Step 2 - Approaches for Defining Global Market Size (Value, Volume* & Price*)

Note*: In applicable scenarios
Step 3 - Data Sources
Primary Research
- Web Analytics
- Survey Reports
- Research Institute
- Latest Research Reports
- Opinion Leaders
Secondary Research
- Annual Reports
- White Paper
- Latest Press Release
- Industry Association
- Paid Database
- Investor Presentations

Step 4 - Data Triangulation
Involves using different sources of information in order to increase the validity of a study
These sources are likely to be stakeholders in a program - participants, other researchers, program staff, other community members, and so on.
Then we put all data in single framework & apply various statistical tools to find out the dynamic on the market.
During the analysis stage, feedback from the stakeholder groups would be compared to determine areas of agreement as well as areas of divergence


