
Key Insights
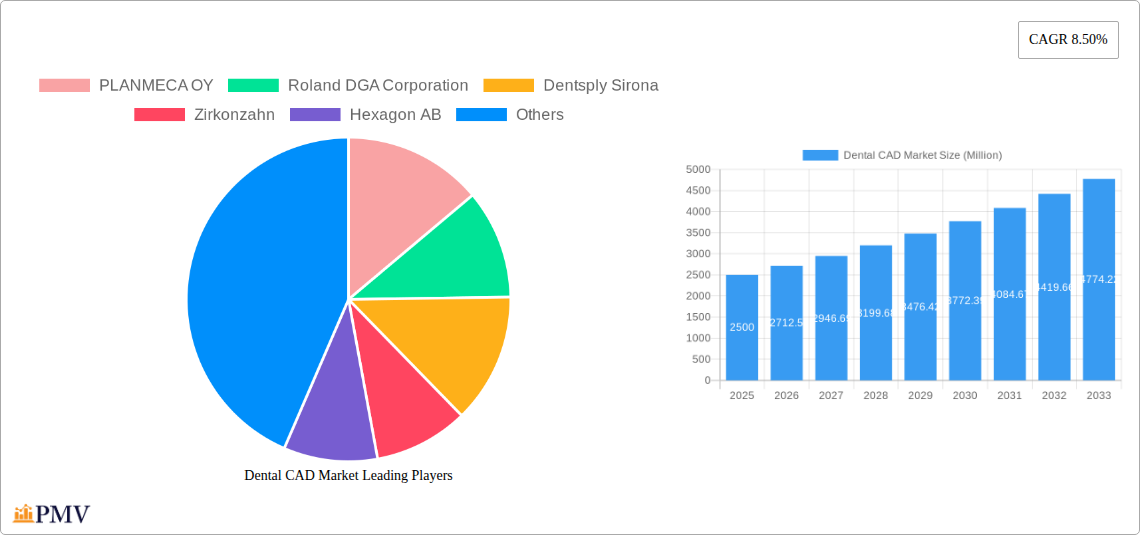
The global dental CAD market is experiencing robust growth, projected to reach a substantial size driven by several key factors. The increasing prevalence of dental procedures, coupled with the rising demand for aesthetically pleasing and precise restorations, fuels the adoption of CAD/CAM technology. This technology offers significant advantages over traditional methods, including improved accuracy, reduced treatment time, and enhanced patient comfort. The market's expansion is further propelled by technological advancements, such as the development of more efficient and user-friendly software, and the integration of artificial intelligence for improved diagnosis and treatment planning. Specific application segments, like dental prosthetics and implants, are witnessing particularly strong growth as dentists increasingly embrace digital workflows. The market is also geographically diverse, with North America and Europe currently holding significant market share, while the Asia-Pacific region exhibits high growth potential due to increasing dental awareness and healthcare infrastructure development. Competitive landscape is shaped by established players like Planmeca, Dentsply Sirona, and 3Shape, along with emerging companies offering innovative solutions. However, high initial investment costs associated with CAD/CAM systems and the need for specialized training can pose challenges to market penetration, particularly in developing economies.
Despite these restraints, the long-term outlook for the dental CAD market remains positive. The ongoing trend towards minimally invasive dentistry, coupled with the increasing affordability of CAD/CAM systems and the expanding availability of skilled professionals, is expected to drive substantial market expansion in the coming years. The integration of advanced materials, such as zirconia and lithium disilicate, into CAD/CAM workflows further enhances the quality and durability of dental restorations, contributing to higher patient satisfaction and increased market demand. Furthermore, the continuous innovation in software and hardware, including the development of chairside CAD/CAM solutions and cloud-based platforms, will streamline workflows and improve efficiency within dental practices globally, driving market growth throughout the forecast period. Strategic partnerships and acquisitions among market players are also likely to accelerate innovation and market consolidation.
Dental CAD Market: A Comprehensive Report (2019-2033)
This in-depth report provides a comprehensive analysis of the Dental CAD market, covering market size, growth projections, competitive landscape, and key industry trends from 2019 to 2033. The study period spans 2019-2033, with 2025 as the base and estimated year, and a forecast period of 2025-2033. The historical period analyzed is 2019-2024. The report offers actionable insights for stakeholders in the dental CAD/CAM industry, including manufacturers, suppliers, distributors, and investors. The market is segmented by component (scanners, milling machines, software, other components) and application (dental prosthesis, dental implants), providing a granular understanding of market dynamics. Key players like PLANMECA OY, Dentsply Sirona, and 3Shape are profiled, highlighting their market share, competitive strategies, and recent developments. The report's value surpasses xx Million, providing a robust foundation for informed decision-making.
Dental CAD Market Market Structure & Competitive Dynamics
The Dental CAD market exhibits a moderately concentrated structure, with a handful of major players holding significant market share. The market's competitive dynamics are characterized by intense rivalry, fueled by continuous product innovation, strategic partnerships, and mergers and acquisitions (M&A) activity. Several factors shape this competitive landscape:
Market Concentration: The top five players, including PLANMECA OY, Dentsply Sirona, and 3Shape, account for approximately xx% of the global market share in 2025. This concentration is driven by significant investments in R&D, robust distribution networks, and strong brand recognition.
Innovation Ecosystems: The dental CAD market is highly innovative, with companies continuously developing advanced scanners, milling machines, and software solutions. Collaboration between technology providers and dental professionals is crucial in driving innovation and shaping product features.
Regulatory Frameworks: Regulatory bodies play a vital role in ensuring the safety and efficacy of dental CAD/CAM products. Compliance with relevant standards and regulations is crucial for market entry and sustained growth. These regulations vary by region, impacting the competitive dynamics.
Product Substitutes: While digital dentistry is rapidly gaining traction, traditional methods still exist. The cost-effectiveness and accessibility of traditional techniques present a competitive challenge to CAD/CAM adoption.
End-User Trends: The increasing adoption of minimally invasive procedures, preference for aesthetic restorations, and improved patient outcomes are fueling the demand for advanced CAD/CAM technologies.
M&A Activities: The Dental CAD market has witnessed significant M&A activities in recent years. These activities have reshaped the competitive landscape, creating larger entities with expanded product portfolios and geographic reach. The total value of M&A deals in the past five years is estimated at xx Million.
Dental CAD Market Industry Trends & Insights
The Dental CAD market is experiencing robust growth, driven by several key trends:
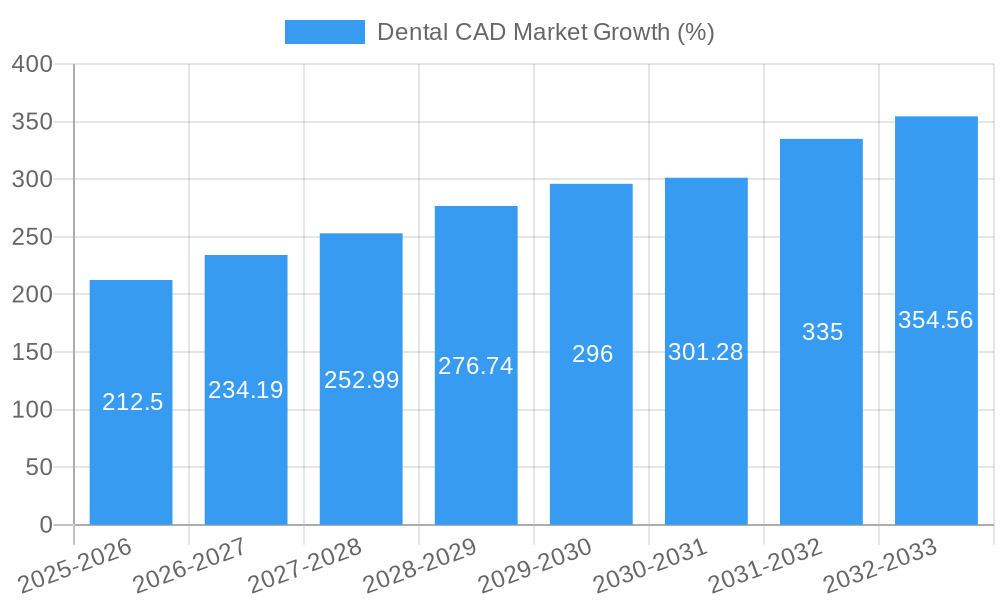
The market is projected to witness a Compound Annual Growth Rate (CAGR) of xx% during the forecast period (2025-2033). This growth is fueled by several factors, including the rising adoption of digital dentistry workflows, technological advancements, improved accuracy and efficiency of CAD/CAM systems, and increasing demand for aesthetically pleasing and durable restorations. Consumer preferences are shifting towards minimally invasive and technologically advanced treatments, further accelerating the market's expansion.
Technological disruptions are transforming the landscape, with the introduction of artificial intelligence (AI)-powered design software, improved intraoral scanners, and high-speed milling machines. The market penetration of CAD/CAM systems is growing steadily, with a significant increase observed in recent years, especially in developed regions. However, the high initial investment costs and the need for specialized training remain as challenges. The competitive dynamics are shaping the market's evolution, with established players focusing on innovation and expansion, while new entrants strive to capture market share through disruptive technologies and cost-effective solutions.
Dominant Markets & Segments in Dental CAD Market
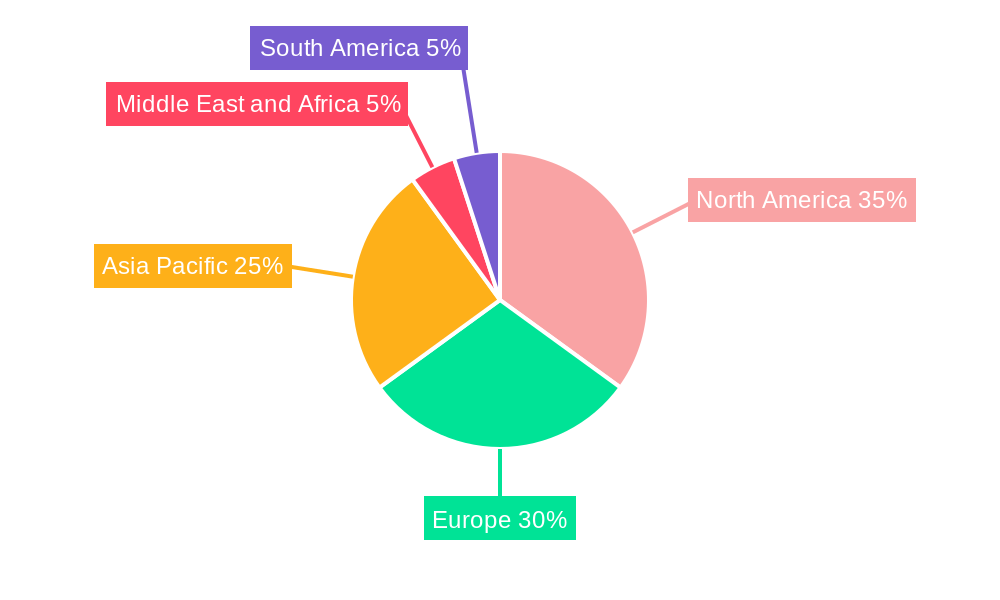
North America currently holds the largest market share in the Dental CAD market, driven by high adoption rates, advanced healthcare infrastructure, and substantial investments in dental technology. Europe follows as a significant market, characterized by a robust healthcare system and a growing awareness of digital dentistry.
Key Drivers of Market Dominance:
- North America: High disposable incomes, advanced dental practices, and early adoption of CAD/CAM technologies contribute significantly to its dominance.
- Europe: Stringent regulatory frameworks ensuring high-quality dental care coupled with a technologically advanced healthcare infrastructure support substantial market growth.
- Asia-Pacific: Rapidly expanding healthcare infrastructure and a growing middle class with increased disposable incomes are driving increasing demand.
Segment Dominance:
- By Component: The software segment is expected to hold the largest market share due to continuous innovation and integration with other CAD/CAM components. The scanners segment is also expected to witness high growth due to advancements in imaging technology.
- By Application: The dental prosthesis segment currently dominates, owing to its wide range of applications and established use in dental practices. The dental implant segment is projected to grow significantly in the forecast period, driven by increasing demand for advanced implant solutions.
Dental CAD Market Product Innovations
Recent product innovations focus on improving accuracy, speed, ease of use, and integration capabilities. Advanced intraoral scanners offer improved image quality and faster scanning speeds. Milling machines are becoming more efficient and precise, while software solutions are increasingly integrating AI and machine learning for streamlined workflows. These innovations cater to the growing demand for efficient, accurate, and aesthetically pleasing restorations, enhancing the competitive advantage of manufacturers.
Report Segmentation & Scope
The report segments the Dental CAD market comprehensively:
By Component:
- Scanners: This segment is projected to grow at a xx% CAGR due to increased demand for accurate and efficient digital impression capturing. Competitive dynamics are shaped by innovation in imaging technology and integration capabilities.
- Milling Machines: This segment is expected to witness a CAGR of xx%, driven by advancements in milling speed, precision, and material compatibility. Competition is centered around productivity, accuracy, and cost-effectiveness.
- Software: The software segment, projected to grow at a xx% CAGR, is crucial due to its role in design, simulation, and manufacturing process optimization. Competition focuses on user-friendliness, advanced design features, and integration with other systems.
- Other Components: This segment includes accessories and consumables essential for the CAD/CAM workflow.
By Application:
- Dental Prosthesis: This segment, with a projected CAGR of xx%, will continue to be a major driver of market growth. Competition is based on aesthetics, strength, and biocompatibility of materials.
- Dental Implants: The dental implant segment is anticipated to experience a CAGR of xx% due to increased adoption of implant-supported restorations. Competition is fierce, emphasizing accuracy, speed, and integration with implant systems.
Key Drivers of Dental CAD Market Growth
Several factors drive the growth of the Dental CAD market:
- Technological Advancements: Improvements in intraoral scanners, milling machines, and software enhance accuracy, speed, and efficiency.
- Growing Adoption of Digital Dentistry: The shift from traditional methods to digital workflows boosts market demand.
- Favorable Regulatory Environment: Supportive regulatory frameworks facilitate market expansion.
- Rising Disposable Incomes: Increased spending on healthcare contributes to higher market demand.
Challenges in the Dental CAD Market Sector
The Dental CAD market faces several challenges:
- High Initial Investment Costs: The high cost of equipment can deter some dental practices from adopting CAD/CAM technology.
- Need for Specialized Training: Dental professionals require training to operate and utilize CAD/CAM systems effectively.
- Integration Challenges: Seamless integration between different CAD/CAM components and existing dental practice workflows can be complex.
Leading Players in the Dental CAD Market Market
- PLANMECA OY
- Roland DGA Corporation
- Dentsply Sirona
- Zirkonzahn
- Hexagon AB
- Kelkar Dynamics LLP
- Amann Girrbach AG
- Carestream Dental LLC
- 3Shape
- Align Technology Inc
- Envista Holdings Corporation
- Datron AG
- Institut Straumann AG
- ZimVie Inc
Key Developments in Dental CAD Market Sector
- September 2022: Planmeca launched a new software module for Planmeca Romexis, simplifying digital impression workflows.
- April 2022: Dentsply Sirona released inLab Software 22.0, featuring a harmonized user interface and expanded design options.
Strategic Dental CAD Market Market Outlook
The Dental CAD market presents significant growth potential driven by technological advancements, increasing adoption of digital dentistry, and favorable regulatory environments. Strategic opportunities lie in developing innovative products, expanding into emerging markets, and fostering collaborations to enhance market penetration. The focus on user-friendly software, cost-effective solutions, and comprehensive training programs will play a vital role in shaping the future of this dynamic market.
Dental CAD Market Segmentation
-
1. Component
- 1.1. Scanners
- 1.2. Milling Machines
- 1.3. Software
- 1.4. Other Components
-
2. Application
- 2.1. Dental Prosthesis
- 2.2. Dental Implants
Dental CAD Market Segmentation By Geography
-
1. North America
- 1.1. United States
- 1.2. Canada
- 1.3. Mexico
-
2. Europe
- 2.1. Germany
- 2.2. United Kingdom
- 2.3. France
- 2.4. Italy
- 2.5. Spain
- 2.6. Rest of Europe
-
3. Asia Pacific
- 3.1. China
- 3.2. Japan
- 3.3. India
- 3.4. Australia
- 3.5. South Korea
- 3.6. Rest of Asia Pacific
-
4. Middle East and Africa
- 4.1. GCC
- 4.2. South Africa
- 4.3. Rest of Middle East and Africa
-
5. South America
- 5.1. Brazil
- 5.2. Argentina
- 5.3. Rest of South America
Dental CAD Market REPORT HIGHLIGHTS
| Aspects | Details |
|---|---|
| Study Period | 2019-2033 |
| Base Year | 2024 |
| Estimated Year | 2025 |
| Forecast Period | 2025-2033 |
| Historical Period | 2019-2024 |
| Growth Rate | CAGR of 8.50% from 2019-2033 |
| Segmentation |
|
Table of Contents
- 1. Introduction
- 1.1. Research Scope
- 1.2. Market Segmentation
- 1.3. Research Methodology
- 1.4. Definitions and Assumptions
- 2. Executive Summary
- 2.1. Introduction
- 3. Market Dynamics
- 3.1. Introduction
- 3.2. Market Drivers
- 3.2.1. Increasing Burden of Oral Diseases And Ageing Population; Technological Advancements in Dental Imaging Methodologies
- 3.3. Market Restrains
- 3.3.1. Excessive Costs Involved in Private Health Insurance
- 3.4. Market Trends
- 3.4.1. The Scanners Segment is Expected to Hold Significant Share in Dental CAD Market Over the Forecast Period
- 4. Market Factor Analysis
- 4.1. Porters Five Forces
- 4.2. Supply/Value Chain
- 4.3. PESTEL analysis
- 4.4. Market Entropy
- 4.5. Patent/Trademark Analysis
- 5. Global Dental CAD Market Analysis, Insights and Forecast, 2019-2031
- 5.1. Market Analysis, Insights and Forecast - by Component
- 5.1.1. Scanners
- 5.1.2. Milling Machines
- 5.1.3. Software
- 5.1.4. Other Components
- 5.2. Market Analysis, Insights and Forecast - by Application
- 5.2.1. Dental Prosthesis
- 5.2.2. Dental Implants
- 5.3. Market Analysis, Insights and Forecast - by Region
- 5.3.1. North America
- 5.3.2. Europe
- 5.3.3. Asia Pacific
- 5.3.4. Middle East and Africa
- 5.3.5. South America
- 5.1. Market Analysis, Insights and Forecast - by Component
- 6. North America Dental CAD Market Analysis, Insights and Forecast, 2019-2031
- 6.1. Market Analysis, Insights and Forecast - by Component
- 6.1.1. Scanners
- 6.1.2. Milling Machines
- 6.1.3. Software
- 6.1.4. Other Components
- 6.2. Market Analysis, Insights and Forecast - by Application
- 6.2.1. Dental Prosthesis
- 6.2.2. Dental Implants
- 6.1. Market Analysis, Insights and Forecast - by Component
- 7. Europe Dental CAD Market Analysis, Insights and Forecast, 2019-2031
- 7.1. Market Analysis, Insights and Forecast - by Component
- 7.1.1. Scanners
- 7.1.2. Milling Machines
- 7.1.3. Software
- 7.1.4. Other Components
- 7.2. Market Analysis, Insights and Forecast - by Application
- 7.2.1. Dental Prosthesis
- 7.2.2. Dental Implants
- 7.1. Market Analysis, Insights and Forecast - by Component
- 8. Asia Pacific Dental CAD Market Analysis, Insights and Forecast, 2019-2031
- 8.1. Market Analysis, Insights and Forecast - by Component
- 8.1.1. Scanners
- 8.1.2. Milling Machines
- 8.1.3. Software
- 8.1.4. Other Components
- 8.2. Market Analysis, Insights and Forecast - by Application
- 8.2.1. Dental Prosthesis
- 8.2.2. Dental Implants
- 8.1. Market Analysis, Insights and Forecast - by Component
- 9. Middle East and Africa Dental CAD Market Analysis, Insights and Forecast, 2019-2031
- 9.1. Market Analysis, Insights and Forecast - by Component
- 9.1.1. Scanners
- 9.1.2. Milling Machines
- 9.1.3. Software
- 9.1.4. Other Components
- 9.2. Market Analysis, Insights and Forecast - by Application
- 9.2.1. Dental Prosthesis
- 9.2.2. Dental Implants
- 9.1. Market Analysis, Insights and Forecast - by Component
- 10. South America Dental CAD Market Analysis, Insights and Forecast, 2019-2031
- 10.1. Market Analysis, Insights and Forecast - by Component
- 10.1.1. Scanners
- 10.1.2. Milling Machines
- 10.1.3. Software
- 10.1.4. Other Components
- 10.2. Market Analysis, Insights and Forecast - by Application
- 10.2.1. Dental Prosthesis
- 10.2.2. Dental Implants
- 10.1. Market Analysis, Insights and Forecast - by Component
- 11. North America Dental CAD Market Analysis, Insights and Forecast, 2019-2031
- 11.1. Market Analysis, Insights and Forecast - By Country/Sub-region
- 11.1.1 United States
- 11.1.2 Canada
- 11.1.3 Mexico
- 12. Europe Dental CAD Market Analysis, Insights and Forecast, 2019-2031
- 12.1. Market Analysis, Insights and Forecast - By Country/Sub-region
- 12.1.1 Germany
- 12.1.2 United Kingdom
- 12.1.3 France
- 12.1.4 Italy
- 12.1.5 Spain
- 12.1.6 Rest of Europe
- 13. Asia Pacific Dental CAD Market Analysis, Insights and Forecast, 2019-2031
- 13.1. Market Analysis, Insights and Forecast - By Country/Sub-region
- 13.1.1 China
- 13.1.2 Japan
- 13.1.3 India
- 13.1.4 Australia
- 13.1.5 South Korea
- 13.1.6 Rest of Asia Pacific
- 14. Middle East and Africa Dental CAD Market Analysis, Insights and Forecast, 2019-2031
- 14.1. Market Analysis, Insights and Forecast - By Country/Sub-region
- 14.1.1 GCC
- 14.1.2 South Africa
- 14.1.3 Rest of Middle East and Africa
- 15. South America Dental CAD Market Analysis, Insights and Forecast, 2019-2031
- 15.1. Market Analysis, Insights and Forecast - By Country/Sub-region
- 15.1.1 Brazil
- 15.1.2 Argentina
- 15.1.3 Rest of South America
- 16. Competitive Analysis
- 16.1. Global Market Share Analysis 2024
- 16.2. Company Profiles
- 16.2.1 PLANMECA OY
- 16.2.1.1. Overview
- 16.2.1.2. Products
- 16.2.1.3. SWOT Analysis
- 16.2.1.4. Recent Developments
- 16.2.1.5. Financials (Based on Availability)
- 16.2.2 Roland DGA Corporation
- 16.2.2.1. Overview
- 16.2.2.2. Products
- 16.2.2.3. SWOT Analysis
- 16.2.2.4. Recent Developments
- 16.2.2.5. Financials (Based on Availability)
- 16.2.3 Dentsply Sirona
- 16.2.3.1. Overview
- 16.2.3.2. Products
- 16.2.3.3. SWOT Analysis
- 16.2.3.4. Recent Developments
- 16.2.3.5. Financials (Based on Availability)
- 16.2.4 Zirkonzahn
- 16.2.4.1. Overview
- 16.2.4.2. Products
- 16.2.4.3. SWOT Analysis
- 16.2.4.4. Recent Developments
- 16.2.4.5. Financials (Based on Availability)
- 16.2.5 Hexagon AB
- 16.2.5.1. Overview
- 16.2.5.2. Products
- 16.2.5.3. SWOT Analysis
- 16.2.5.4. Recent Developments
- 16.2.5.5. Financials (Based on Availability)
- 16.2.6 Kelkar Dynamics LLP
- 16.2.6.1. Overview
- 16.2.6.2. Products
- 16.2.6.3. SWOT Analysis
- 16.2.6.4. Recent Developments
- 16.2.6.5. Financials (Based on Availability)
- 16.2.7 Amann Girrbach AG
- 16.2.7.1. Overview
- 16.2.7.2. Products
- 16.2.7.3. SWOT Analysis
- 16.2.7.4. Recent Developments
- 16.2.7.5. Financials (Based on Availability)
- 16.2.8 Carestream Dental LLC
- 16.2.8.1. Overview
- 16.2.8.2. Products
- 16.2.8.3. SWOT Analysis
- 16.2.8.4. Recent Developments
- 16.2.8.5. Financials (Based on Availability)
- 16.2.9 3Shape
- 16.2.9.1. Overview
- 16.2.9.2. Products
- 16.2.9.3. SWOT Analysis
- 16.2.9.4. Recent Developments
- 16.2.9.5. Financials (Based on Availability)
- 16.2.10 Align Technology Inc
- 16.2.10.1. Overview
- 16.2.10.2. Products
- 16.2.10.3. SWOT Analysis
- 16.2.10.4. Recent Developments
- 16.2.10.5. Financials (Based on Availability)
- 16.2.11 Envista Holdings Corporation
- 16.2.11.1. Overview
- 16.2.11.2. Products
- 16.2.11.3. SWOT Analysis
- 16.2.11.4. Recent Developments
- 16.2.11.5. Financials (Based on Availability)
- 16.2.12 Datron AG
- 16.2.12.1. Overview
- 16.2.12.2. Products
- 16.2.12.3. SWOT Analysis
- 16.2.12.4. Recent Developments
- 16.2.12.5. Financials (Based on Availability)
- 16.2.13 Institut Straumann AG
- 16.2.13.1. Overview
- 16.2.13.2. Products
- 16.2.13.3. SWOT Analysis
- 16.2.13.4. Recent Developments
- 16.2.13.5. Financials (Based on Availability)
- 16.2.14 ZimVie Inc
- 16.2.14.1. Overview
- 16.2.14.2. Products
- 16.2.14.3. SWOT Analysis
- 16.2.14.4. Recent Developments
- 16.2.14.5. Financials (Based on Availability)
- 16.2.1 PLANMECA OY
List of Figures
- Figure 1: Global Dental CAD Market Revenue Breakdown (Million, %) by Region 2024 & 2032
- Figure 2: Global Dental CAD Market Volume Breakdown (K Unit, %) by Region 2024 & 2032
- Figure 3: North America Dental CAD Market Revenue (Million), by Country 2024 & 2032
- Figure 4: North America Dental CAD Market Volume (K Unit), by Country 2024 & 2032
- Figure 5: North America Dental CAD Market Revenue Share (%), by Country 2024 & 2032
- Figure 6: North America Dental CAD Market Volume Share (%), by Country 2024 & 2032
- Figure 7: Europe Dental CAD Market Revenue (Million), by Country 2024 & 2032
- Figure 8: Europe Dental CAD Market Volume (K Unit), by Country 2024 & 2032
- Figure 9: Europe Dental CAD Market Revenue Share (%), by Country 2024 & 2032
- Figure 10: Europe Dental CAD Market Volume Share (%), by Country 2024 & 2032
- Figure 11: Asia Pacific Dental CAD Market Revenue (Million), by Country 2024 & 2032
- Figure 12: Asia Pacific Dental CAD Market Volume (K Unit), by Country 2024 & 2032
- Figure 13: Asia Pacific Dental CAD Market Revenue Share (%), by Country 2024 & 2032
- Figure 14: Asia Pacific Dental CAD Market Volume Share (%), by Country 2024 & 2032
- Figure 15: Middle East and Africa Dental CAD Market Revenue (Million), by Country 2024 & 2032
- Figure 16: Middle East and Africa Dental CAD Market Volume (K Unit), by Country 2024 & 2032
- Figure 17: Middle East and Africa Dental CAD Market Revenue Share (%), by Country 2024 & 2032
- Figure 18: Middle East and Africa Dental CAD Market Volume Share (%), by Country 2024 & 2032
- Figure 19: South America Dental CAD Market Revenue (Million), by Country 2024 & 2032
- Figure 20: South America Dental CAD Market Volume (K Unit), by Country 2024 & 2032
- Figure 21: South America Dental CAD Market Revenue Share (%), by Country 2024 & 2032
- Figure 22: South America Dental CAD Market Volume Share (%), by Country 2024 & 2032
- Figure 23: North America Dental CAD Market Revenue (Million), by Component 2024 & 2032
- Figure 24: North America Dental CAD Market Volume (K Unit), by Component 2024 & 2032
- Figure 25: North America Dental CAD Market Revenue Share (%), by Component 2024 & 2032
- Figure 26: North America Dental CAD Market Volume Share (%), by Component 2024 & 2032
- Figure 27: North America Dental CAD Market Revenue (Million), by Application 2024 & 2032
- Figure 28: North America Dental CAD Market Volume (K Unit), by Application 2024 & 2032
- Figure 29: North America Dental CAD Market Revenue Share (%), by Application 2024 & 2032
- Figure 30: North America Dental CAD Market Volume Share (%), by Application 2024 & 2032
- Figure 31: North America Dental CAD Market Revenue (Million), by Country 2024 & 2032
- Figure 32: North America Dental CAD Market Volume (K Unit), by Country 2024 & 2032
- Figure 33: North America Dental CAD Market Revenue Share (%), by Country 2024 & 2032
- Figure 34: North America Dental CAD Market Volume Share (%), by Country 2024 & 2032
- Figure 35: Europe Dental CAD Market Revenue (Million), by Component 2024 & 2032
- Figure 36: Europe Dental CAD Market Volume (K Unit), by Component 2024 & 2032
- Figure 37: Europe Dental CAD Market Revenue Share (%), by Component 2024 & 2032
- Figure 38: Europe Dental CAD Market Volume Share (%), by Component 2024 & 2032
- Figure 39: Europe Dental CAD Market Revenue (Million), by Application 2024 & 2032
- Figure 40: Europe Dental CAD Market Volume (K Unit), by Application 2024 & 2032
- Figure 41: Europe Dental CAD Market Revenue Share (%), by Application 2024 & 2032
- Figure 42: Europe Dental CAD Market Volume Share (%), by Application 2024 & 2032
- Figure 43: Europe Dental CAD Market Revenue (Million), by Country 2024 & 2032
- Figure 44: Europe Dental CAD Market Volume (K Unit), by Country 2024 & 2032
- Figure 45: Europe Dental CAD Market Revenue Share (%), by Country 2024 & 2032
- Figure 46: Europe Dental CAD Market Volume Share (%), by Country 2024 & 2032
- Figure 47: Asia Pacific Dental CAD Market Revenue (Million), by Component 2024 & 2032
- Figure 48: Asia Pacific Dental CAD Market Volume (K Unit), by Component 2024 & 2032
- Figure 49: Asia Pacific Dental CAD Market Revenue Share (%), by Component 2024 & 2032
- Figure 50: Asia Pacific Dental CAD Market Volume Share (%), by Component 2024 & 2032
- Figure 51: Asia Pacific Dental CAD Market Revenue (Million), by Application 2024 & 2032
- Figure 52: Asia Pacific Dental CAD Market Volume (K Unit), by Application 2024 & 2032
- Figure 53: Asia Pacific Dental CAD Market Revenue Share (%), by Application 2024 & 2032
- Figure 54: Asia Pacific Dental CAD Market Volume Share (%), by Application 2024 & 2032
- Figure 55: Asia Pacific Dental CAD Market Revenue (Million), by Country 2024 & 2032
- Figure 56: Asia Pacific Dental CAD Market Volume (K Unit), by Country 2024 & 2032
- Figure 57: Asia Pacific Dental CAD Market Revenue Share (%), by Country 2024 & 2032
- Figure 58: Asia Pacific Dental CAD Market Volume Share (%), by Country 2024 & 2032
- Figure 59: Middle East and Africa Dental CAD Market Revenue (Million), by Component 2024 & 2032
- Figure 60: Middle East and Africa Dental CAD Market Volume (K Unit), by Component 2024 & 2032
- Figure 61: Middle East and Africa Dental CAD Market Revenue Share (%), by Component 2024 & 2032
- Figure 62: Middle East and Africa Dental CAD Market Volume Share (%), by Component 2024 & 2032
- Figure 63: Middle East and Africa Dental CAD Market Revenue (Million), by Application 2024 & 2032
- Figure 64: Middle East and Africa Dental CAD Market Volume (K Unit), by Application 2024 & 2032
- Figure 65: Middle East and Africa Dental CAD Market Revenue Share (%), by Application 2024 & 2032
- Figure 66: Middle East and Africa Dental CAD Market Volume Share (%), by Application 2024 & 2032
- Figure 67: Middle East and Africa Dental CAD Market Revenue (Million), by Country 2024 & 2032
- Figure 68: Middle East and Africa Dental CAD Market Volume (K Unit), by Country 2024 & 2032
- Figure 69: Middle East and Africa Dental CAD Market Revenue Share (%), by Country 2024 & 2032
- Figure 70: Middle East and Africa Dental CAD Market Volume Share (%), by Country 2024 & 2032
- Figure 71: South America Dental CAD Market Revenue (Million), by Component 2024 & 2032
- Figure 72: South America Dental CAD Market Volume (K Unit), by Component 2024 & 2032
- Figure 73: South America Dental CAD Market Revenue Share (%), by Component 2024 & 2032
- Figure 74: South America Dental CAD Market Volume Share (%), by Component 2024 & 2032
- Figure 75: South America Dental CAD Market Revenue (Million), by Application 2024 & 2032
- Figure 76: South America Dental CAD Market Volume (K Unit), by Application 2024 & 2032
- Figure 77: South America Dental CAD Market Revenue Share (%), by Application 2024 & 2032
- Figure 78: South America Dental CAD Market Volume Share (%), by Application 2024 & 2032
- Figure 79: South America Dental CAD Market Revenue (Million), by Country 2024 & 2032
- Figure 80: South America Dental CAD Market Volume (K Unit), by Country 2024 & 2032
- Figure 81: South America Dental CAD Market Revenue Share (%), by Country 2024 & 2032
- Figure 82: South America Dental CAD Market Volume Share (%), by Country 2024 & 2032
List of Tables
- Table 1: Global Dental CAD Market Revenue Million Forecast, by Region 2019 & 2032
- Table 2: Global Dental CAD Market Volume K Unit Forecast, by Region 2019 & 2032
- Table 3: Global Dental CAD Market Revenue Million Forecast, by Component 2019 & 2032
- Table 4: Global Dental CAD Market Volume K Unit Forecast, by Component 2019 & 2032
- Table 5: Global Dental CAD Market Revenue Million Forecast, by Application 2019 & 2032
- Table 6: Global Dental CAD Market Volume K Unit Forecast, by Application 2019 & 2032
- Table 7: Global Dental CAD Market Revenue Million Forecast, by Region 2019 & 2032
- Table 8: Global Dental CAD Market Volume K Unit Forecast, by Region 2019 & 2032
- Table 9: Global Dental CAD Market Revenue Million Forecast, by Country 2019 & 2032
- Table 10: Global Dental CAD Market Volume K Unit Forecast, by Country 2019 & 2032
- Table 11: United States Dental CAD Market Revenue (Million) Forecast, by Application 2019 & 2032
- Table 12: United States Dental CAD Market Volume (K Unit) Forecast, by Application 2019 & 2032
- Table 13: Canada Dental CAD Market Revenue (Million) Forecast, by Application 2019 & 2032
- Table 14: Canada Dental CAD Market Volume (K Unit) Forecast, by Application 2019 & 2032
- Table 15: Mexico Dental CAD Market Revenue (Million) Forecast, by Application 2019 & 2032
- Table 16: Mexico Dental CAD Market Volume (K Unit) Forecast, by Application 2019 & 2032
- Table 17: Global Dental CAD Market Revenue Million Forecast, by Country 2019 & 2032
- Table 18: Global Dental CAD Market Volume K Unit Forecast, by Country 2019 & 2032
- Table 19: Germany Dental CAD Market Revenue (Million) Forecast, by Application 2019 & 2032
- Table 20: Germany Dental CAD Market Volume (K Unit) Forecast, by Application 2019 & 2032
- Table 21: United Kingdom Dental CAD Market Revenue (Million) Forecast, by Application 2019 & 2032
- Table 22: United Kingdom Dental CAD Market Volume (K Unit) Forecast, by Application 2019 & 2032
- Table 23: France Dental CAD Market Revenue (Million) Forecast, by Application 2019 & 2032
- Table 24: France Dental CAD Market Volume (K Unit) Forecast, by Application 2019 & 2032
- Table 25: Italy Dental CAD Market Revenue (Million) Forecast, by Application 2019 & 2032
- Table 26: Italy Dental CAD Market Volume (K Unit) Forecast, by Application 2019 & 2032
- Table 27: Spain Dental CAD Market Revenue (Million) Forecast, by Application 2019 & 2032
- Table 28: Spain Dental CAD Market Volume (K Unit) Forecast, by Application 2019 & 2032
- Table 29: Rest of Europe Dental CAD Market Revenue (Million) Forecast, by Application 2019 & 2032
- Table 30: Rest of Europe Dental CAD Market Volume (K Unit) Forecast, by Application 2019 & 2032
- Table 31: Global Dental CAD Market Revenue Million Forecast, by Country 2019 & 2032
- Table 32: Global Dental CAD Market Volume K Unit Forecast, by Country 2019 & 2032
- Table 33: China Dental CAD Market Revenue (Million) Forecast, by Application 2019 & 2032
- Table 34: China Dental CAD Market Volume (K Unit) Forecast, by Application 2019 & 2032
- Table 35: Japan Dental CAD Market Revenue (Million) Forecast, by Application 2019 & 2032
- Table 36: Japan Dental CAD Market Volume (K Unit) Forecast, by Application 2019 & 2032
- Table 37: India Dental CAD Market Revenue (Million) Forecast, by Application 2019 & 2032
- Table 38: India Dental CAD Market Volume (K Unit) Forecast, by Application 2019 & 2032
- Table 39: Australia Dental CAD Market Revenue (Million) Forecast, by Application 2019 & 2032
- Table 40: Australia Dental CAD Market Volume (K Unit) Forecast, by Application 2019 & 2032
- Table 41: South Korea Dental CAD Market Revenue (Million) Forecast, by Application 2019 & 2032
- Table 42: South Korea Dental CAD Market Volume (K Unit) Forecast, by Application 2019 & 2032
- Table 43: Rest of Asia Pacific Dental CAD Market Revenue (Million) Forecast, by Application 2019 & 2032
- Table 44: Rest of Asia Pacific Dental CAD Market Volume (K Unit) Forecast, by Application 2019 & 2032
- Table 45: Global Dental CAD Market Revenue Million Forecast, by Country 2019 & 2032
- Table 46: Global Dental CAD Market Volume K Unit Forecast, by Country 2019 & 2032
- Table 47: GCC Dental CAD Market Revenue (Million) Forecast, by Application 2019 & 2032
- Table 48: GCC Dental CAD Market Volume (K Unit) Forecast, by Application 2019 & 2032
- Table 49: South Africa Dental CAD Market Revenue (Million) Forecast, by Application 2019 & 2032
- Table 50: South Africa Dental CAD Market Volume (K Unit) Forecast, by Application 2019 & 2032
- Table 51: Rest of Middle East and Africa Dental CAD Market Revenue (Million) Forecast, by Application 2019 & 2032
- Table 52: Rest of Middle East and Africa Dental CAD Market Volume (K Unit) Forecast, by Application 2019 & 2032
- Table 53: Global Dental CAD Market Revenue Million Forecast, by Country 2019 & 2032
- Table 54: Global Dental CAD Market Volume K Unit Forecast, by Country 2019 & 2032
- Table 55: Brazil Dental CAD Market Revenue (Million) Forecast, by Application 2019 & 2032
- Table 56: Brazil Dental CAD Market Volume (K Unit) Forecast, by Application 2019 & 2032
- Table 57: Argentina Dental CAD Market Revenue (Million) Forecast, by Application 2019 & 2032
- Table 58: Argentina Dental CAD Market Volume (K Unit) Forecast, by Application 2019 & 2032
- Table 59: Rest of South America Dental CAD Market Revenue (Million) Forecast, by Application 2019 & 2032
- Table 60: Rest of South America Dental CAD Market Volume (K Unit) Forecast, by Application 2019 & 2032
- Table 61: Global Dental CAD Market Revenue Million Forecast, by Component 2019 & 2032
- Table 62: Global Dental CAD Market Volume K Unit Forecast, by Component 2019 & 2032
- Table 63: Global Dental CAD Market Revenue Million Forecast, by Application 2019 & 2032
- Table 64: Global Dental CAD Market Volume K Unit Forecast, by Application 2019 & 2032
- Table 65: Global Dental CAD Market Revenue Million Forecast, by Country 2019 & 2032
- Table 66: Global Dental CAD Market Volume K Unit Forecast, by Country 2019 & 2032
- Table 67: United States Dental CAD Market Revenue (Million) Forecast, by Application 2019 & 2032
- Table 68: United States Dental CAD Market Volume (K Unit) Forecast, by Application 2019 & 2032
- Table 69: Canada Dental CAD Market Revenue (Million) Forecast, by Application 2019 & 2032
- Table 70: Canada Dental CAD Market Volume (K Unit) Forecast, by Application 2019 & 2032
- Table 71: Mexico Dental CAD Market Revenue (Million) Forecast, by Application 2019 & 2032
- Table 72: Mexico Dental CAD Market Volume (K Unit) Forecast, by Application 2019 & 2032
- Table 73: Global Dental CAD Market Revenue Million Forecast, by Component 2019 & 2032
- Table 74: Global Dental CAD Market Volume K Unit Forecast, by Component 2019 & 2032
- Table 75: Global Dental CAD Market Revenue Million Forecast, by Application 2019 & 2032
- Table 76: Global Dental CAD Market Volume K Unit Forecast, by Application 2019 & 2032
- Table 77: Global Dental CAD Market Revenue Million Forecast, by Country 2019 & 2032
- Table 78: Global Dental CAD Market Volume K Unit Forecast, by Country 2019 & 2032
- Table 79: Germany Dental CAD Market Revenue (Million) Forecast, by Application 2019 & 2032
- Table 80: Germany Dental CAD Market Volume (K Unit) Forecast, by Application 2019 & 2032
- Table 81: United Kingdom Dental CAD Market Revenue (Million) Forecast, by Application 2019 & 2032
- Table 82: United Kingdom Dental CAD Market Volume (K Unit) Forecast, by Application 2019 & 2032
- Table 83: France Dental CAD Market Revenue (Million) Forecast, by Application 2019 & 2032
- Table 84: France Dental CAD Market Volume (K Unit) Forecast, by Application 2019 & 2032
- Table 85: Italy Dental CAD Market Revenue (Million) Forecast, by Application 2019 & 2032
- Table 86: Italy Dental CAD Market Volume (K Unit) Forecast, by Application 2019 & 2032
- Table 87: Spain Dental CAD Market Revenue (Million) Forecast, by Application 2019 & 2032
- Table 88: Spain Dental CAD Market Volume (K Unit) Forecast, by Application 2019 & 2032
- Table 89: Rest of Europe Dental CAD Market Revenue (Million) Forecast, by Application 2019 & 2032
- Table 90: Rest of Europe Dental CAD Market Volume (K Unit) Forecast, by Application 2019 & 2032
- Table 91: Global Dental CAD Market Revenue Million Forecast, by Component 2019 & 2032
- Table 92: Global Dental CAD Market Volume K Unit Forecast, by Component 2019 & 2032
- Table 93: Global Dental CAD Market Revenue Million Forecast, by Application 2019 & 2032
- Table 94: Global Dental CAD Market Volume K Unit Forecast, by Application 2019 & 2032
- Table 95: Global Dental CAD Market Revenue Million Forecast, by Country 2019 & 2032
- Table 96: Global Dental CAD Market Volume K Unit Forecast, by Country 2019 & 2032
- Table 97: China Dental CAD Market Revenue (Million) Forecast, by Application 2019 & 2032
- Table 98: China Dental CAD Market Volume (K Unit) Forecast, by Application 2019 & 2032
- Table 99: Japan Dental CAD Market Revenue (Million) Forecast, by Application 2019 & 2032
- Table 100: Japan Dental CAD Market Volume (K Unit) Forecast, by Application 2019 & 2032
- Table 101: India Dental CAD Market Revenue (Million) Forecast, by Application 2019 & 2032
- Table 102: India Dental CAD Market Volume (K Unit) Forecast, by Application 2019 & 2032
- Table 103: Australia Dental CAD Market Revenue (Million) Forecast, by Application 2019 & 2032
- Table 104: Australia Dental CAD Market Volume (K Unit) Forecast, by Application 2019 & 2032
- Table 105: South Korea Dental CAD Market Revenue (Million) Forecast, by Application 2019 & 2032
- Table 106: South Korea Dental CAD Market Volume (K Unit) Forecast, by Application 2019 & 2032
- Table 107: Rest of Asia Pacific Dental CAD Market Revenue (Million) Forecast, by Application 2019 & 2032
- Table 108: Rest of Asia Pacific Dental CAD Market Volume (K Unit) Forecast, by Application 2019 & 2032
- Table 109: Global Dental CAD Market Revenue Million Forecast, by Component 2019 & 2032
- Table 110: Global Dental CAD Market Volume K Unit Forecast, by Component 2019 & 2032
- Table 111: Global Dental CAD Market Revenue Million Forecast, by Application 2019 & 2032
- Table 112: Global Dental CAD Market Volume K Unit Forecast, by Application 2019 & 2032
- Table 113: Global Dental CAD Market Revenue Million Forecast, by Country 2019 & 2032
- Table 114: Global Dental CAD Market Volume K Unit Forecast, by Country 2019 & 2032
- Table 115: GCC Dental CAD Market Revenue (Million) Forecast, by Application 2019 & 2032
- Table 116: GCC Dental CAD Market Volume (K Unit) Forecast, by Application 2019 & 2032
- Table 117: South Africa Dental CAD Market Revenue (Million) Forecast, by Application 2019 & 2032
- Table 118: South Africa Dental CAD Market Volume (K Unit) Forecast, by Application 2019 & 2032
- Table 119: Rest of Middle East and Africa Dental CAD Market Revenue (Million) Forecast, by Application 2019 & 2032
- Table 120: Rest of Middle East and Africa Dental CAD Market Volume (K Unit) Forecast, by Application 2019 & 2032
- Table 121: Global Dental CAD Market Revenue Million Forecast, by Component 2019 & 2032
- Table 122: Global Dental CAD Market Volume K Unit Forecast, by Component 2019 & 2032
- Table 123: Global Dental CAD Market Revenue Million Forecast, by Application 2019 & 2032
- Table 124: Global Dental CAD Market Volume K Unit Forecast, by Application 2019 & 2032
- Table 125: Global Dental CAD Market Revenue Million Forecast, by Country 2019 & 2032
- Table 126: Global Dental CAD Market Volume K Unit Forecast, by Country 2019 & 2032
- Table 127: Brazil Dental CAD Market Revenue (Million) Forecast, by Application 2019 & 2032
- Table 128: Brazil Dental CAD Market Volume (K Unit) Forecast, by Application 2019 & 2032
- Table 129: Argentina Dental CAD Market Revenue (Million) Forecast, by Application 2019 & 2032
- Table 130: Argentina Dental CAD Market Volume (K Unit) Forecast, by Application 2019 & 2032
- Table 131: Rest of South America Dental CAD Market Revenue (Million) Forecast, by Application 2019 & 2032
- Table 132: Rest of South America Dental CAD Market Volume (K Unit) Forecast, by Application 2019 & 2032
Frequently Asked Questions
1. What is the projected Compound Annual Growth Rate (CAGR) of the Dental CAD Market?
The projected CAGR is approximately 8.50%.
2. Which companies are prominent players in the Dental CAD Market?
Key companies in the market include PLANMECA OY, Roland DGA Corporation, Dentsply Sirona, Zirkonzahn, Hexagon AB, Kelkar Dynamics LLP, Amann Girrbach AG, Carestream Dental LLC, 3Shape, Align Technology Inc, Envista Holdings Corporation, Datron AG, Institut Straumann AG, ZimVie Inc.
3. What are the main segments of the Dental CAD Market?
The market segments include Component, Application.
4. Can you provide details about the market size?
The market size is estimated to be USD XX Million as of 2022.
5. What are some drivers contributing to market growth?
Increasing Burden of Oral Diseases And Ageing Population; Technological Advancements in Dental Imaging Methodologies.
6. What are the notable trends driving market growth?
The Scanners Segment is Expected to Hold Significant Share in Dental CAD Market Over the Forecast Period.
7. Are there any restraints impacting market growth?
Excessive Costs Involved in Private Health Insurance.
8. Can you provide examples of recent developments in the market?
In September 2022, Planmeca introduced a completely new software module for Planmeca Romexis, which makes working with digital impressions easier and faster. The Planmeca Romexis CAD/CAM module streamlines the scan-and-send workflow for capturing, analyzing, and exporting digital impressions and offers new intraoral scanner users a smooth CAD/CAM dentistry experience.
9. What pricing options are available for accessing the report?
Pricing options include single-user, multi-user, and enterprise licenses priced at USD 4750, USD 5250, and USD 8750 respectively.
10. Is the market size provided in terms of value or volume?
The market size is provided in terms of value, measured in Million and volume, measured in K Unit.
11. Are there any specific market keywords associated with the report?
Yes, the market keyword associated with the report is "Dental CAD Market," which aids in identifying and referencing the specific market segment covered.
12. How do I determine which pricing option suits my needs best?
The pricing options vary based on user requirements and access needs. Individual users may opt for single-user licenses, while businesses requiring broader access may choose multi-user or enterprise licenses for cost-effective access to the report.
13. Are there any additional resources or data provided in the Dental CAD Market report?
While the report offers comprehensive insights, it's advisable to review the specific contents or supplementary materials provided to ascertain if additional resources or data are available.
14. How can I stay updated on further developments or reports in the Dental CAD Market?
To stay informed about further developments, trends, and reports in the Dental CAD Market, consider subscribing to industry newsletters, following relevant companies and organizations, or regularly checking reputable industry news sources and publications.
Methodology
Step 1 - Identification of Relevant Samples Size from Population Database


Step 2 - Approaches for Defining Global Market Size (Value, Volume* & Price*)

Note*: In applicable scenarios
Step 3 - Data Sources
Primary Research
- Web Analytics
- Survey Reports
- Research Institute
- Latest Research Reports
- Opinion Leaders
Secondary Research
- Annual Reports
- White Paper
- Latest Press Release
- Industry Association
- Paid Database
- Investor Presentations

Step 4 - Data Triangulation
Involves using different sources of information in order to increase the validity of a study
These sources are likely to be stakeholders in a program - participants, other researchers, program staff, other community members, and so on.
Then we put all data in single framework & apply various statistical tools to find out the dynamic on the market.
During the analysis stage, feedback from the stakeholder groups would be compared to determine areas of agreement as well as areas of divergence


