
Key Insights
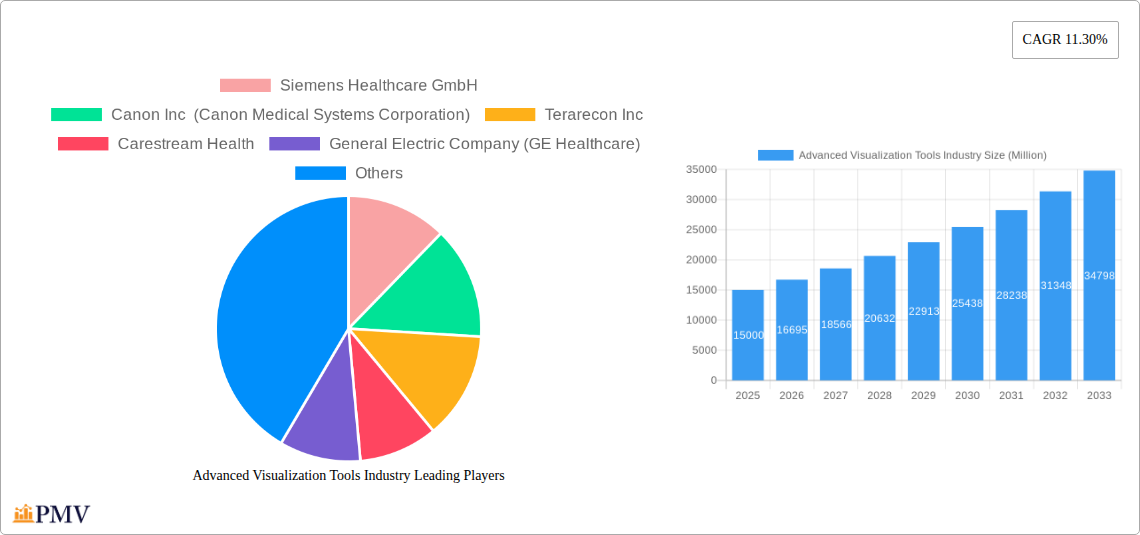
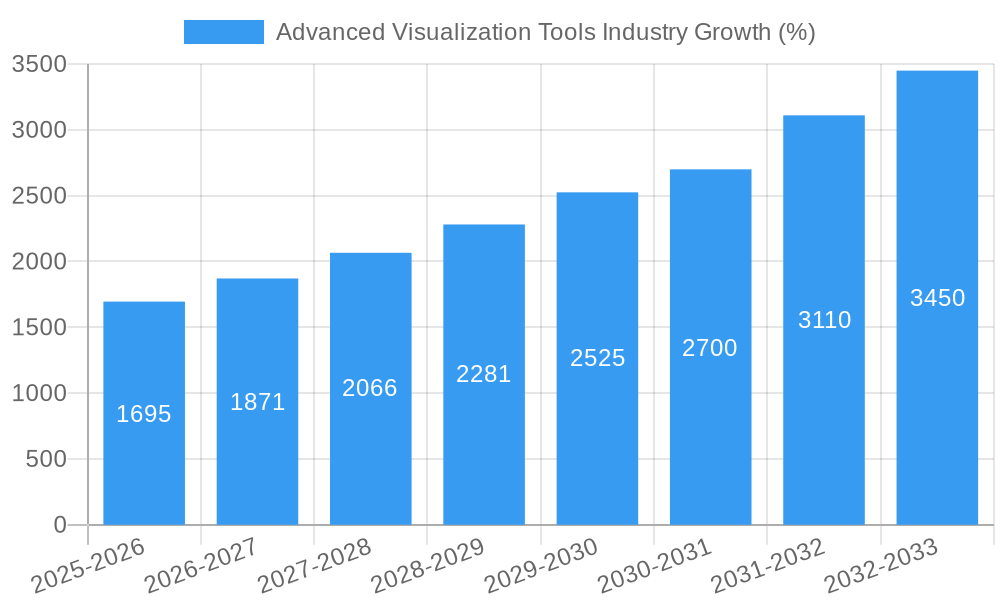
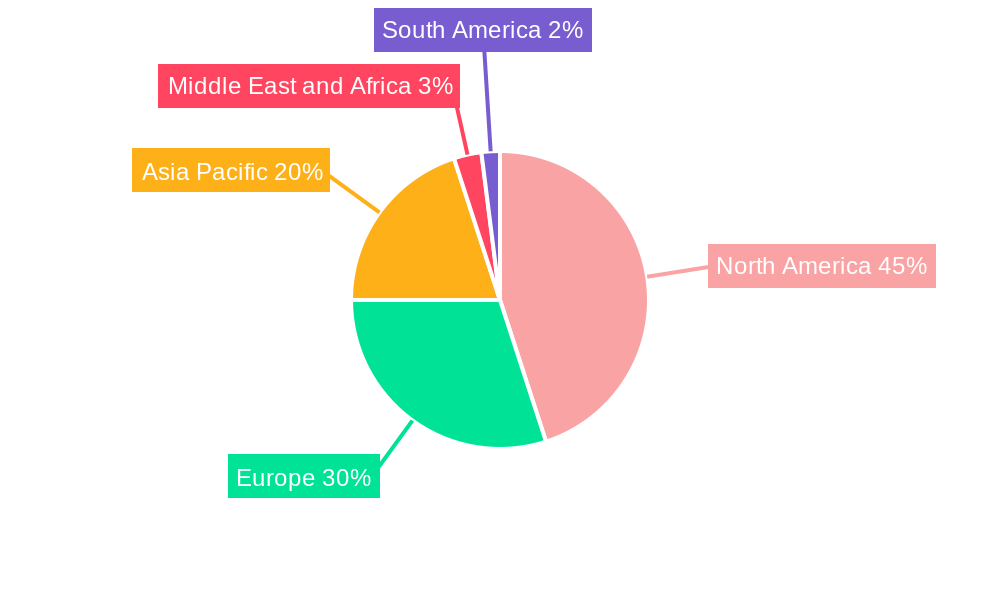
The advanced visualization tools market, encompassing MRI, CT, ultrasound, and nuclear medicine imaging modalities, is experiencing robust growth, projected to maintain a Compound Annual Growth Rate (CAGR) of 11.30% from 2025 to 2033. This expansion is fueled by several key drivers. The increasing prevalence of chronic diseases like cancer and cardiovascular conditions necessitates more sophisticated diagnostic tools, boosting demand for advanced visualization solutions. Technological advancements, such as AI-powered image analysis and improved resolution capabilities, are enhancing diagnostic accuracy and efficiency, further fueling market growth. Furthermore, the rising adoption of minimally invasive procedures, which often rely heavily on real-time visualization, contributes to market expansion. The market is segmented by imaging modality (MRI, CT, Ultrasound, etc.), clinical application (Oncology, Cardiology, etc.), product and service (hardware, software, services), and solution type (enterprise, standalone). The North American market currently holds a significant share, driven by advanced healthcare infrastructure and high adoption rates of cutting-edge technologies. However, the Asia-Pacific region is expected to witness substantial growth due to increasing healthcare expenditure and rising awareness about advanced diagnostic techniques. The competitive landscape is marked by established players like Siemens, GE Healthcare, and Philips, alongside emerging innovative companies focusing on specialized solutions.
Despite the significant growth potential, the market faces certain restraints. High initial investment costs associated with advanced visualization systems can limit accessibility, particularly in resource-constrained healthcare settings. Regulatory hurdles and the need for skilled professionals to operate and interpret the complex data generated by these systems also pose challenges. However, the ongoing trend towards value-based healthcare, focusing on improved outcomes and reduced costs, is likely to drive innovation and potentially mitigate some of these restraints. The market is poised for continued expansion, driven by technological advancements, increasing disease prevalence, and the growing demand for precise and efficient diagnostics. Specific growth within segments will vary based on technological breakthroughs and evolving clinical practices. For example, AI integration in image analysis is likely to accelerate the growth of software and services segments.
Advanced Visualization Tools Industry Market Report: 2019-2033
This comprehensive report provides an in-depth analysis of the Advanced Visualization Tools industry, offering valuable insights for stakeholders, investors, and industry professionals. The report covers the period 2019-2033, with a focus on the 2025-2033 forecast period and a base year of 2025. The market is segmented by imaging modality, clinical application, product and service type, and solution type, providing a granular view of market dynamics and growth potential. The total market size is projected to reach xx Million by 2033.
Advanced Visualization Tools Industry Market Structure & Competitive Dynamics
The Advanced Visualization Tools market exhibits a moderately concentrated structure, with key players like Siemens Healthcare GmbH, Canon Inc (Canon Medical Systems Corporation), and GE Healthcare holding significant market share. However, the presence of several smaller, specialized players fosters innovation and competition. The industry is characterized by a dynamic innovation ecosystem, driven by advancements in AI, cloud computing, and big data analytics. Regulatory frameworks, particularly those related to medical device approvals and data privacy (e.g., HIPAA, GDPR), significantly influence market dynamics. Product substitutes, such as traditional diagnostic methods, exert competitive pressure, though the increasing demand for faster, more accurate diagnoses favors the adoption of advanced visualization tools. End-user trends, including the growing preference for minimally invasive procedures and personalized medicine, are shaping market demand. M&A activity in the sector has been significant, with deal values exceeding xx Million in recent years, driven by the consolidation of market share and the acquisition of specialized technologies. For instance, the merger of Company A and Company B in 2024 resulted in a xx Million market valuation increase.
- Market Concentration: Moderately concentrated, with top 5 players holding approximately xx% market share (2024).
- Innovation Ecosystems: Strong, driven by advancements in AI, cloud computing, and big data.
- Regulatory Frameworks: Stringent, impacting market entry and product approvals.
- Product Substitutes: Traditional diagnostic methods, but with limited impact due to growing demand for advanced solutions.
- M&A Activity: Significant, with deal values exceeding xx Million in the past 5 years.
Advanced Visualization Tools Industry Industry Trends & Insights
The Advanced Visualization Tools market is experiencing robust growth, driven by several key factors. The increasing prevalence of chronic diseases, coupled with the rising demand for accurate and timely diagnoses, is a major growth driver. Technological advancements, such as the integration of AI and machine learning algorithms into imaging software, are enhancing diagnostic accuracy and efficiency. This leads to improved patient outcomes and increased adoption across various clinical applications. Consumer preferences are shifting towards non-invasive procedures, leading to the increased use of advanced imaging techniques. Moreover, the rising adoption of telemedicine and remote diagnostics is creating new market opportunities. The market is projected to exhibit a CAGR of xx% during the forecast period (2025-2033), with market penetration steadily increasing in both developed and emerging economies. Competitive dynamics are influenced by continuous product innovation, strategic partnerships, and the increasing focus on providing comprehensive solutions (hardware, software, and services).
Dominant Markets & Segments in Advanced Visualization Tools Industry
The North American region currently dominates the Advanced Visualization Tools market, driven by high healthcare expenditure, advanced infrastructure, and early adoption of new technologies. Within the segments, MRI and CT imaging modalities hold the largest market share, primarily due to their widespread use in various clinical applications like oncology and cardiology. Oncology is the leading clinical application segment due to the increased incidence of cancer and the need for precise diagnostics and treatment planning. The hardware segment currently represents the most significant market share, however, the software and services segments are witnessing the fastest growth rates, fueled by the increasing demand for AI-powered analytics and remote diagnostics. Enterprise solutions dominate the market, followed by standalone solutions catering to smaller healthcare providers.
- Key Drivers in North America: High healthcare expenditure, advanced infrastructure, and early adoption of new technologies.
- MRI & CT Dominance: Driven by widespread use across multiple clinical applications.
- Oncology as a Leading Clinical Application: Fueled by the increasing incidence of cancer and need for accurate diagnosis.
- Hardware Segment: Largest market share, with fastest growth projected for Software & Services.
- Enterprise Solution: Highest adoption rate due to its scalability and integrated features.
Advanced Visualization Tools Industry Product Innovations
Recent product innovations focus on AI-powered image analysis, cloud-based solutions for improved collaboration, and the development of more compact and portable imaging devices. These advancements are enhancing diagnostic accuracy, streamlining workflows, and expanding access to advanced visualization tools in remote areas. Key competitive advantages are derived from superior image quality, user-friendly interfaces, robust data analytics capabilities, and seamless integration with existing healthcare IT infrastructures. The market is witnessing a surge in innovative applications targeting specific clinical needs, such as advanced visualization for minimally invasive surgeries and personalized treatment planning based on individual patient data.
Report Segmentation & Scope
This report segments the Advanced Visualization Tools market based on imaging modality (MRI, CT, Ultrasound, Nuclear Medicine, Other), clinical application (Oncology, Orthopedics, Cardiovascular, Neurology, Other), product and service (Hardware, Software, Services), and type of solution (Enterprise, Standalone). Each segment's growth projections, market sizes, and competitive dynamics are analyzed in detail. The projected market size for each segment varies significantly, with MRI and CT modalities expected to maintain their dominant positions. Software and services are projected to show faster growth than hardware. The enterprise segment is expected to retain its dominance due to its suitability for larger healthcare organizations.
Key Drivers of Advanced Visualization Tools Industry Growth
The growth of the Advanced Visualization Tools industry is fueled by several factors. Technological advancements like AI and machine learning are improving image quality and analysis. Increased healthcare spending, particularly in developed nations, is driving market expansion. Furthermore, favorable regulatory environments and increasing awareness of the benefits of advanced diagnostic tools contribute significantly to market growth. The shift towards value-based healthcare models, emphasizing preventative care and improved patient outcomes, further incentivizes investment in advanced visualization technologies.
Challenges in the Advanced Visualization Tools Industry Sector
The Advanced Visualization Tools industry faces several challenges. High initial investment costs associated with acquiring advanced imaging equipment can limit market penetration in resource-constrained settings. Regulatory hurdles and stringent approval processes can delay product launches and increase development costs. Supply chain disruptions can impact equipment availability and overall market stability. Intense competition among established players and the emergence of new entrants pose a continuous challenge to profitability and market share. These factors can collectively result in a projected xx Million loss in market revenue within the next five years.
Leading Players in the Advanced Visualization Tools Industry Market
- Siemens Healthcare GmbH (Siemens Healthineers)
- Canon Inc (Canon Medical Systems Corporation) (Canon)
- Terarecon Inc
- Carestream Health (Carestream Health)
- General Electric Company (GE Healthcare) (GE Healthcare)
- Koninklijke Philips NV (Philips)
- Pro Medicus Ltd (Pro Medicus)
- Agfa-Gevaert Group (Agfa-Gevaert)
- Fujifilm Holdings Corporation (Fujifilm)
Key Developments in Advanced Visualization Tools Industry Sector
- August 2022: Kitware launched MIQA, a cloud-based application for medical image quality assurance, enhancing collaboration and longitudinal studies.
- February 2022: Siemens Healthineers and Universal Medical Imaging partnered to improve image screening efficiency in Chinese primary healthcare institutions using advanced equipment and remote assistant tools.
Strategic Advanced Visualization Tools Industry Market Outlook
The Advanced Visualization Tools market holds significant growth potential driven by continuous technological innovation, the rising prevalence of chronic diseases, and increasing demand for precise and timely diagnoses. Strategic opportunities exist in developing AI-powered solutions, expanding into emerging markets, and forging strategic partnerships to create comprehensive healthcare solutions. Focusing on user-friendly interfaces, robust data analytics, and seamless integration with existing healthcare IT systems will be crucial for success in this competitive landscape. The market's future trajectory is promising, with significant growth expected throughout the forecast period.
Advanced Visualization Tools Industry Segmentation
-
1. Product and Service
- 1.1. Hardware
- 1.2. Software
- 1.3. Services
-
2. Type of Solution
- 2.1. Enterprise
- 2.2. Standalone
-
3. Imaging Modality
- 3.1. Magnetic Resonance Imaging (MRI)
- 3.2. Computed Tomography (CT)
- 3.3. Ultrasound
- 3.4. Nuclear Medicine
- 3.5. Other Imaging Modalities
-
4. Clinical Application
- 4.1. Oncology
- 4.2. Orthopedics
- 4.3. Cardiovascular
- 4.4. Neurology
- 4.5. Other Clinical Applications
Advanced Visualization Tools Industry Segmentation By Geography
-
1. North America
- 1.1. United States
- 1.2. Canada
- 1.3. Mexico
-
2. Europe
- 2.1. Germany
- 2.2. United Kingdom
- 2.3. France
- 2.4. Italy
- 2.5. Spain
- 2.6. Rest of Europe
-
3. Asia Pacific
- 3.1. China
- 3.2. Japan
- 3.3. India
- 3.4. Australia
- 3.5. South Korea
- 3.6. Rest of Asia Pacific
-
4. Middle East and Africa
- 4.1. GCC
- 4.2. South Africa
- 4.3. Rest of Middle East and Africa
-
5. South America
- 5.1. Brazil
- 5.2. Argentina
- 5.3. Rest of South America
Advanced Visualization Tools Industry REPORT HIGHLIGHTS
| Aspects | Details |
|---|---|
| Study Period | 2019-2033 |
| Base Year | 2024 |
| Estimated Year | 2025 |
| Forecast Period | 2025-2033 |
| Historical Period | 2019-2024 |
| Growth Rate | CAGR of 11.30% from 2019-2033 |
| Segmentation |
|
Table of Contents
- 1. Introduction
- 1.1. Research Scope
- 1.2. Market Segmentation
- 1.3. Research Methodology
- 1.4. Definitions and Assumptions
- 2. Executive Summary
- 2.1. Introduction
- 3. Market Dynamics
- 3.1. Introduction
- 3.2. Market Drivers
- 3.2.1. Increasing Prevalence of Chronic Diseases Coupled With Growing Geriatric Population; Rising Awareness of Benefits associated with Advanced Visualization Tools in Disease Diagnosis
- 3.3. Market Restrains
- 3.3.1. Limited Availability of Reimbursements for Radiology-Based Diagnostic Procedures
- 3.4. Market Trends
- 3.4.1. Oncology Under Clinical Application Expected to Grow Over the Forecast Period
- 4. Market Factor Analysis
- 4.1. Porters Five Forces
- 4.2. Supply/Value Chain
- 4.3. PESTEL analysis
- 4.4. Market Entropy
- 4.5. Patent/Trademark Analysis
- 5. Global Advanced Visualization Tools Industry Analysis, Insights and Forecast, 2019-2031
- 5.1. Market Analysis, Insights and Forecast - by Product and Service
- 5.1.1. Hardware
- 5.1.2. Software
- 5.1.3. Services
- 5.2. Market Analysis, Insights and Forecast - by Type of Solution
- 5.2.1. Enterprise
- 5.2.2. Standalone
- 5.3. Market Analysis, Insights and Forecast - by Imaging Modality
- 5.3.1. Magnetic Resonance Imaging (MRI)
- 5.3.2. Computed Tomography (CT)
- 5.3.3. Ultrasound
- 5.3.4. Nuclear Medicine
- 5.3.5. Other Imaging Modalities
- 5.4. Market Analysis, Insights and Forecast - by Clinical Application
- 5.4.1. Oncology
- 5.4.2. Orthopedics
- 5.4.3. Cardiovascular
- 5.4.4. Neurology
- 5.4.5. Other Clinical Applications
- 5.5. Market Analysis, Insights and Forecast - by Region
- 5.5.1. North America
- 5.5.2. Europe
- 5.5.3. Asia Pacific
- 5.5.4. Middle East and Africa
- 5.5.5. South America
- 5.1. Market Analysis, Insights and Forecast - by Product and Service
- 6. North America Advanced Visualization Tools Industry Analysis, Insights and Forecast, 2019-2031
- 6.1. Market Analysis, Insights and Forecast - by Product and Service
- 6.1.1. Hardware
- 6.1.2. Software
- 6.1.3. Services
- 6.2. Market Analysis, Insights and Forecast - by Type of Solution
- 6.2.1. Enterprise
- 6.2.2. Standalone
- 6.3. Market Analysis, Insights and Forecast - by Imaging Modality
- 6.3.1. Magnetic Resonance Imaging (MRI)
- 6.3.2. Computed Tomography (CT)
- 6.3.3. Ultrasound
- 6.3.4. Nuclear Medicine
- 6.3.5. Other Imaging Modalities
- 6.4. Market Analysis, Insights and Forecast - by Clinical Application
- 6.4.1. Oncology
- 6.4.2. Orthopedics
- 6.4.3. Cardiovascular
- 6.4.4. Neurology
- 6.4.5. Other Clinical Applications
- 6.1. Market Analysis, Insights and Forecast - by Product and Service
- 7. Europe Advanced Visualization Tools Industry Analysis, Insights and Forecast, 2019-2031
- 7.1. Market Analysis, Insights and Forecast - by Product and Service
- 7.1.1. Hardware
- 7.1.2. Software
- 7.1.3. Services
- 7.2. Market Analysis, Insights and Forecast - by Type of Solution
- 7.2.1. Enterprise
- 7.2.2. Standalone
- 7.3. Market Analysis, Insights and Forecast - by Imaging Modality
- 7.3.1. Magnetic Resonance Imaging (MRI)
- 7.3.2. Computed Tomography (CT)
- 7.3.3. Ultrasound
- 7.3.4. Nuclear Medicine
- 7.3.5. Other Imaging Modalities
- 7.4. Market Analysis, Insights and Forecast - by Clinical Application
- 7.4.1. Oncology
- 7.4.2. Orthopedics
- 7.4.3. Cardiovascular
- 7.4.4. Neurology
- 7.4.5. Other Clinical Applications
- 7.1. Market Analysis, Insights and Forecast - by Product and Service
- 8. Asia Pacific Advanced Visualization Tools Industry Analysis, Insights and Forecast, 2019-2031
- 8.1. Market Analysis, Insights and Forecast - by Product and Service
- 8.1.1. Hardware
- 8.1.2. Software
- 8.1.3. Services
- 8.2. Market Analysis, Insights and Forecast - by Type of Solution
- 8.2.1. Enterprise
- 8.2.2. Standalone
- 8.3. Market Analysis, Insights and Forecast - by Imaging Modality
- 8.3.1. Magnetic Resonance Imaging (MRI)
- 8.3.2. Computed Tomography (CT)
- 8.3.3. Ultrasound
- 8.3.4. Nuclear Medicine
- 8.3.5. Other Imaging Modalities
- 8.4. Market Analysis, Insights and Forecast - by Clinical Application
- 8.4.1. Oncology
- 8.4.2. Orthopedics
- 8.4.3. Cardiovascular
- 8.4.4. Neurology
- 8.4.5. Other Clinical Applications
- 8.1. Market Analysis, Insights and Forecast - by Product and Service
- 9. Middle East and Africa Advanced Visualization Tools Industry Analysis, Insights and Forecast, 2019-2031
- 9.1. Market Analysis, Insights and Forecast - by Product and Service
- 9.1.1. Hardware
- 9.1.2. Software
- 9.1.3. Services
- 9.2. Market Analysis, Insights and Forecast - by Type of Solution
- 9.2.1. Enterprise
- 9.2.2. Standalone
- 9.3. Market Analysis, Insights and Forecast - by Imaging Modality
- 9.3.1. Magnetic Resonance Imaging (MRI)
- 9.3.2. Computed Tomography (CT)
- 9.3.3. Ultrasound
- 9.3.4. Nuclear Medicine
- 9.3.5. Other Imaging Modalities
- 9.4. Market Analysis, Insights and Forecast - by Clinical Application
- 9.4.1. Oncology
- 9.4.2. Orthopedics
- 9.4.3. Cardiovascular
- 9.4.4. Neurology
- 9.4.5. Other Clinical Applications
- 9.1. Market Analysis, Insights and Forecast - by Product and Service
- 10. South America Advanced Visualization Tools Industry Analysis, Insights and Forecast, 2019-2031
- 10.1. Market Analysis, Insights and Forecast - by Product and Service
- 10.1.1. Hardware
- 10.1.2. Software
- 10.1.3. Services
- 10.2. Market Analysis, Insights and Forecast - by Type of Solution
- 10.2.1. Enterprise
- 10.2.2. Standalone
- 10.3. Market Analysis, Insights and Forecast - by Imaging Modality
- 10.3.1. Magnetic Resonance Imaging (MRI)
- 10.3.2. Computed Tomography (CT)
- 10.3.3. Ultrasound
- 10.3.4. Nuclear Medicine
- 10.3.5. Other Imaging Modalities
- 10.4. Market Analysis, Insights and Forecast - by Clinical Application
- 10.4.1. Oncology
- 10.4.2. Orthopedics
- 10.4.3. Cardiovascular
- 10.4.4. Neurology
- 10.4.5. Other Clinical Applications
- 10.1. Market Analysis, Insights and Forecast - by Product and Service
- 11. North America Advanced Visualization Tools Industry Analysis, Insights and Forecast, 2019-2031
- 11.1. Market Analysis, Insights and Forecast - By Country/Sub-region
- 11.1.1 United States
- 11.1.2 Canada
- 11.1.3 Mexico
- 12. Europe Advanced Visualization Tools Industry Analysis, Insights and Forecast, 2019-2031
- 12.1. Market Analysis, Insights and Forecast - By Country/Sub-region
- 12.1.1 Germany
- 12.1.2 United Kingdom
- 12.1.3 France
- 12.1.4 Italy
- 12.1.5 Spain
- 12.1.6 Rest of Europe
- 13. Asia Pacific Advanced Visualization Tools Industry Analysis, Insights and Forecast, 2019-2031
- 13.1. Market Analysis, Insights and Forecast - By Country/Sub-region
- 13.1.1 China
- 13.1.2 Japan
- 13.1.3 India
- 13.1.4 Australia
- 13.1.5 South Korea
- 13.1.6 Rest of Asia Pacific
- 14. Middle East and Africa Advanced Visualization Tools Industry Analysis, Insights and Forecast, 2019-2031
- 14.1. Market Analysis, Insights and Forecast - By Country/Sub-region
- 14.1.1 GCC
- 14.1.2 South Africa
- 14.1.3 Rest of Middle East and Africa
- 15. South America Advanced Visualization Tools Industry Analysis, Insights and Forecast, 2019-2031
- 15.1. Market Analysis, Insights and Forecast - By Country/Sub-region
- 15.1.1 Brazil
- 15.1.2 Argentina
- 15.1.3 Rest of South America
- 16. Competitive Analysis
- 16.1. Global Market Share Analysis 2024
- 16.2. Company Profiles
- 16.2.1 Siemens Healthcare GmbH
- 16.2.1.1. Overview
- 16.2.1.2. Products
- 16.2.1.3. SWOT Analysis
- 16.2.1.4. Recent Developments
- 16.2.1.5. Financials (Based on Availability)
- 16.2.2 Canon Inc (Canon Medical Systems Corporation)
- 16.2.2.1. Overview
- 16.2.2.2. Products
- 16.2.2.3. SWOT Analysis
- 16.2.2.4. Recent Developments
- 16.2.2.5. Financials (Based on Availability)
- 16.2.3 Terarecon Inc
- 16.2.3.1. Overview
- 16.2.3.2. Products
- 16.2.3.3. SWOT Analysis
- 16.2.3.4. Recent Developments
- 16.2.3.5. Financials (Based on Availability)
- 16.2.4 Carestream Health
- 16.2.4.1. Overview
- 16.2.4.2. Products
- 16.2.4.3. SWOT Analysis
- 16.2.4.4. Recent Developments
- 16.2.4.5. Financials (Based on Availability)
- 16.2.5 General Electric Company (GE Healthcare)
- 16.2.5.1. Overview
- 16.2.5.2. Products
- 16.2.5.3. SWOT Analysis
- 16.2.5.4. Recent Developments
- 16.2.5.5. Financials (Based on Availability)
- 16.2.6 Koninklijke Philips NV
- 16.2.6.1. Overview
- 16.2.6.2. Products
- 16.2.6.3. SWOT Analysis
- 16.2.6.4. Recent Developments
- 16.2.6.5. Financials (Based on Availability)
- 16.2.7 Pro Medicus Ltd
- 16.2.7.1. Overview
- 16.2.7.2. Products
- 16.2.7.3. SWOT Analysis
- 16.2.7.4. Recent Developments
- 16.2.7.5. Financials (Based on Availability)
- 16.2.8 Agfa-Gevaert Group
- 16.2.8.1. Overview
- 16.2.8.2. Products
- 16.2.8.3. SWOT Analysis
- 16.2.8.4. Recent Developments
- 16.2.8.5. Financials (Based on Availability)
- 16.2.9 Fujifilm Holdings Corporation
- 16.2.9.1. Overview
- 16.2.9.2. Products
- 16.2.9.3. SWOT Analysis
- 16.2.9.4. Recent Developments
- 16.2.9.5. Financials (Based on Availability)
- 16.2.1 Siemens Healthcare GmbH
List of Figures
- Figure 1: Global Advanced Visualization Tools Industry Revenue Breakdown (Million, %) by Region 2024 & 2032
- Figure 2: Global Advanced Visualization Tools Industry Volume Breakdown (K Unit, %) by Region 2024 & 2032
- Figure 3: North America Advanced Visualization Tools Industry Revenue (Million), by Country 2024 & 2032
- Figure 4: North America Advanced Visualization Tools Industry Volume (K Unit), by Country 2024 & 2032
- Figure 5: North America Advanced Visualization Tools Industry Revenue Share (%), by Country 2024 & 2032
- Figure 6: North America Advanced Visualization Tools Industry Volume Share (%), by Country 2024 & 2032
- Figure 7: Europe Advanced Visualization Tools Industry Revenue (Million), by Country 2024 & 2032
- Figure 8: Europe Advanced Visualization Tools Industry Volume (K Unit), by Country 2024 & 2032
- Figure 9: Europe Advanced Visualization Tools Industry Revenue Share (%), by Country 2024 & 2032
- Figure 10: Europe Advanced Visualization Tools Industry Volume Share (%), by Country 2024 & 2032
- Figure 11: Asia Pacific Advanced Visualization Tools Industry Revenue (Million), by Country 2024 & 2032
- Figure 12: Asia Pacific Advanced Visualization Tools Industry Volume (K Unit), by Country 2024 & 2032
- Figure 13: Asia Pacific Advanced Visualization Tools Industry Revenue Share (%), by Country 2024 & 2032
- Figure 14: Asia Pacific Advanced Visualization Tools Industry Volume Share (%), by Country 2024 & 2032
- Figure 15: Middle East and Africa Advanced Visualization Tools Industry Revenue (Million), by Country 2024 & 2032
- Figure 16: Middle East and Africa Advanced Visualization Tools Industry Volume (K Unit), by Country 2024 & 2032
- Figure 17: Middle East and Africa Advanced Visualization Tools Industry Revenue Share (%), by Country 2024 & 2032
- Figure 18: Middle East and Africa Advanced Visualization Tools Industry Volume Share (%), by Country 2024 & 2032
- Figure 19: South America Advanced Visualization Tools Industry Revenue (Million), by Country 2024 & 2032
- Figure 20: South America Advanced Visualization Tools Industry Volume (K Unit), by Country 2024 & 2032
- Figure 21: South America Advanced Visualization Tools Industry Revenue Share (%), by Country 2024 & 2032
- Figure 22: South America Advanced Visualization Tools Industry Volume Share (%), by Country 2024 & 2032
- Figure 23: North America Advanced Visualization Tools Industry Revenue (Million), by Product and Service 2024 & 2032
- Figure 24: North America Advanced Visualization Tools Industry Volume (K Unit), by Product and Service 2024 & 2032
- Figure 25: North America Advanced Visualization Tools Industry Revenue Share (%), by Product and Service 2024 & 2032
- Figure 26: North America Advanced Visualization Tools Industry Volume Share (%), by Product and Service 2024 & 2032
- Figure 27: North America Advanced Visualization Tools Industry Revenue (Million), by Type of Solution 2024 & 2032
- Figure 28: North America Advanced Visualization Tools Industry Volume (K Unit), by Type of Solution 2024 & 2032
- Figure 29: North America Advanced Visualization Tools Industry Revenue Share (%), by Type of Solution 2024 & 2032
- Figure 30: North America Advanced Visualization Tools Industry Volume Share (%), by Type of Solution 2024 & 2032
- Figure 31: North America Advanced Visualization Tools Industry Revenue (Million), by Imaging Modality 2024 & 2032
- Figure 32: North America Advanced Visualization Tools Industry Volume (K Unit), by Imaging Modality 2024 & 2032
- Figure 33: North America Advanced Visualization Tools Industry Revenue Share (%), by Imaging Modality 2024 & 2032
- Figure 34: North America Advanced Visualization Tools Industry Volume Share (%), by Imaging Modality 2024 & 2032
- Figure 35: North America Advanced Visualization Tools Industry Revenue (Million), by Clinical Application 2024 & 2032
- Figure 36: North America Advanced Visualization Tools Industry Volume (K Unit), by Clinical Application 2024 & 2032
- Figure 37: North America Advanced Visualization Tools Industry Revenue Share (%), by Clinical Application 2024 & 2032
- Figure 38: North America Advanced Visualization Tools Industry Volume Share (%), by Clinical Application 2024 & 2032
- Figure 39: North America Advanced Visualization Tools Industry Revenue (Million), by Country 2024 & 2032
- Figure 40: North America Advanced Visualization Tools Industry Volume (K Unit), by Country 2024 & 2032
- Figure 41: North America Advanced Visualization Tools Industry Revenue Share (%), by Country 2024 & 2032
- Figure 42: North America Advanced Visualization Tools Industry Volume Share (%), by Country 2024 & 2032
- Figure 43: Europe Advanced Visualization Tools Industry Revenue (Million), by Product and Service 2024 & 2032
- Figure 44: Europe Advanced Visualization Tools Industry Volume (K Unit), by Product and Service 2024 & 2032
- Figure 45: Europe Advanced Visualization Tools Industry Revenue Share (%), by Product and Service 2024 & 2032
- Figure 46: Europe Advanced Visualization Tools Industry Volume Share (%), by Product and Service 2024 & 2032
- Figure 47: Europe Advanced Visualization Tools Industry Revenue (Million), by Type of Solution 2024 & 2032
- Figure 48: Europe Advanced Visualization Tools Industry Volume (K Unit), by Type of Solution 2024 & 2032
- Figure 49: Europe Advanced Visualization Tools Industry Revenue Share (%), by Type of Solution 2024 & 2032
- Figure 50: Europe Advanced Visualization Tools Industry Volume Share (%), by Type of Solution 2024 & 2032
- Figure 51: Europe Advanced Visualization Tools Industry Revenue (Million), by Imaging Modality 2024 & 2032
- Figure 52: Europe Advanced Visualization Tools Industry Volume (K Unit), by Imaging Modality 2024 & 2032
- Figure 53: Europe Advanced Visualization Tools Industry Revenue Share (%), by Imaging Modality 2024 & 2032
- Figure 54: Europe Advanced Visualization Tools Industry Volume Share (%), by Imaging Modality 2024 & 2032
- Figure 55: Europe Advanced Visualization Tools Industry Revenue (Million), by Clinical Application 2024 & 2032
- Figure 56: Europe Advanced Visualization Tools Industry Volume (K Unit), by Clinical Application 2024 & 2032
- Figure 57: Europe Advanced Visualization Tools Industry Revenue Share (%), by Clinical Application 2024 & 2032
- Figure 58: Europe Advanced Visualization Tools Industry Volume Share (%), by Clinical Application 2024 & 2032
- Figure 59: Europe Advanced Visualization Tools Industry Revenue (Million), by Country 2024 & 2032
- Figure 60: Europe Advanced Visualization Tools Industry Volume (K Unit), by Country 2024 & 2032
- Figure 61: Europe Advanced Visualization Tools Industry Revenue Share (%), by Country 2024 & 2032
- Figure 62: Europe Advanced Visualization Tools Industry Volume Share (%), by Country 2024 & 2032
- Figure 63: Asia Pacific Advanced Visualization Tools Industry Revenue (Million), by Product and Service 2024 & 2032
- Figure 64: Asia Pacific Advanced Visualization Tools Industry Volume (K Unit), by Product and Service 2024 & 2032
- Figure 65: Asia Pacific Advanced Visualization Tools Industry Revenue Share (%), by Product and Service 2024 & 2032
- Figure 66: Asia Pacific Advanced Visualization Tools Industry Volume Share (%), by Product and Service 2024 & 2032
- Figure 67: Asia Pacific Advanced Visualization Tools Industry Revenue (Million), by Type of Solution 2024 & 2032
- Figure 68: Asia Pacific Advanced Visualization Tools Industry Volume (K Unit), by Type of Solution 2024 & 2032
- Figure 69: Asia Pacific Advanced Visualization Tools Industry Revenue Share (%), by Type of Solution 2024 & 2032
- Figure 70: Asia Pacific Advanced Visualization Tools Industry Volume Share (%), by Type of Solution 2024 & 2032
- Figure 71: Asia Pacific Advanced Visualization Tools Industry Revenue (Million), by Imaging Modality 2024 & 2032
- Figure 72: Asia Pacific Advanced Visualization Tools Industry Volume (K Unit), by Imaging Modality 2024 & 2032
- Figure 73: Asia Pacific Advanced Visualization Tools Industry Revenue Share (%), by Imaging Modality 2024 & 2032
- Figure 74: Asia Pacific Advanced Visualization Tools Industry Volume Share (%), by Imaging Modality 2024 & 2032
- Figure 75: Asia Pacific Advanced Visualization Tools Industry Revenue (Million), by Clinical Application 2024 & 2032
- Figure 76: Asia Pacific Advanced Visualization Tools Industry Volume (K Unit), by Clinical Application 2024 & 2032
- Figure 77: Asia Pacific Advanced Visualization Tools Industry Revenue Share (%), by Clinical Application 2024 & 2032
- Figure 78: Asia Pacific Advanced Visualization Tools Industry Volume Share (%), by Clinical Application 2024 & 2032
- Figure 79: Asia Pacific Advanced Visualization Tools Industry Revenue (Million), by Country 2024 & 2032
- Figure 80: Asia Pacific Advanced Visualization Tools Industry Volume (K Unit), by Country 2024 & 2032
- Figure 81: Asia Pacific Advanced Visualization Tools Industry Revenue Share (%), by Country 2024 & 2032
- Figure 82: Asia Pacific Advanced Visualization Tools Industry Volume Share (%), by Country 2024 & 2032
- Figure 83: Middle East and Africa Advanced Visualization Tools Industry Revenue (Million), by Product and Service 2024 & 2032
- Figure 84: Middle East and Africa Advanced Visualization Tools Industry Volume (K Unit), by Product and Service 2024 & 2032
- Figure 85: Middle East and Africa Advanced Visualization Tools Industry Revenue Share (%), by Product and Service 2024 & 2032
- Figure 86: Middle East and Africa Advanced Visualization Tools Industry Volume Share (%), by Product and Service 2024 & 2032
- Figure 87: Middle East and Africa Advanced Visualization Tools Industry Revenue (Million), by Type of Solution 2024 & 2032
- Figure 88: Middle East and Africa Advanced Visualization Tools Industry Volume (K Unit), by Type of Solution 2024 & 2032
- Figure 89: Middle East and Africa Advanced Visualization Tools Industry Revenue Share (%), by Type of Solution 2024 & 2032
- Figure 90: Middle East and Africa Advanced Visualization Tools Industry Volume Share (%), by Type of Solution 2024 & 2032
- Figure 91: Middle East and Africa Advanced Visualization Tools Industry Revenue (Million), by Imaging Modality 2024 & 2032
- Figure 92: Middle East and Africa Advanced Visualization Tools Industry Volume (K Unit), by Imaging Modality 2024 & 2032
- Figure 93: Middle East and Africa Advanced Visualization Tools Industry Revenue Share (%), by Imaging Modality 2024 & 2032
- Figure 94: Middle East and Africa Advanced Visualization Tools Industry Volume Share (%), by Imaging Modality 2024 & 2032
- Figure 95: Middle East and Africa Advanced Visualization Tools Industry Revenue (Million), by Clinical Application 2024 & 2032
- Figure 96: Middle East and Africa Advanced Visualization Tools Industry Volume (K Unit), by Clinical Application 2024 & 2032
- Figure 97: Middle East and Africa Advanced Visualization Tools Industry Revenue Share (%), by Clinical Application 2024 & 2032
- Figure 98: Middle East and Africa Advanced Visualization Tools Industry Volume Share (%), by Clinical Application 2024 & 2032
- Figure 99: Middle East and Africa Advanced Visualization Tools Industry Revenue (Million), by Country 2024 & 2032
- Figure 100: Middle East and Africa Advanced Visualization Tools Industry Volume (K Unit), by Country 2024 & 2032
- Figure 101: Middle East and Africa Advanced Visualization Tools Industry Revenue Share (%), by Country 2024 & 2032
- Figure 102: Middle East and Africa Advanced Visualization Tools Industry Volume Share (%), by Country 2024 & 2032
- Figure 103: South America Advanced Visualization Tools Industry Revenue (Million), by Product and Service 2024 & 2032
- Figure 104: South America Advanced Visualization Tools Industry Volume (K Unit), by Product and Service 2024 & 2032
- Figure 105: South America Advanced Visualization Tools Industry Revenue Share (%), by Product and Service 2024 & 2032
- Figure 106: South America Advanced Visualization Tools Industry Volume Share (%), by Product and Service 2024 & 2032
- Figure 107: South America Advanced Visualization Tools Industry Revenue (Million), by Type of Solution 2024 & 2032
- Figure 108: South America Advanced Visualization Tools Industry Volume (K Unit), by Type of Solution 2024 & 2032
- Figure 109: South America Advanced Visualization Tools Industry Revenue Share (%), by Type of Solution 2024 & 2032
- Figure 110: South America Advanced Visualization Tools Industry Volume Share (%), by Type of Solution 2024 & 2032
- Figure 111: South America Advanced Visualization Tools Industry Revenue (Million), by Imaging Modality 2024 & 2032
- Figure 112: South America Advanced Visualization Tools Industry Volume (K Unit), by Imaging Modality 2024 & 2032
- Figure 113: South America Advanced Visualization Tools Industry Revenue Share (%), by Imaging Modality 2024 & 2032
- Figure 114: South America Advanced Visualization Tools Industry Volume Share (%), by Imaging Modality 2024 & 2032
- Figure 115: South America Advanced Visualization Tools Industry Revenue (Million), by Clinical Application 2024 & 2032
- Figure 116: South America Advanced Visualization Tools Industry Volume (K Unit), by Clinical Application 2024 & 2032
- Figure 117: South America Advanced Visualization Tools Industry Revenue Share (%), by Clinical Application 2024 & 2032
- Figure 118: South America Advanced Visualization Tools Industry Volume Share (%), by Clinical Application 2024 & 2032
- Figure 119: South America Advanced Visualization Tools Industry Revenue (Million), by Country 2024 & 2032
- Figure 120: South America Advanced Visualization Tools Industry Volume (K Unit), by Country 2024 & 2032
- Figure 121: South America Advanced Visualization Tools Industry Revenue Share (%), by Country 2024 & 2032
- Figure 122: South America Advanced Visualization Tools Industry Volume Share (%), by Country 2024 & 2032
List of Tables
- Table 1: Global Advanced Visualization Tools Industry Revenue Million Forecast, by Region 2019 & 2032
- Table 2: Global Advanced Visualization Tools Industry Volume K Unit Forecast, by Region 2019 & 2032
- Table 3: Global Advanced Visualization Tools Industry Revenue Million Forecast, by Product and Service 2019 & 2032
- Table 4: Global Advanced Visualization Tools Industry Volume K Unit Forecast, by Product and Service 2019 & 2032
- Table 5: Global Advanced Visualization Tools Industry Revenue Million Forecast, by Type of Solution 2019 & 2032
- Table 6: Global Advanced Visualization Tools Industry Volume K Unit Forecast, by Type of Solution 2019 & 2032
- Table 7: Global Advanced Visualization Tools Industry Revenue Million Forecast, by Imaging Modality 2019 & 2032
- Table 8: Global Advanced Visualization Tools Industry Volume K Unit Forecast, by Imaging Modality 2019 & 2032
- Table 9: Global Advanced Visualization Tools Industry Revenue Million Forecast, by Clinical Application 2019 & 2032
- Table 10: Global Advanced Visualization Tools Industry Volume K Unit Forecast, by Clinical Application 2019 & 2032
- Table 11: Global Advanced Visualization Tools Industry Revenue Million Forecast, by Region 2019 & 2032
- Table 12: Global Advanced Visualization Tools Industry Volume K Unit Forecast, by Region 2019 & 2032
- Table 13: Global Advanced Visualization Tools Industry Revenue Million Forecast, by Country 2019 & 2032
- Table 14: Global Advanced Visualization Tools Industry Volume K Unit Forecast, by Country 2019 & 2032
- Table 15: United States Advanced Visualization Tools Industry Revenue (Million) Forecast, by Application 2019 & 2032
- Table 16: United States Advanced Visualization Tools Industry Volume (K Unit) Forecast, by Application 2019 & 2032
- Table 17: Canada Advanced Visualization Tools Industry Revenue (Million) Forecast, by Application 2019 & 2032
- Table 18: Canada Advanced Visualization Tools Industry Volume (K Unit) Forecast, by Application 2019 & 2032
- Table 19: Mexico Advanced Visualization Tools Industry Revenue (Million) Forecast, by Application 2019 & 2032
- Table 20: Mexico Advanced Visualization Tools Industry Volume (K Unit) Forecast, by Application 2019 & 2032
- Table 21: Global Advanced Visualization Tools Industry Revenue Million Forecast, by Country 2019 & 2032
- Table 22: Global Advanced Visualization Tools Industry Volume K Unit Forecast, by Country 2019 & 2032
- Table 23: Germany Advanced Visualization Tools Industry Revenue (Million) Forecast, by Application 2019 & 2032
- Table 24: Germany Advanced Visualization Tools Industry Volume (K Unit) Forecast, by Application 2019 & 2032
- Table 25: United Kingdom Advanced Visualization Tools Industry Revenue (Million) Forecast, by Application 2019 & 2032
- Table 26: United Kingdom Advanced Visualization Tools Industry Volume (K Unit) Forecast, by Application 2019 & 2032
- Table 27: France Advanced Visualization Tools Industry Revenue (Million) Forecast, by Application 2019 & 2032
- Table 28: France Advanced Visualization Tools Industry Volume (K Unit) Forecast, by Application 2019 & 2032
- Table 29: Italy Advanced Visualization Tools Industry Revenue (Million) Forecast, by Application 2019 & 2032
- Table 30: Italy Advanced Visualization Tools Industry Volume (K Unit) Forecast, by Application 2019 & 2032
- Table 31: Spain Advanced Visualization Tools Industry Revenue (Million) Forecast, by Application 2019 & 2032
- Table 32: Spain Advanced Visualization Tools Industry Volume (K Unit) Forecast, by Application 2019 & 2032
- Table 33: Rest of Europe Advanced Visualization Tools Industry Revenue (Million) Forecast, by Application 2019 & 2032
- Table 34: Rest of Europe Advanced Visualization Tools Industry Volume (K Unit) Forecast, by Application 2019 & 2032
- Table 35: Global Advanced Visualization Tools Industry Revenue Million Forecast, by Country 2019 & 2032
- Table 36: Global Advanced Visualization Tools Industry Volume K Unit Forecast, by Country 2019 & 2032
- Table 37: China Advanced Visualization Tools Industry Revenue (Million) Forecast, by Application 2019 & 2032
- Table 38: China Advanced Visualization Tools Industry Volume (K Unit) Forecast, by Application 2019 & 2032
- Table 39: Japan Advanced Visualization Tools Industry Revenue (Million) Forecast, by Application 2019 & 2032
- Table 40: Japan Advanced Visualization Tools Industry Volume (K Unit) Forecast, by Application 2019 & 2032
- Table 41: India Advanced Visualization Tools Industry Revenue (Million) Forecast, by Application 2019 & 2032
- Table 42: India Advanced Visualization Tools Industry Volume (K Unit) Forecast, by Application 2019 & 2032
- Table 43: Australia Advanced Visualization Tools Industry Revenue (Million) Forecast, by Application 2019 & 2032
- Table 44: Australia Advanced Visualization Tools Industry Volume (K Unit) Forecast, by Application 2019 & 2032
- Table 45: South Korea Advanced Visualization Tools Industry Revenue (Million) Forecast, by Application 2019 & 2032
- Table 46: South Korea Advanced Visualization Tools Industry Volume (K Unit) Forecast, by Application 2019 & 2032
- Table 47: Rest of Asia Pacific Advanced Visualization Tools Industry Revenue (Million) Forecast, by Application 2019 & 2032
- Table 48: Rest of Asia Pacific Advanced Visualization Tools Industry Volume (K Unit) Forecast, by Application 2019 & 2032
- Table 49: Global Advanced Visualization Tools Industry Revenue Million Forecast, by Country 2019 & 2032
- Table 50: Global Advanced Visualization Tools Industry Volume K Unit Forecast, by Country 2019 & 2032
- Table 51: GCC Advanced Visualization Tools Industry Revenue (Million) Forecast, by Application 2019 & 2032
- Table 52: GCC Advanced Visualization Tools Industry Volume (K Unit) Forecast, by Application 2019 & 2032
- Table 53: South Africa Advanced Visualization Tools Industry Revenue (Million) Forecast, by Application 2019 & 2032
- Table 54: South Africa Advanced Visualization Tools Industry Volume (K Unit) Forecast, by Application 2019 & 2032
- Table 55: Rest of Middle East and Africa Advanced Visualization Tools Industry Revenue (Million) Forecast, by Application 2019 & 2032
- Table 56: Rest of Middle East and Africa Advanced Visualization Tools Industry Volume (K Unit) Forecast, by Application 2019 & 2032
- Table 57: Global Advanced Visualization Tools Industry Revenue Million Forecast, by Country 2019 & 2032
- Table 58: Global Advanced Visualization Tools Industry Volume K Unit Forecast, by Country 2019 & 2032
- Table 59: Brazil Advanced Visualization Tools Industry Revenue (Million) Forecast, by Application 2019 & 2032
- Table 60: Brazil Advanced Visualization Tools Industry Volume (K Unit) Forecast, by Application 2019 & 2032
- Table 61: Argentina Advanced Visualization Tools Industry Revenue (Million) Forecast, by Application 2019 & 2032
- Table 62: Argentina Advanced Visualization Tools Industry Volume (K Unit) Forecast, by Application 2019 & 2032
- Table 63: Rest of South America Advanced Visualization Tools Industry Revenue (Million) Forecast, by Application 2019 & 2032
- Table 64: Rest of South America Advanced Visualization Tools Industry Volume (K Unit) Forecast, by Application 2019 & 2032
- Table 65: Global Advanced Visualization Tools Industry Revenue Million Forecast, by Product and Service 2019 & 2032
- Table 66: Global Advanced Visualization Tools Industry Volume K Unit Forecast, by Product and Service 2019 & 2032
- Table 67: Global Advanced Visualization Tools Industry Revenue Million Forecast, by Type of Solution 2019 & 2032
- Table 68: Global Advanced Visualization Tools Industry Volume K Unit Forecast, by Type of Solution 2019 & 2032
- Table 69: Global Advanced Visualization Tools Industry Revenue Million Forecast, by Imaging Modality 2019 & 2032
- Table 70: Global Advanced Visualization Tools Industry Volume K Unit Forecast, by Imaging Modality 2019 & 2032
- Table 71: Global Advanced Visualization Tools Industry Revenue Million Forecast, by Clinical Application 2019 & 2032
- Table 72: Global Advanced Visualization Tools Industry Volume K Unit Forecast, by Clinical Application 2019 & 2032
- Table 73: Global Advanced Visualization Tools Industry Revenue Million Forecast, by Country 2019 & 2032
- Table 74: Global Advanced Visualization Tools Industry Volume K Unit Forecast, by Country 2019 & 2032
- Table 75: United States Advanced Visualization Tools Industry Revenue (Million) Forecast, by Application 2019 & 2032
- Table 76: United States Advanced Visualization Tools Industry Volume (K Unit) Forecast, by Application 2019 & 2032
- Table 77: Canada Advanced Visualization Tools Industry Revenue (Million) Forecast, by Application 2019 & 2032
- Table 78: Canada Advanced Visualization Tools Industry Volume (K Unit) Forecast, by Application 2019 & 2032
- Table 79: Mexico Advanced Visualization Tools Industry Revenue (Million) Forecast, by Application 2019 & 2032
- Table 80: Mexico Advanced Visualization Tools Industry Volume (K Unit) Forecast, by Application 2019 & 2032
- Table 81: Global Advanced Visualization Tools Industry Revenue Million Forecast, by Product and Service 2019 & 2032
- Table 82: Global Advanced Visualization Tools Industry Volume K Unit Forecast, by Product and Service 2019 & 2032
- Table 83: Global Advanced Visualization Tools Industry Revenue Million Forecast, by Type of Solution 2019 & 2032
- Table 84: Global Advanced Visualization Tools Industry Volume K Unit Forecast, by Type of Solution 2019 & 2032
- Table 85: Global Advanced Visualization Tools Industry Revenue Million Forecast, by Imaging Modality 2019 & 2032
- Table 86: Global Advanced Visualization Tools Industry Volume K Unit Forecast, by Imaging Modality 2019 & 2032
- Table 87: Global Advanced Visualization Tools Industry Revenue Million Forecast, by Clinical Application 2019 & 2032
- Table 88: Global Advanced Visualization Tools Industry Volume K Unit Forecast, by Clinical Application 2019 & 2032
- Table 89: Global Advanced Visualization Tools Industry Revenue Million Forecast, by Country 2019 & 2032
- Table 90: Global Advanced Visualization Tools Industry Volume K Unit Forecast, by Country 2019 & 2032
- Table 91: Germany Advanced Visualization Tools Industry Revenue (Million) Forecast, by Application 2019 & 2032
- Table 92: Germany Advanced Visualization Tools Industry Volume (K Unit) Forecast, by Application 2019 & 2032
- Table 93: United Kingdom Advanced Visualization Tools Industry Revenue (Million) Forecast, by Application 2019 & 2032
- Table 94: United Kingdom Advanced Visualization Tools Industry Volume (K Unit) Forecast, by Application 2019 & 2032
- Table 95: France Advanced Visualization Tools Industry Revenue (Million) Forecast, by Application 2019 & 2032
- Table 96: France Advanced Visualization Tools Industry Volume (K Unit) Forecast, by Application 2019 & 2032
- Table 97: Italy Advanced Visualization Tools Industry Revenue (Million) Forecast, by Application 2019 & 2032
- Table 98: Italy Advanced Visualization Tools Industry Volume (K Unit) Forecast, by Application 2019 & 2032
- Table 99: Spain Advanced Visualization Tools Industry Revenue (Million) Forecast, by Application 2019 & 2032
- Table 100: Spain Advanced Visualization Tools Industry Volume (K Unit) Forecast, by Application 2019 & 2032
- Table 101: Rest of Europe Advanced Visualization Tools Industry Revenue (Million) Forecast, by Application 2019 & 2032
- Table 102: Rest of Europe Advanced Visualization Tools Industry Volume (K Unit) Forecast, by Application 2019 & 2032
- Table 103: Global Advanced Visualization Tools Industry Revenue Million Forecast, by Product and Service 2019 & 2032
- Table 104: Global Advanced Visualization Tools Industry Volume K Unit Forecast, by Product and Service 2019 & 2032
- Table 105: Global Advanced Visualization Tools Industry Revenue Million Forecast, by Type of Solution 2019 & 2032
- Table 106: Global Advanced Visualization Tools Industry Volume K Unit Forecast, by Type of Solution 2019 & 2032
- Table 107: Global Advanced Visualization Tools Industry Revenue Million Forecast, by Imaging Modality 2019 & 2032
- Table 108: Global Advanced Visualization Tools Industry Volume K Unit Forecast, by Imaging Modality 2019 & 2032
- Table 109: Global Advanced Visualization Tools Industry Revenue Million Forecast, by Clinical Application 2019 & 2032
- Table 110: Global Advanced Visualization Tools Industry Volume K Unit Forecast, by Clinical Application 2019 & 2032
- Table 111: Global Advanced Visualization Tools Industry Revenue Million Forecast, by Country 2019 & 2032
- Table 112: Global Advanced Visualization Tools Industry Volume K Unit Forecast, by Country 2019 & 2032
- Table 113: China Advanced Visualization Tools Industry Revenue (Million) Forecast, by Application 2019 & 2032
- Table 114: China Advanced Visualization Tools Industry Volume (K Unit) Forecast, by Application 2019 & 2032
- Table 115: Japan Advanced Visualization Tools Industry Revenue (Million) Forecast, by Application 2019 & 2032
- Table 116: Japan Advanced Visualization Tools Industry Volume (K Unit) Forecast, by Application 2019 & 2032
- Table 117: India Advanced Visualization Tools Industry Revenue (Million) Forecast, by Application 2019 & 2032
- Table 118: India Advanced Visualization Tools Industry Volume (K Unit) Forecast, by Application 2019 & 2032
- Table 119: Australia Advanced Visualization Tools Industry Revenue (Million) Forecast, by Application 2019 & 2032
- Table 120: Australia Advanced Visualization Tools Industry Volume (K Unit) Forecast, by Application 2019 & 2032
- Table 121: South Korea Advanced Visualization Tools Industry Revenue (Million) Forecast, by Application 2019 & 2032
- Table 122: South Korea Advanced Visualization Tools Industry Volume (K Unit) Forecast, by Application 2019 & 2032
- Table 123: Rest of Asia Pacific Advanced Visualization Tools Industry Revenue (Million) Forecast, by Application 2019 & 2032
- Table 124: Rest of Asia Pacific Advanced Visualization Tools Industry Volume (K Unit) Forecast, by Application 2019 & 2032
- Table 125: Global Advanced Visualization Tools Industry Revenue Million Forecast, by Product and Service 2019 & 2032
- Table 126: Global Advanced Visualization Tools Industry Volume K Unit Forecast, by Product and Service 2019 & 2032
- Table 127: Global Advanced Visualization Tools Industry Revenue Million Forecast, by Type of Solution 2019 & 2032
- Table 128: Global Advanced Visualization Tools Industry Volume K Unit Forecast, by Type of Solution 2019 & 2032
- Table 129: Global Advanced Visualization Tools Industry Revenue Million Forecast, by Imaging Modality 2019 & 2032
- Table 130: Global Advanced Visualization Tools Industry Volume K Unit Forecast, by Imaging Modality 2019 & 2032
- Table 131: Global Advanced Visualization Tools Industry Revenue Million Forecast, by Clinical Application 2019 & 2032
- Table 132: Global Advanced Visualization Tools Industry Volume K Unit Forecast, by Clinical Application 2019 & 2032
- Table 133: Global Advanced Visualization Tools Industry Revenue Million Forecast, by Country 2019 & 2032
- Table 134: Global Advanced Visualization Tools Industry Volume K Unit Forecast, by Country 2019 & 2032
- Table 135: GCC Advanced Visualization Tools Industry Revenue (Million) Forecast, by Application 2019 & 2032
- Table 136: GCC Advanced Visualization Tools Industry Volume (K Unit) Forecast, by Application 2019 & 2032
- Table 137: South Africa Advanced Visualization Tools Industry Revenue (Million) Forecast, by Application 2019 & 2032
- Table 138: South Africa Advanced Visualization Tools Industry Volume (K Unit) Forecast, by Application 2019 & 2032
- Table 139: Rest of Middle East and Africa Advanced Visualization Tools Industry Revenue (Million) Forecast, by Application 2019 & 2032
- Table 140: Rest of Middle East and Africa Advanced Visualization Tools Industry Volume (K Unit) Forecast, by Application 2019 & 2032
- Table 141: Global Advanced Visualization Tools Industry Revenue Million Forecast, by Product and Service 2019 & 2032
- Table 142: Global Advanced Visualization Tools Industry Volume K Unit Forecast, by Product and Service 2019 & 2032
- Table 143: Global Advanced Visualization Tools Industry Revenue Million Forecast, by Type of Solution 2019 & 2032
- Table 144: Global Advanced Visualization Tools Industry Volume K Unit Forecast, by Type of Solution 2019 & 2032
- Table 145: Global Advanced Visualization Tools Industry Revenue Million Forecast, by Imaging Modality 2019 & 2032
- Table 146: Global Advanced Visualization Tools Industry Volume K Unit Forecast, by Imaging Modality 2019 & 2032
- Table 147: Global Advanced Visualization Tools Industry Revenue Million Forecast, by Clinical Application 2019 & 2032
- Table 148: Global Advanced Visualization Tools Industry Volume K Unit Forecast, by Clinical Application 2019 & 2032
- Table 149: Global Advanced Visualization Tools Industry Revenue Million Forecast, by Country 2019 & 2032
- Table 150: Global Advanced Visualization Tools Industry Volume K Unit Forecast, by Country 2019 & 2032
- Table 151: Brazil Advanced Visualization Tools Industry Revenue (Million) Forecast, by Application 2019 & 2032
- Table 152: Brazil Advanced Visualization Tools Industry Volume (K Unit) Forecast, by Application 2019 & 2032
- Table 153: Argentina Advanced Visualization Tools Industry Revenue (Million) Forecast, by Application 2019 & 2032
- Table 154: Argentina Advanced Visualization Tools Industry Volume (K Unit) Forecast, by Application 2019 & 2032
- Table 155: Rest of South America Advanced Visualization Tools Industry Revenue (Million) Forecast, by Application 2019 & 2032
- Table 156: Rest of South America Advanced Visualization Tools Industry Volume (K Unit) Forecast, by Application 2019 & 2032
Frequently Asked Questions
1. What is the projected Compound Annual Growth Rate (CAGR) of the Advanced Visualization Tools Industry?
The projected CAGR is approximately 11.30%.
2. Which companies are prominent players in the Advanced Visualization Tools Industry?
Key companies in the market include Siemens Healthcare GmbH, Canon Inc (Canon Medical Systems Corporation), Terarecon Inc , Carestream Health, General Electric Company (GE Healthcare), Koninklijke Philips NV, Pro Medicus Ltd, Agfa-Gevaert Group, Fujifilm Holdings Corporation.
3. What are the main segments of the Advanced Visualization Tools Industry?
The market segments include Product and Service, Type of Solution, Imaging Modality, Clinical Application.
4. Can you provide details about the market size?
The market size is estimated to be USD XX Million as of 2022.
5. What are some drivers contributing to market growth?
Increasing Prevalence of Chronic Diseases Coupled With Growing Geriatric Population; Rising Awareness of Benefits associated with Advanced Visualization Tools in Disease Diagnosis.
6. What are the notable trends driving market growth?
Oncology Under Clinical Application Expected to Grow Over the Forecast Period.
7. Are there any restraints impacting market growth?
Limited Availability of Reimbursements for Radiology-Based Diagnostic Procedures.
8. Can you provide examples of recent developments in the market?
August 2022: Kitware launched MIQA, a cloud-based application for medical image quality assurance. It facilitates collaboration and longitudinal studies by geographically diverse teams.
9. What pricing options are available for accessing the report?
Pricing options include single-user, multi-user, and enterprise licenses priced at USD 4750, USD 5250, and USD 8750 respectively.
10. Is the market size provided in terms of value or volume?
The market size is provided in terms of value, measured in Million and volume, measured in K Unit.
11. Are there any specific market keywords associated with the report?
Yes, the market keyword associated with the report is "Advanced Visualization Tools Industry," which aids in identifying and referencing the specific market segment covered.
12. How do I determine which pricing option suits my needs best?
The pricing options vary based on user requirements and access needs. Individual users may opt for single-user licenses, while businesses requiring broader access may choose multi-user or enterprise licenses for cost-effective access to the report.
13. Are there any additional resources or data provided in the Advanced Visualization Tools Industry report?
While the report offers comprehensive insights, it's advisable to review the specific contents or supplementary materials provided to ascertain if additional resources or data are available.
14. How can I stay updated on further developments or reports in the Advanced Visualization Tools Industry?
To stay informed about further developments, trends, and reports in the Advanced Visualization Tools Industry, consider subscribing to industry newsletters, following relevant companies and organizations, or regularly checking reputable industry news sources and publications.
Methodology
Step 1 - Identification of Relevant Samples Size from Population Database


Step 2 - Approaches for Defining Global Market Size (Value, Volume* & Price*)

Note*: In applicable scenarios
Step 3 - Data Sources
Primary Research
- Web Analytics
- Survey Reports
- Research Institute
- Latest Research Reports
- Opinion Leaders
Secondary Research
- Annual Reports
- White Paper
- Latest Press Release
- Industry Association
- Paid Database
- Investor Presentations

Step 4 - Data Triangulation
Involves using different sources of information in order to increase the validity of a study
These sources are likely to be stakeholders in a program - participants, other researchers, program staff, other community members, and so on.
Then we put all data in single framework & apply various statistical tools to find out the dynamic on the market.
During the analysis stage, feedback from the stakeholder groups would be compared to determine areas of agreement as well as areas of divergence


