
Key Insights
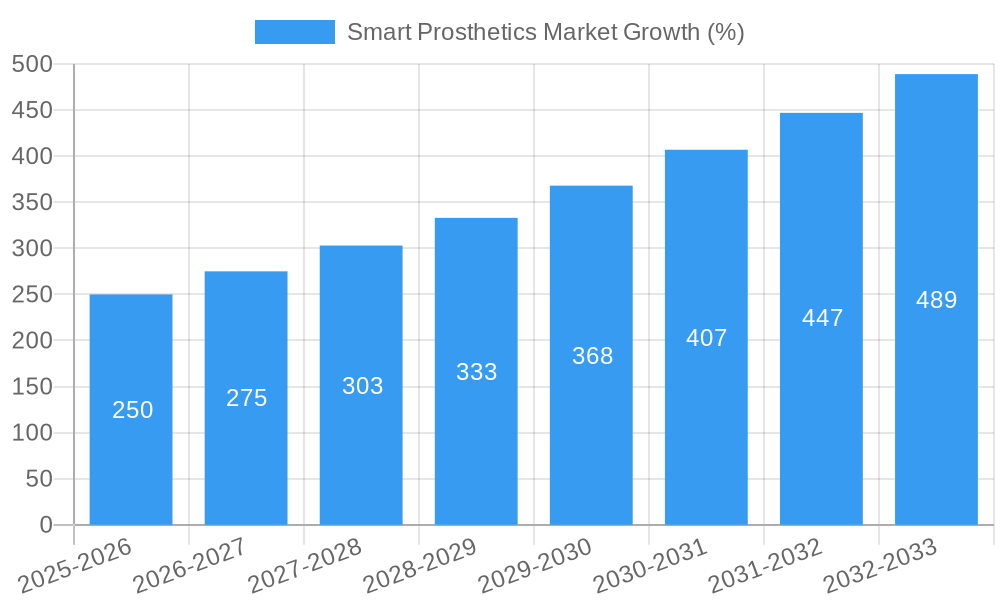
The global smart prosthetics market is experiencing robust growth, driven by technological advancements, increasing prevalence of limb loss due to accidents and diseases, and rising demand for improved quality of life among amputees. The market's Compound Annual Growth Rate (CAGR) of 10.50% from 2019 to 2024 suggests a significant expansion, projected to continue throughout the forecast period (2025-2033). Key drivers include the development of sophisticated sensor technologies enabling intuitive control, the integration of artificial intelligence for personalized prosthetic functions, and the rising adoption of advanced materials enhancing comfort and durability. Market segmentation reveals a significant demand for lower body prosthetics, reflecting the higher prevalence of lower limb amputations. Prosthetic clinics and hospitals represent major end-users, indicating the crucial role of healthcare professionals in the adoption and fitting of smart prosthetics. Competitive landscape analysis reveals a dynamic mix of established players like Ottobock and Ossur, alongside emerging innovative companies like Open Bionics and Esper Bionics, driving innovation and competition. The North American market currently holds a significant share, driven by high healthcare expenditure and technological advancements. However, Asia Pacific is expected to witness substantial growth due to its large population and increasing healthcare infrastructure.
The market faces challenges such as the high cost of smart prosthetics limiting accessibility, particularly in developing economies. Furthermore, regulatory hurdles and the need for comprehensive rehabilitation programs can impede market penetration. Despite these restraints, the ongoing research and development efforts in areas such as bio-integration, advanced control systems, and personalized prosthetics will fuel future market expansion. The increasing awareness of smart prosthetic benefits, coupled with technological advancements, is expected to overcome these challenges, creating opportunities for market expansion and wider accessibility in the coming years. Further research into areas like myoelectric control advancements and improved battery technology will be vital in overcoming existing limitations. The market's growth trajectory indicates a significant potential for investment and innovation in the smart prosthetics industry.
Smart Prosthetics Market: A Comprehensive Report (2019-2033)
This in-depth report provides a comprehensive analysis of the global Smart Prosthetics Market, covering market size, growth drivers, competitive landscape, and future outlook. The study period spans from 2019 to 2033, with 2025 as the base and estimated year. The report offers actionable insights for stakeholders across the value chain, including manufacturers, distributors, and healthcare providers. The market is segmented by end-user (Prosthetic Clinics, Hospitals, Rehabilitation Centers, Other End Users) and product type (Lower Body Prosthetics, Upper Body Prosthetics). Key players analyzed include Esper Bionics, Steeper Group, Blatchford Limited, Sarcos Technology and Robotic Corporation, Open Bionics, Ossur (Touch Bionics Inc), Esko Bionics, SynTouch Inc, Ottobock, Manta Product Development, and HDT Global. The report projects a robust CAGR of xx% during the forecast period (2025-2033), driven by technological advancements and increasing demand.

Smart Prosthetics Market Market Structure & Competitive Dynamics
The Smart Prosthetics market is characterized by a moderately concentrated landscape, with a few major players holding significant market share. However, the presence of numerous smaller companies, particularly in the area of innovative prosthetic designs, fosters a dynamic competitive environment. The market structure is influenced by factors such as stringent regulatory frameworks governing medical devices, the availability of product substitutes (e.g., traditional prosthetics), and ongoing mergers and acquisitions (M&A) activities.
- Market Concentration: The top 5 companies account for approximately xx% of the global market share in 2025, indicating moderate concentration.
- Innovation Ecosystem: A robust ecosystem of research institutions, startups, and established companies drives innovation in materials, sensors, and control algorithms.
- Regulatory Frameworks: Stringent regulatory approvals (e.g., FDA in the US, CE marking in Europe) influence product development and market entry strategies.
- Product Substitutes: Traditional, non-smart prosthetics remain a significant substitute, particularly in price-sensitive markets. However, the superior functionality of smart prosthetics is gradually increasing their adoption rate.
- M&A Activities: The market has witnessed several strategic M&A deals in recent years, with deal values ranging from xx Million to xx Million, aimed at expanding product portfolios and geographical reach. Examples include [Insert specific examples if available, otherwise leave blank].
Smart Prosthetics Market Industry Trends & Insights
The Smart Prosthetics market is experiencing robust growth, driven by a confluence of factors. Technological advancements, such as the incorporation of advanced sensors, artificial intelligence (AI), and machine learning (ML), are enhancing the functionality and user experience of smart prosthetics. These improvements are increasing market penetration, particularly among younger amputees who are more technology-savvy. The rising prevalence of limb loss due to accidents, diseases (e.g., diabetes), and aging populations is further fueling market growth. Consumer preferences are shifting towards more intuitive, comfortable, and aesthetically pleasing prosthetics. Competitive dynamics are marked by ongoing innovation, strategic partnerships, and a focus on personalized solutions. The market is projected to witness a CAGR of xx% from 2025 to 2033.
Dominant Markets & Segments in Smart Prosthetics Market
The Smart Prosthetics market is experiencing significant growth, with North America currently holding the leading position, followed closely by Europe. This dominance is largely attributed to several key factors: high healthcare expenditure and robust insurance coverage, advanced medical infrastructure and readily available advanced technologies, a high level of awareness among amputees regarding the benefits of advanced prosthetic options, and a strong presence of major market players and robust R&D centers. However, developing regions are showing increasing potential due to supportive government initiatives and rising healthcare accessibility.
Leading Regions: North America and Europe
Key Drivers for North American and European Dominance:
- High healthcare expenditure and comprehensive insurance coverage.
- Well-established healthcare infrastructure supporting advanced medical technology adoption.
- High awareness and acceptance of advanced prosthetic options among amputees and healthcare professionals.
- Significant presence of major market players and active R&D investment.
Leading Product Segment: Lower limb prosthetics remain the dominant segment, driven by the higher incidence of lower limb amputations compared to upper limb amputations. However, advancements in upper limb prosthetics are rapidly closing the gap.
Leading End-User Segment: Hospitals and specialized prosthetic clinics continue to be major end-users due to their well-equipped facilities and access to skilled professionals for prosthetic fitting, adjustment, and rehabilitation. However, the increasing availability of home-based care and telehealth options is expanding the end-user base.
Smart Prosthetics Market Product Innovations
Recent innovations in smart prosthetics are focusing on enhanced user control, improved comfort, and better integration with the user's nervous system. This includes the use of advanced sensors, AI-powered algorithms for intuitive control, and the development of more biocompatible materials for improved comfort and reduced risk of skin irritation. The integration of myoelectric sensors, allowing for more natural movement control, and advancements in osseointegration, where the prosthesis is directly connected to the bone, are improving prosthesis functionality and restoring natural movement. These advancements lead to superior market fit, attracting a wider range of users and improving their quality of life.
Report Segmentation & Scope
The Smart Prosthetics Market is segmented by end-user and product type.
End-User: This segment includes Prosthetic Clinics, Hospitals, Rehabilitation Centers, and Other End Users. The growth rate of each segment varies, with hospitals and prosthetic clinics exhibiting the highest growth due to their established infrastructure and expertise in handling advanced prosthetics. Market size projections indicate xx Million for Hospitals in 2033, xx Million for Prosthetic Clinics, and xx Million for Rehabilitation Centers.
Product Type: The market is further divided into Lower Body Prosthetics and Upper Body Prosthetics. Lower body prosthetics currently hold a larger market share due to the higher prevalence of lower limb amputations. However, advancements in upper body prosthetics are expected to drive growth in this segment. Growth projections estimate xx Million for Lower Body Prosthetics and xx Million for Upper Body Prosthetics by 2033.
Key Drivers of Smart Prosthetics Market Growth
The remarkable expansion of the Smart Prosthetics market is fueled by a convergence of factors. Rapid technological advancements in artificial intelligence (AI), machine learning, and sophisticated sensor technologies are significantly enhancing the functionality, comfort, and intuitive control of prosthetic limbs. The increasing prevalence of limb loss due to accidents, diseases such as diabetes, and the aging global population is expanding the overall target market. Furthermore, rising healthcare expenditure and improved insurance coverage in developed nations are improving affordability, while supportive government policies and initiatives in developing countries are promoting greater accessibility to these life-changing technologies. The growing demand for improved quality of life and increased independence among amputees is another significant driving force.
Challenges in the Smart Prosthetics Market Sector
The Smart Prosthetics market faces challenges such as high costs associated with manufacturing and maintenance of these sophisticated devices, potentially limiting their accessibility, especially in developing economies. Strict regulatory requirements for medical devices lengthen the approval process and increase development costs. Furthermore, supply chain disruptions and competition from established players with deep pockets represent significant hurdles. The high initial investment and ongoing maintenance cost impact the market penetration significantly.
Leading Players in the Smart Prosthetics Market Market
- Esper Bionics
- Steeper Group
- Blatchford Limited
- Sarcos Technology and Robotic Corporation
- Open Bionics
- Ossur (Touch Bionics Inc)
- Esko Bionics
- SynTouch Inc
- Ottobock
- Manta Product Development
- HDT Global
Key Developments in Smart Prosthetics Market Sector
September 2023: The Indian Space Research Organisation (ISRO) developed an innovative intelligent artificial limb weighing only 1.6kg, enabling above-knee amputees to walk approximately 100 meters with minimal support. This development significantly improves mobility and independence for amputees.
February 2022: Össur launched its POWER KNEE, a state-of-the-art actively powered microprocessor prosthetic knee. This revolutionary technology enhances mobility and allows for real-time adjustments, significantly improving the user experience for above-knee amputees.
Ongoing Developments: Research and development efforts are focused on improving areas such as biointegration (seamless connection between the prosthetic and the body), advanced control systems utilizing brain-computer interfaces, personalized prosthetic design based on individual needs and biomechanics, and the development of more affordable, accessible prosthetics for broader global adoption.
Strategic Smart Prosthetics Market Market Outlook
The Smart Prosthetics market presents substantial growth potential, driven by continuous technological advancements and the increasing demand for improved prosthetic solutions. Future opportunities lie in personalized prosthetics, enhanced user interfaces, improved biointegration, and the development of more affordable solutions for broader accessibility. Strategic partnerships between technology companies, healthcare providers, and research institutions will further accelerate market growth and expand market penetration in developing regions.
Smart Prosthetics Market Segmentation
-
1. Product
-
1.1. Lower Body Prosthetics
- 1.1.1. Prosthetic Knee
- 1.1.2. Prosthetic Ankle
- 1.1.3. Other Lower Body Prosthetics
-
1.2. Upper Body Prosthetics
- 1.2.1. Prosthetic Arm
- 1.2.2. Prosthetic Hand
- 1.2.3. Other Upper Body Prosthetics
-
1.1. Lower Body Prosthetics
-
2. End User
- 2.1. Prosthetic Clinics
- 2.2. Hospitals
- 2.3. Rehabilitation Center
- 2.4. Other End Users
Smart Prosthetics Market Segmentation By Geography
-
1. North America
- 1.1. United States
- 1.2. Canada
- 1.3. Mexico
-
2. Europe
- 2.1. Germany
- 2.2. United Kingdom
- 2.3. France
- 2.4. Italy
- 2.5. Spain
- 2.6. Rest of Europe
-
3. Asia Pacific
- 3.1. China
- 3.2. Japan
- 3.3. India
- 3.4. Australia
- 3.5. South Korea
- 3.6. Rest of Asia Pacific
-
4. Middle East and Africa
- 4.1. GCC
- 4.2. South Africa
- 4.3. Rest of Middle East and Africa
-
5. South America
- 5.1. Brazil
- 5.2. Argentina
- 5.3. Rest of South America

Smart Prosthetics Market REPORT HIGHLIGHTS
| Aspects | Details |
|---|---|
| Study Period | 2019-2033 |
| Base Year | 2024 |
| Estimated Year | 2025 |
| Forecast Period | 2025-2033 |
| Historical Period | 2019-2024 |
| Growth Rate | CAGR of 10.50% from 2019-2033 |
| Segmentation |
|
Table of Contents
- 1. Introduction
- 1.1. Research Scope
- 1.2. Market Segmentation
- 1.3. Research Methodology
- 1.4. Definitions and Assumptions
- 2. Executive Summary
- 2.1. Introduction
- 3. Market Dynamics
- 3.1. Introduction
- 3.2. Market Drivers
- 3.2.1 Growing Number of Sports Injuries and Road Accidents; Increasing Burden of Critical Limb Ischemia
- 3.2.2 Diabetes-Related Amputations and Rising Geriatric Population; Technological Advancements In Smart Prosthetics
- 3.3. Market Restrains
- 3.3.1. Lack of Developed Healthcare Infrastructure in Developing and Under-developed Countries; High Cost of Artificial Intelligence Prosthetics
- 3.4. Market Trends
- 3.4.1. Prosthetic Hand Segment Expects to Register a Significant Growth Over the Forecast Period
- 4. Market Factor Analysis
- 4.1. Porters Five Forces
- 4.2. Supply/Value Chain
- 4.3. PESTEL analysis
- 4.4. Market Entropy
- 4.5. Patent/Trademark Analysis
- 5. Global Smart Prosthetics Market Analysis, Insights and Forecast, 2019-2031
- 5.1. Market Analysis, Insights and Forecast - by Product
- 5.1.1. Lower Body Prosthetics
- 5.1.1.1. Prosthetic Knee
- 5.1.1.2. Prosthetic Ankle
- 5.1.1.3. Other Lower Body Prosthetics
- 5.1.2. Upper Body Prosthetics
- 5.1.2.1. Prosthetic Arm
- 5.1.2.2. Prosthetic Hand
- 5.1.2.3. Other Upper Body Prosthetics
- 5.1.1. Lower Body Prosthetics
- 5.2. Market Analysis, Insights and Forecast - by End User
- 5.2.1. Prosthetic Clinics
- 5.2.2. Hospitals
- 5.2.3. Rehabilitation Center
- 5.2.4. Other End Users
- 5.3. Market Analysis, Insights and Forecast - by Region
- 5.3.1. North America
- 5.3.2. Europe
- 5.3.3. Asia Pacific
- 5.3.4. Middle East and Africa
- 5.3.5. South America
- 5.1. Market Analysis, Insights and Forecast - by Product
- 6. North America Smart Prosthetics Market Analysis, Insights and Forecast, 2019-2031
- 6.1. Market Analysis, Insights and Forecast - by Product
- 6.1.1. Lower Body Prosthetics
- 6.1.1.1. Prosthetic Knee
- 6.1.1.2. Prosthetic Ankle
- 6.1.1.3. Other Lower Body Prosthetics
- 6.1.2. Upper Body Prosthetics
- 6.1.2.1. Prosthetic Arm
- 6.1.2.2. Prosthetic Hand
- 6.1.2.3. Other Upper Body Prosthetics
- 6.1.1. Lower Body Prosthetics
- 6.2. Market Analysis, Insights and Forecast - by End User
- 6.2.1. Prosthetic Clinics
- 6.2.2. Hospitals
- 6.2.3. Rehabilitation Center
- 6.2.4. Other End Users
- 6.1. Market Analysis, Insights and Forecast - by Product
- 7. Europe Smart Prosthetics Market Analysis, Insights and Forecast, 2019-2031
- 7.1. Market Analysis, Insights and Forecast - by Product
- 7.1.1. Lower Body Prosthetics
- 7.1.1.1. Prosthetic Knee
- 7.1.1.2. Prosthetic Ankle
- 7.1.1.3. Other Lower Body Prosthetics
- 7.1.2. Upper Body Prosthetics
- 7.1.2.1. Prosthetic Arm
- 7.1.2.2. Prosthetic Hand
- 7.1.2.3. Other Upper Body Prosthetics
- 7.1.1. Lower Body Prosthetics
- 7.2. Market Analysis, Insights and Forecast - by End User
- 7.2.1. Prosthetic Clinics
- 7.2.2. Hospitals
- 7.2.3. Rehabilitation Center
- 7.2.4. Other End Users
- 7.1. Market Analysis, Insights and Forecast - by Product
- 8. Asia Pacific Smart Prosthetics Market Analysis, Insights and Forecast, 2019-2031
- 8.1. Market Analysis, Insights and Forecast - by Product
- 8.1.1. Lower Body Prosthetics
- 8.1.1.1. Prosthetic Knee
- 8.1.1.2. Prosthetic Ankle
- 8.1.1.3. Other Lower Body Prosthetics
- 8.1.2. Upper Body Prosthetics
- 8.1.2.1. Prosthetic Arm
- 8.1.2.2. Prosthetic Hand
- 8.1.2.3. Other Upper Body Prosthetics
- 8.1.1. Lower Body Prosthetics
- 8.2. Market Analysis, Insights and Forecast - by End User
- 8.2.1. Prosthetic Clinics
- 8.2.2. Hospitals
- 8.2.3. Rehabilitation Center
- 8.2.4. Other End Users
- 8.1. Market Analysis, Insights and Forecast - by Product
- 9. Middle East and Africa Smart Prosthetics Market Analysis, Insights and Forecast, 2019-2031
- 9.1. Market Analysis, Insights and Forecast - by Product
- 9.1.1. Lower Body Prosthetics
- 9.1.1.1. Prosthetic Knee
- 9.1.1.2. Prosthetic Ankle
- 9.1.1.3. Other Lower Body Prosthetics
- 9.1.2. Upper Body Prosthetics
- 9.1.2.1. Prosthetic Arm
- 9.1.2.2. Prosthetic Hand
- 9.1.2.3. Other Upper Body Prosthetics
- 9.1.1. Lower Body Prosthetics
- 9.2. Market Analysis, Insights and Forecast - by End User
- 9.2.1. Prosthetic Clinics
- 9.2.2. Hospitals
- 9.2.3. Rehabilitation Center
- 9.2.4. Other End Users
- 9.1. Market Analysis, Insights and Forecast - by Product
- 10. South America Smart Prosthetics Market Analysis, Insights and Forecast, 2019-2031
- 10.1. Market Analysis, Insights and Forecast - by Product
- 10.1.1. Lower Body Prosthetics
- 10.1.1.1. Prosthetic Knee
- 10.1.1.2. Prosthetic Ankle
- 10.1.1.3. Other Lower Body Prosthetics
- 10.1.2. Upper Body Prosthetics
- 10.1.2.1. Prosthetic Arm
- 10.1.2.2. Prosthetic Hand
- 10.1.2.3. Other Upper Body Prosthetics
- 10.1.1. Lower Body Prosthetics
- 10.2. Market Analysis, Insights and Forecast - by End User
- 10.2.1. Prosthetic Clinics
- 10.2.2. Hospitals
- 10.2.3. Rehabilitation Center
- 10.2.4. Other End Users
- 10.1. Market Analysis, Insights and Forecast - by Product
- 11. North America Smart Prosthetics Market Analysis, Insights and Forecast, 2019-2031
- 11.1. Market Analysis, Insights and Forecast - By Country/Sub-region
- 11.1.1 United States
- 11.1.2 Canada
- 11.1.3 Mexico
- 12. Europe Smart Prosthetics Market Analysis, Insights and Forecast, 2019-2031
- 12.1. Market Analysis, Insights and Forecast - By Country/Sub-region
- 12.1.1 Germany
- 12.1.2 United Kingdom
- 12.1.3 France
- 12.1.4 Italy
- 12.1.5 Spain
- 12.1.6 Rest of Europe
- 13. Asia Pacific Smart Prosthetics Market Analysis, Insights and Forecast, 2019-2031
- 13.1. Market Analysis, Insights and Forecast - By Country/Sub-region
- 13.1.1 China
- 13.1.2 Japan
- 13.1.3 India
- 13.1.4 Australia
- 13.1.5 South Korea
- 13.1.6 Rest of Asia Pacific
- 14. Middle East and Africa Smart Prosthetics Market Analysis, Insights and Forecast, 2019-2031
- 14.1. Market Analysis, Insights and Forecast - By Country/Sub-region
- 14.1.1 GCC
- 14.1.2 South Africa
- 14.1.3 Rest of Middle East and Africa
- 15. South America Smart Prosthetics Market Analysis, Insights and Forecast, 2019-2031
- 15.1. Market Analysis, Insights and Forecast - By Country/Sub-region
- 15.1.1 Brazil
- 15.1.2 Argentina
- 15.1.3 Rest of South America
- 16. Competitive Analysis
- 16.1. Global Market Share Analysis 2024
- 16.2. Company Profiles
- 16.2.1 Esper Bionics
- 16.2.1.1. Overview
- 16.2.1.2. Products
- 16.2.1.3. SWOT Analysis
- 16.2.1.4. Recent Developments
- 16.2.1.5. Financials (Based on Availability)
- 16.2.2 Steeper Group
- 16.2.2.1. Overview
- 16.2.2.2. Products
- 16.2.2.3. SWOT Analysis
- 16.2.2.4. Recent Developments
- 16.2.2.5. Financials (Based on Availability)
- 16.2.3 Blatchford Limited
- 16.2.3.1. Overview
- 16.2.3.2. Products
- 16.2.3.3. SWOT Analysis
- 16.2.3.4. Recent Developments
- 16.2.3.5. Financials (Based on Availability)
- 16.2.4 Sarcos Technology and Robotic Corporation
- 16.2.4.1. Overview
- 16.2.4.2. Products
- 16.2.4.3. SWOT Analysis
- 16.2.4.4. Recent Developments
- 16.2.4.5. Financials (Based on Availability)
- 16.2.5 Open Bionics
- 16.2.5.1. Overview
- 16.2.5.2. Products
- 16.2.5.3. SWOT Analysis
- 16.2.5.4. Recent Developments
- 16.2.5.5. Financials (Based on Availability)
- 16.2.6 Ossur (Touch Bionics Inc )
- 16.2.6.1. Overview
- 16.2.6.2. Products
- 16.2.6.3. SWOT Analysis
- 16.2.6.4. Recent Developments
- 16.2.6.5. Financials (Based on Availability)
- 16.2.7 Esko Bionics
- 16.2.7.1. Overview
- 16.2.7.2. Products
- 16.2.7.3. SWOT Analysis
- 16.2.7.4. Recent Developments
- 16.2.7.5. Financials (Based on Availability)
- 16.2.8 SynTouch Inc
- 16.2.8.1. Overview
- 16.2.8.2. Products
- 16.2.8.3. SWOT Analysis
- 16.2.8.4. Recent Developments
- 16.2.8.5. Financials (Based on Availability)
- 16.2.9 Ottobock
- 16.2.9.1. Overview
- 16.2.9.2. Products
- 16.2.9.3. SWOT Analysis
- 16.2.9.4. Recent Developments
- 16.2.9.5. Financials (Based on Availability)
- 16.2.10 Manta Product Development
- 16.2.10.1. Overview
- 16.2.10.2. Products
- 16.2.10.3. SWOT Analysis
- 16.2.10.4. Recent Developments
- 16.2.10.5. Financials (Based on Availability)
- 16.2.11 HDT Global
- 16.2.11.1. Overview
- 16.2.11.2. Products
- 16.2.11.3. SWOT Analysis
- 16.2.11.4. Recent Developments
- 16.2.11.5. Financials (Based on Availability)
- 16.2.1 Esper Bionics
List of Figures
- Figure 1: Global Smart Prosthetics Market Revenue Breakdown (Million, %) by Region 2024 & 2032
- Figure 2: North America Smart Prosthetics Market Revenue (Million), by Country 2024 & 2032
- Figure 3: North America Smart Prosthetics Market Revenue Share (%), by Country 2024 & 2032
- Figure 4: Europe Smart Prosthetics Market Revenue (Million), by Country 2024 & 2032
- Figure 5: Europe Smart Prosthetics Market Revenue Share (%), by Country 2024 & 2032
- Figure 6: Asia Pacific Smart Prosthetics Market Revenue (Million), by Country 2024 & 2032
- Figure 7: Asia Pacific Smart Prosthetics Market Revenue Share (%), by Country 2024 & 2032
- Figure 8: Middle East and Africa Smart Prosthetics Market Revenue (Million), by Country 2024 & 2032
- Figure 9: Middle East and Africa Smart Prosthetics Market Revenue Share (%), by Country 2024 & 2032
- Figure 10: South America Smart Prosthetics Market Revenue (Million), by Country 2024 & 2032
- Figure 11: South America Smart Prosthetics Market Revenue Share (%), by Country 2024 & 2032
- Figure 12: North America Smart Prosthetics Market Revenue (Million), by Product 2024 & 2032
- Figure 13: North America Smart Prosthetics Market Revenue Share (%), by Product 2024 & 2032
- Figure 14: North America Smart Prosthetics Market Revenue (Million), by End User 2024 & 2032
- Figure 15: North America Smart Prosthetics Market Revenue Share (%), by End User 2024 & 2032
- Figure 16: North America Smart Prosthetics Market Revenue (Million), by Country 2024 & 2032
- Figure 17: North America Smart Prosthetics Market Revenue Share (%), by Country 2024 & 2032
- Figure 18: Europe Smart Prosthetics Market Revenue (Million), by Product 2024 & 2032
- Figure 19: Europe Smart Prosthetics Market Revenue Share (%), by Product 2024 & 2032
- Figure 20: Europe Smart Prosthetics Market Revenue (Million), by End User 2024 & 2032
- Figure 21: Europe Smart Prosthetics Market Revenue Share (%), by End User 2024 & 2032
- Figure 22: Europe Smart Prosthetics Market Revenue (Million), by Country 2024 & 2032
- Figure 23: Europe Smart Prosthetics Market Revenue Share (%), by Country 2024 & 2032
- Figure 24: Asia Pacific Smart Prosthetics Market Revenue (Million), by Product 2024 & 2032
- Figure 25: Asia Pacific Smart Prosthetics Market Revenue Share (%), by Product 2024 & 2032
- Figure 26: Asia Pacific Smart Prosthetics Market Revenue (Million), by End User 2024 & 2032
- Figure 27: Asia Pacific Smart Prosthetics Market Revenue Share (%), by End User 2024 & 2032
- Figure 28: Asia Pacific Smart Prosthetics Market Revenue (Million), by Country 2024 & 2032
- Figure 29: Asia Pacific Smart Prosthetics Market Revenue Share (%), by Country 2024 & 2032
- Figure 30: Middle East and Africa Smart Prosthetics Market Revenue (Million), by Product 2024 & 2032
- Figure 31: Middle East and Africa Smart Prosthetics Market Revenue Share (%), by Product 2024 & 2032
- Figure 32: Middle East and Africa Smart Prosthetics Market Revenue (Million), by End User 2024 & 2032
- Figure 33: Middle East and Africa Smart Prosthetics Market Revenue Share (%), by End User 2024 & 2032
- Figure 34: Middle East and Africa Smart Prosthetics Market Revenue (Million), by Country 2024 & 2032
- Figure 35: Middle East and Africa Smart Prosthetics Market Revenue Share (%), by Country 2024 & 2032
- Figure 36: South America Smart Prosthetics Market Revenue (Million), by Product 2024 & 2032
- Figure 37: South America Smart Prosthetics Market Revenue Share (%), by Product 2024 & 2032
- Figure 38: South America Smart Prosthetics Market Revenue (Million), by End User 2024 & 2032
- Figure 39: South America Smart Prosthetics Market Revenue Share (%), by End User 2024 & 2032
- Figure 40: South America Smart Prosthetics Market Revenue (Million), by Country 2024 & 2032
- Figure 41: South America Smart Prosthetics Market Revenue Share (%), by Country 2024 & 2032
List of Tables
- Table 1: Global Smart Prosthetics Market Revenue Million Forecast, by Region 2019 & 2032
- Table 2: Global Smart Prosthetics Market Revenue Million Forecast, by Product 2019 & 2032
- Table 3: Global Smart Prosthetics Market Revenue Million Forecast, by End User 2019 & 2032
- Table 4: Global Smart Prosthetics Market Revenue Million Forecast, by Region 2019 & 2032
- Table 5: Global Smart Prosthetics Market Revenue Million Forecast, by Country 2019 & 2032
- Table 6: United States Smart Prosthetics Market Revenue (Million) Forecast, by Application 2019 & 2032
- Table 7: Canada Smart Prosthetics Market Revenue (Million) Forecast, by Application 2019 & 2032
- Table 8: Mexico Smart Prosthetics Market Revenue (Million) Forecast, by Application 2019 & 2032
- Table 9: Global Smart Prosthetics Market Revenue Million Forecast, by Country 2019 & 2032
- Table 10: Germany Smart Prosthetics Market Revenue (Million) Forecast, by Application 2019 & 2032
- Table 11: United Kingdom Smart Prosthetics Market Revenue (Million) Forecast, by Application 2019 & 2032
- Table 12: France Smart Prosthetics Market Revenue (Million) Forecast, by Application 2019 & 2032
- Table 13: Italy Smart Prosthetics Market Revenue (Million) Forecast, by Application 2019 & 2032
- Table 14: Spain Smart Prosthetics Market Revenue (Million) Forecast, by Application 2019 & 2032
- Table 15: Rest of Europe Smart Prosthetics Market Revenue (Million) Forecast, by Application 2019 & 2032
- Table 16: Global Smart Prosthetics Market Revenue Million Forecast, by Country 2019 & 2032
- Table 17: China Smart Prosthetics Market Revenue (Million) Forecast, by Application 2019 & 2032
- Table 18: Japan Smart Prosthetics Market Revenue (Million) Forecast, by Application 2019 & 2032
- Table 19: India Smart Prosthetics Market Revenue (Million) Forecast, by Application 2019 & 2032
- Table 20: Australia Smart Prosthetics Market Revenue (Million) Forecast, by Application 2019 & 2032
- Table 21: South Korea Smart Prosthetics Market Revenue (Million) Forecast, by Application 2019 & 2032
- Table 22: Rest of Asia Pacific Smart Prosthetics Market Revenue (Million) Forecast, by Application 2019 & 2032
- Table 23: Global Smart Prosthetics Market Revenue Million Forecast, by Country 2019 & 2032
- Table 24: GCC Smart Prosthetics Market Revenue (Million) Forecast, by Application 2019 & 2032
- Table 25: South Africa Smart Prosthetics Market Revenue (Million) Forecast, by Application 2019 & 2032
- Table 26: Rest of Middle East and Africa Smart Prosthetics Market Revenue (Million) Forecast, by Application 2019 & 2032
- Table 27: Global Smart Prosthetics Market Revenue Million Forecast, by Country 2019 & 2032
- Table 28: Brazil Smart Prosthetics Market Revenue (Million) Forecast, by Application 2019 & 2032
- Table 29: Argentina Smart Prosthetics Market Revenue (Million) Forecast, by Application 2019 & 2032
- Table 30: Rest of South America Smart Prosthetics Market Revenue (Million) Forecast, by Application 2019 & 2032
- Table 31: Global Smart Prosthetics Market Revenue Million Forecast, by Product 2019 & 2032
- Table 32: Global Smart Prosthetics Market Revenue Million Forecast, by End User 2019 & 2032
- Table 33: Global Smart Prosthetics Market Revenue Million Forecast, by Country 2019 & 2032
- Table 34: United States Smart Prosthetics Market Revenue (Million) Forecast, by Application 2019 & 2032
- Table 35: Canada Smart Prosthetics Market Revenue (Million) Forecast, by Application 2019 & 2032
- Table 36: Mexico Smart Prosthetics Market Revenue (Million) Forecast, by Application 2019 & 2032
- Table 37: Global Smart Prosthetics Market Revenue Million Forecast, by Product 2019 & 2032
- Table 38: Global Smart Prosthetics Market Revenue Million Forecast, by End User 2019 & 2032
- Table 39: Global Smart Prosthetics Market Revenue Million Forecast, by Country 2019 & 2032
- Table 40: Germany Smart Prosthetics Market Revenue (Million) Forecast, by Application 2019 & 2032
- Table 41: United Kingdom Smart Prosthetics Market Revenue (Million) Forecast, by Application 2019 & 2032
- Table 42: France Smart Prosthetics Market Revenue (Million) Forecast, by Application 2019 & 2032
- Table 43: Italy Smart Prosthetics Market Revenue (Million) Forecast, by Application 2019 & 2032
- Table 44: Spain Smart Prosthetics Market Revenue (Million) Forecast, by Application 2019 & 2032
- Table 45: Rest of Europe Smart Prosthetics Market Revenue (Million) Forecast, by Application 2019 & 2032
- Table 46: Global Smart Prosthetics Market Revenue Million Forecast, by Product 2019 & 2032
- Table 47: Global Smart Prosthetics Market Revenue Million Forecast, by End User 2019 & 2032
- Table 48: Global Smart Prosthetics Market Revenue Million Forecast, by Country 2019 & 2032
- Table 49: China Smart Prosthetics Market Revenue (Million) Forecast, by Application 2019 & 2032
- Table 50: Japan Smart Prosthetics Market Revenue (Million) Forecast, by Application 2019 & 2032
- Table 51: India Smart Prosthetics Market Revenue (Million) Forecast, by Application 2019 & 2032
- Table 52: Australia Smart Prosthetics Market Revenue (Million) Forecast, by Application 2019 & 2032
- Table 53: South Korea Smart Prosthetics Market Revenue (Million) Forecast, by Application 2019 & 2032
- Table 54: Rest of Asia Pacific Smart Prosthetics Market Revenue (Million) Forecast, by Application 2019 & 2032
- Table 55: Global Smart Prosthetics Market Revenue Million Forecast, by Product 2019 & 2032
- Table 56: Global Smart Prosthetics Market Revenue Million Forecast, by End User 2019 & 2032
- Table 57: Global Smart Prosthetics Market Revenue Million Forecast, by Country 2019 & 2032
- Table 58: GCC Smart Prosthetics Market Revenue (Million) Forecast, by Application 2019 & 2032
- Table 59: South Africa Smart Prosthetics Market Revenue (Million) Forecast, by Application 2019 & 2032
- Table 60: Rest of Middle East and Africa Smart Prosthetics Market Revenue (Million) Forecast, by Application 2019 & 2032
- Table 61: Global Smart Prosthetics Market Revenue Million Forecast, by Product 2019 & 2032
- Table 62: Global Smart Prosthetics Market Revenue Million Forecast, by End User 2019 & 2032
- Table 63: Global Smart Prosthetics Market Revenue Million Forecast, by Country 2019 & 2032
- Table 64: Brazil Smart Prosthetics Market Revenue (Million) Forecast, by Application 2019 & 2032
- Table 65: Argentina Smart Prosthetics Market Revenue (Million) Forecast, by Application 2019 & 2032
- Table 66: Rest of South America Smart Prosthetics Market Revenue (Million) Forecast, by Application 2019 & 2032
Frequently Asked Questions
1. What is the projected Compound Annual Growth Rate (CAGR) of the Smart Prosthetics Market?
The projected CAGR is approximately 10.50%.
2. Which companies are prominent players in the Smart Prosthetics Market?
Key companies in the market include Esper Bionics, Steeper Group, Blatchford Limited, Sarcos Technology and Robotic Corporation, Open Bionics, Ossur (Touch Bionics Inc ), Esko Bionics, SynTouch Inc, Ottobock, Manta Product Development, HDT Global.
3. What are the main segments of the Smart Prosthetics Market?
The market segments include Product, End User.
4. Can you provide details about the market size?
The market size is estimated to be USD XX Million as of 2022.
5. What are some drivers contributing to market growth?
Growing Number of Sports Injuries and Road Accidents; Increasing Burden of Critical Limb Ischemia. Diabetes-Related Amputations and Rising Geriatric Population; Technological Advancements In Smart Prosthetics.
6. What are the notable trends driving market growth?
Prosthetic Hand Segment Expects to Register a Significant Growth Over the Forecast Period.
7. Are there any restraints impacting market growth?
Lack of Developed Healthcare Infrastructure in Developing and Under-developed Countries; High Cost of Artificial Intelligence Prosthetics.
8. Can you provide examples of recent developments in the market?
September 2023: ISRO developed an intelligent artificial limb that benefits above-knee amputees to walk with a comfortable gait. The artificial limb has a 1.6kg MPK that enables an amputee to walk about 100 m in the corridor with minimum support. These "microprocessor-controlled knees" (MPKs) give the amputee more capabilities as compared to passive limbs that do not use microprocessors.
9. What pricing options are available for accessing the report?
Pricing options include single-user, multi-user, and enterprise licenses priced at USD 4750, USD 5250, and USD 8750 respectively.
10. Is the market size provided in terms of value or volume?
The market size is provided in terms of value, measured in Million.
11. Are there any specific market keywords associated with the report?
Yes, the market keyword associated with the report is "Smart Prosthetics Market," which aids in identifying and referencing the specific market segment covered.
12. How do I determine which pricing option suits my needs best?
The pricing options vary based on user requirements and access needs. Individual users may opt for single-user licenses, while businesses requiring broader access may choose multi-user or enterprise licenses for cost-effective access to the report.
13. Are there any additional resources or data provided in the Smart Prosthetics Market report?
While the report offers comprehensive insights, it's advisable to review the specific contents or supplementary materials provided to ascertain if additional resources or data are available.
14. How can I stay updated on further developments or reports in the Smart Prosthetics Market?
To stay informed about further developments, trends, and reports in the Smart Prosthetics Market, consider subscribing to industry newsletters, following relevant companies and organizations, or regularly checking reputable industry news sources and publications.
Methodology
Step 1 - Identification of Relevant Samples Size from Population Database


Step 2 - Approaches for Defining Global Market Size (Value, Volume* & Price*)

Note*: In applicable scenarios
Step 3 - Data Sources
Primary Research
- Web Analytics
- Survey Reports
- Research Institute
- Latest Research Reports
- Opinion Leaders
Secondary Research
- Annual Reports
- White Paper
- Latest Press Release
- Industry Association
- Paid Database
- Investor Presentations

Step 4 - Data Triangulation
Involves using different sources of information in order to increase the validity of a study
These sources are likely to be stakeholders in a program - participants, other researchers, program staff, other community members, and so on.
Then we put all data in single framework & apply various statistical tools to find out the dynamic on the market.
During the analysis stage, feedback from the stakeholder groups would be compared to determine areas of agreement as well as areas of divergence


