
Key Insights
The Posterior Segment Eye Diseases market, valued at $32.12 billion in 2025, is projected to experience robust growth, driven by an aging global population, increasing prevalence of chronic diseases like diabetes and age-related macular degeneration (AMD), and advancements in diagnostic and therapeutic technologies. The market's Compound Annual Growth Rate (CAGR) of 5.42% from 2025 to 2033 indicates a substantial expansion, reaching an estimated $50 billion by 2033. Key drivers include the rising adoption of minimally invasive surgical procedures, the development of innovative biologics and targeted therapies, and increased healthcare expenditure globally. Growth is further fueled by rising awareness of posterior segment eye diseases and improved access to advanced ophthalmic care, particularly in developing economies. However, high treatment costs, stringent regulatory pathways for new drug approvals, and the potential for adverse effects associated with certain therapies pose challenges to market growth.
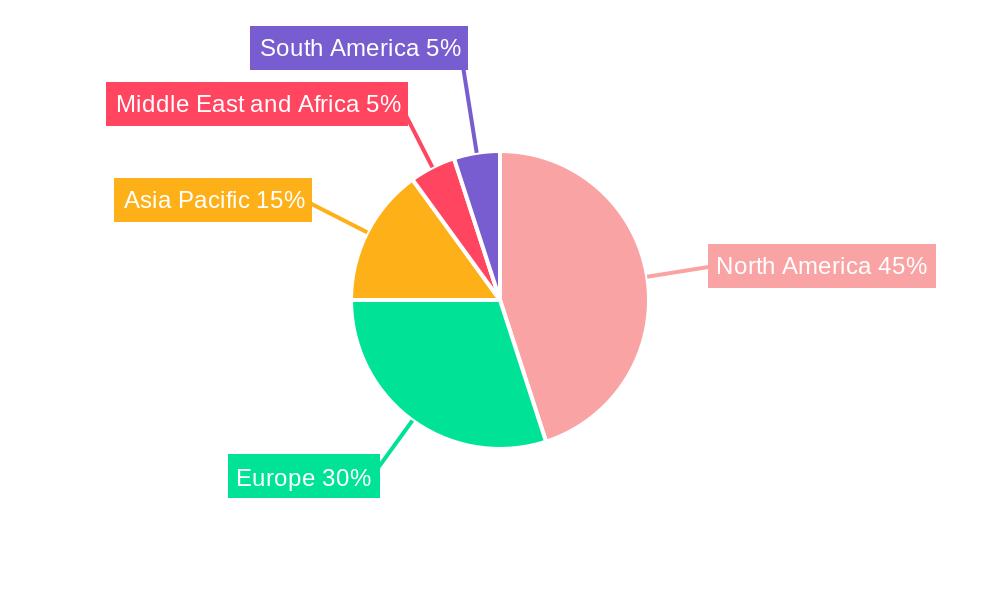
Market segmentation reveals significant opportunities within specific disease areas. Macular degeneration and diabetic retinopathy represent substantial market segments, accounting for a significant portion of overall revenue. The drugs segment currently holds the largest share, reflecting the established presence of pharmacological treatments, but the biologics and devices segments are exhibiting high growth potential due to advancements in gene therapy, regenerative medicine, and implantable devices for vision restoration. Geographically, North America currently dominates the market due to high healthcare expenditure and technological advancements, but Asia Pacific is expected to show significant growth in the forecast period, driven by a rapidly expanding elderly population and increasing healthcare infrastructure development. Leading companies like Novartis, Regeneron, and Alcon are actively involved in R&D and market expansion, driving competition and innovation within this dynamic sector.

Posterior Segment Eye Diseases Industry: A Comprehensive Market Report (2019-2033)
This in-depth report provides a comprehensive analysis of the Posterior Segment Eye Diseases industry, offering invaluable insights for stakeholders seeking to navigate this dynamic market. The study period covers 2019-2033, with 2025 as the base and estimated year, and a forecast period of 2025-2033. The historical period analyzed is 2019-2024. The report encompasses detailed market sizing, segmentation, competitive landscape, and future growth projections, valued in Millions.
Posterior Segment Eye Diseases Industry Market Structure & Competitive Dynamics
This section analyzes the market structure, competitive dynamics, and key influencing factors within the posterior segment eye diseases industry. The market is characterized by a moderate level of concentration, with several major players holding significant market share. However, the presence of numerous smaller companies and startups, particularly in the biologics and device segments, introduces a competitive dynamic.
The innovation ecosystem is robust, with continuous advancements in drug development, device technology, and diagnostic tools. Regulatory frameworks, particularly those governing the approval of new drugs and devices, significantly influence market entry and expansion. The presence of substitute therapies and emerging treatment modalities further shapes the competitive landscape. End-user trends, such as the aging population and increasing prevalence of chronic eye diseases, are major growth drivers. M&A activities are frequent, with deal values reaching xx Million in recent years, signifying strategic consolidation and expansion within the industry. Key metrics, including market share data and M&A deal values, are provided in the full report. Market concentration is approximately xx%, reflecting a moderately concentrated market with opportunities for both established players and emerging companies.
Posterior Segment Eye Diseases Industry Industry Trends & Insights
The Posterior Segment Eye Diseases industry is experiencing robust growth, fueled by several interconnected factors. The escalating prevalence of age-related macular degeneration (AMD), glaucoma, and diabetic retinopathy, significantly accelerated by the globally aging population, forms a primary growth driver. This demographic shift is further amplified by improvements in overall life expectancy and increased survival rates for individuals with comorbidities. Technological advancements are revolutionizing treatment paradigms. Novel biologics, sophisticated imaging techniques (like OCT-angiography and advanced fundus autofluorescence), and minimally invasive surgical procedures are not only improving treatment outcomes but also expanding access to care. Furthermore, the evolving landscape of healthcare consumerism, marked by a growing demand for personalized medicine and enhanced patient experiences (such as telehealth consultations and remote monitoring), is profoundly shaping the market's trajectory.
Competitive dynamics within the Posterior Segment Eye Diseases market are fiercely competitive. Major pharmaceutical and medical device companies are engaging in substantial investments in research and development, strategic partnerships, and acquisitions to secure a leading market position. Simultaneously, increasing competition from generic drug manufacturers, particularly for established therapies, is intensifying pricing pressures and reshaping market share dynamics. While precise figures are proprietary, market analysis projects a significant Compound Annual Growth Rate (CAGR) for the forecast period (2025-2033), with a notable increase in the market penetration of novel therapies anticipated.
Dominant Markets & Segments in Posterior Segment Eye Diseases Industry
North America currently commands a dominant position in the posterior segment eye diseases market, driven by substantial healthcare expenditure, a sophisticated healthcare infrastructure, and a large patient pool. However, significant growth opportunities exist in emerging markets with rapidly expanding healthcare systems. Segment analysis reveals the following:
Product: While pharmaceuticals currently dominate the market (representing a substantial revenue share), biologics are exhibiting rapid growth and are projected to capture an increasingly larger market segment by 2033 due to their targeted therapeutic mechanisms and improved efficacy. Medical devices, while representing a smaller segment, are also showcasing considerable growth potential driven by innovations in minimally invasive surgical tools and drug delivery systems.
Application: Macular degeneration and glaucoma remain the largest application segments, contributing significantly to overall market revenue. Diabetic retinopathy continues to be a substantial and rapidly expanding segment, reflecting the increasing prevalence of diabetes globally. Other posterior segment diseases, such as uveitis and retinal vascular diseases, although smaller segments, contribute significantly to the market's overall diversity and growth.
Key Drivers: The market's dominance is primarily attributable to robust healthcare infrastructure, high healthcare expenditure, the high prevalence of age-related diseases, and continuous technological advancements. Government initiatives supporting research and development, as well as reimbursement policies, also play a crucial role.
Posterior Segment Eye Diseases Industry Product Innovations
Recent innovations in the posterior segment eye diseases space focus on improving treatment efficacy, minimizing side effects, and enhancing patient convenience. This includes the development of novel biologics with enhanced targeting capabilities, advanced drug delivery systems, and innovative surgical devices. These innovations are not only improving patient outcomes but also shaping the competitive landscape, with companies continuously striving to offer superior products with better market fit.
Report Segmentation & Scope
This report segments the Posterior Segment Eye Diseases industry across various parameters.
Product: The market is segmented into Drugs and Biologics/Devices. Drugs segment is projected to grow at a CAGR of xx% during the forecast period, while Biologics/Devices will see a CAGR of xx%.
Application: The report analyzes the market across Macular Degeneration, Glaucoma, Diabetic Retinopathy, and Other Applications. Macular degeneration and glaucoma segments are anticipated to maintain significant growth throughout the forecast period.
Competitive dynamics within each segment are analyzed in detail to give a complete market overview.
Key Drivers of Posterior Segment Eye Diseases Industry Growth
Several converging factors are synergistically propelling the growth of the Posterior Segment Eye Diseases industry:
- Aging Population and Increased Life Expectancy: The global aging population, coupled with increased life expectancy, is creating a significantly larger pool of individuals susceptible to age-related eye diseases.
- Technological Advancements and Innovation: Continuous innovations in diagnostic imaging (e.g., optical coherence tomography, fundus autofluorescence), treatment modalities (e.g., anti-VEGF injections, gene therapy), and drug delivery systems are expanding therapeutic options and improving treatment outcomes.
- Increased Healthcare Expenditure and Insurance Coverage: Growing global healthcare spending and wider insurance coverage for ophthalmic care are increasing access to specialized eye care and advanced treatments.
- Rising Awareness and Early Detection Initiatives: Increased public awareness campaigns and early detection programs are leading to earlier diagnosis and more timely interventions, ultimately improving patient prognosis.
- Pharmaceutical and Medical Device Innovation: The ongoing investment in R&D by major pharmaceutical and medical device companies drives the introduction of novel therapies and improves treatment efficacy.
Challenges in the Posterior Segment Eye Diseases Industry Sector
The industry faces several challenges:
- High R&D Costs: Developing new treatments requires significant investment, potentially hindering innovation for smaller companies.
- Regulatory Hurdles: Obtaining regulatory approvals for new drugs and devices can be a lengthy and complex process.
- Competition: Intense competition among established players and emerging companies puts pressure on pricing and profitability.
- Limited Access: Unequal access to advanced treatments remains a challenge in many regions, particularly in developing countries.
Leading Players in the Posterior Segment Eye Diseases Industry Market
- Aerie Pharmaceuticals
- Rainbow Medical Ltd (Nano Retina)
- Second Sight Medical Products Inc
- Regeneron Pharmaceuticals Inc
- Novartis AG
- Merck & Co Inc
- Santen Pharmaceuticals
- Abbvie Inc (Allergen PLC)
- F Hoffmann-La Roche
- Alcon Inc
- Bausch Health Companies Inc
Key Developments in Posterior Segment Eye Diseases Industry Sector
- June 2022: Amring Pharmaceuticals Inc. received US FDA approval for generic Timolol Maleate Ophthalmic Solution, highlighting the growing presence of generics in the market.
- April 2022: Sandoz launched a generic combination eyedrop brimonidine tartrate/timolol maleate ophthalmic solution in the United States, further illustrating the competitive landscape.
- [Add more recent key developments here, including mergers, acquisitions, FDA approvals, and new product launches.]
These and other recent developments underscore the increasing competition, both from generic drug manufacturers and the introduction of novel therapies, shaping the overall market dynamics and pricing strategies.
Strategic Posterior Segment Eye Diseases Industry Market Outlook
The posterior segment eye diseases market presents substantial and sustained growth opportunities for both established players and emerging companies. The continued expansion of the aging population, coupled with persistent advancements in treatment modalities, improved diagnostic technologies, and rising awareness, will collectively drive substantial market expansion. Strategic partnerships, acquisitions, and robust investments in research and development will remain crucial for companies to not only maintain but enhance their competitive edge. The untapped potential in emerging markets, characterized by increasing healthcare access and a rising prevalence of eye diseases, presents particularly attractive opportunities for those with innovative technologies and treatment approaches. This dynamic market landscape promises exciting prospects for future innovation and growth.
Posterior Segment Eye Diseases Industry Segmentation
-
1. Product
-
1.1. Drugs
- 1.1.1. Small Molecules
- 1.1.2. Biologics
-
1.2. Devices
- 1.2.1. Therapeutic Devices
- 1.2.2. Diagnostic Devices
-
1.1. Drugs
-
2. Application
- 2.1. Macular Degeneration
- 2.2. Glaucoma
- 2.3. Diabetic Retinopathy
- 2.4. Other Applications
Posterior Segment Eye Diseases Industry Segmentation By Geography
-
1. North America
- 1.1. United States
- 1.2. Canada
- 1.3. Mexico
-
2. Europe
- 2.1. Germany
- 2.2. United Kingdom
- 2.3. France
- 2.4. Italy
- 2.5. Spain
- 2.6. Rest of Europe
-
3. Asia Pacific
- 3.1. China
- 3.2. Japan
- 3.3. India
- 3.4. Australia
- 3.5. South Korea
- 3.6. Rest of Asia Pacific
-
4. Middle East and Africa
- 4.1. GCC
- 4.2. South Africa
- 4.3. Rest of Middle East and Africa
-
5. South America
- 5.1. Brazil
- 5.2. Argentina
- 5.3. Rest of South America
Posterior Segment Eye Diseases Industry REPORT HIGHLIGHTS
| Aspects | Details |
|---|---|
| Study Period | 2019-2033 |
| Base Year | 2024 |
| Estimated Year | 2025 |
| Forecast Period | 2025-2033 |
| Historical Period | 2019-2024 |
| Growth Rate | CAGR of 5.42% from 2019-2033 |
| Segmentation |
|
Table of Contents
- 1. Introduction
- 1.1. Research Scope
- 1.2. Market Segmentation
- 1.3. Research Methodology
- 1.4. Definitions and Assumptions
- 2. Executive Summary
- 2.1. Introduction
- 3. Market Dynamics
- 3.1. Introduction
- 3.2. Market Drivers
- 3.2.1. Increasing Burden of Back of the Eye Disorders; Growing R&D for New Therapies for the Treatment of Posterior Segment Eye Disorders
- 3.3. Market Restrains
- 3.3.1. Stringent Regulatory Policies
- 3.4. Market Trends
- 3.4.1. Small Molecules by Drugs Segment is Expected to Hold a Significant Market Share Over the Forecast Period
- 4. Market Factor Analysis
- 4.1. Porters Five Forces
- 4.2. Supply/Value Chain
- 4.3. PESTEL analysis
- 4.4. Market Entropy
- 4.5. Patent/Trademark Analysis
- 5. Global Posterior Segment Eye Diseases Industry Analysis, Insights and Forecast, 2019-2031
- 5.1. Market Analysis, Insights and Forecast - by Product
- 5.1.1. Drugs
- 5.1.1.1. Small Molecules
- 5.1.1.2. Biologics
- 5.1.2. Devices
- 5.1.2.1. Therapeutic Devices
- 5.1.2.2. Diagnostic Devices
- 5.1.1. Drugs
- 5.2. Market Analysis, Insights and Forecast - by Application
- 5.2.1. Macular Degeneration
- 5.2.2. Glaucoma
- 5.2.3. Diabetic Retinopathy
- 5.2.4. Other Applications
- 5.3. Market Analysis, Insights and Forecast - by Region
- 5.3.1. North America
- 5.3.2. Europe
- 5.3.3. Asia Pacific
- 5.3.4. Middle East and Africa
- 5.3.5. South America
- 5.1. Market Analysis, Insights and Forecast - by Product
- 6. North America Posterior Segment Eye Diseases Industry Analysis, Insights and Forecast, 2019-2031
- 6.1. Market Analysis, Insights and Forecast - by Product
- 6.1.1. Drugs
- 6.1.1.1. Small Molecules
- 6.1.1.2. Biologics
- 6.1.2. Devices
- 6.1.2.1. Therapeutic Devices
- 6.1.2.2. Diagnostic Devices
- 6.1.1. Drugs
- 6.2. Market Analysis, Insights and Forecast - by Application
- 6.2.1. Macular Degeneration
- 6.2.2. Glaucoma
- 6.2.3. Diabetic Retinopathy
- 6.2.4. Other Applications
- 6.1. Market Analysis, Insights and Forecast - by Product
- 7. Europe Posterior Segment Eye Diseases Industry Analysis, Insights and Forecast, 2019-2031
- 7.1. Market Analysis, Insights and Forecast - by Product
- 7.1.1. Drugs
- 7.1.1.1. Small Molecules
- 7.1.1.2. Biologics
- 7.1.2. Devices
- 7.1.2.1. Therapeutic Devices
- 7.1.2.2. Diagnostic Devices
- 7.1.1. Drugs
- 7.2. Market Analysis, Insights and Forecast - by Application
- 7.2.1. Macular Degeneration
- 7.2.2. Glaucoma
- 7.2.3. Diabetic Retinopathy
- 7.2.4. Other Applications
- 7.1. Market Analysis, Insights and Forecast - by Product
- 8. Asia Pacific Posterior Segment Eye Diseases Industry Analysis, Insights and Forecast, 2019-2031
- 8.1. Market Analysis, Insights and Forecast - by Product
- 8.1.1. Drugs
- 8.1.1.1. Small Molecules
- 8.1.1.2. Biologics
- 8.1.2. Devices
- 8.1.2.1. Therapeutic Devices
- 8.1.2.2. Diagnostic Devices
- 8.1.1. Drugs
- 8.2. Market Analysis, Insights and Forecast - by Application
- 8.2.1. Macular Degeneration
- 8.2.2. Glaucoma
- 8.2.3. Diabetic Retinopathy
- 8.2.4. Other Applications
- 8.1. Market Analysis, Insights and Forecast - by Product
- 9. Middle East and Africa Posterior Segment Eye Diseases Industry Analysis, Insights and Forecast, 2019-2031
- 9.1. Market Analysis, Insights and Forecast - by Product
- 9.1.1. Drugs
- 9.1.1.1. Small Molecules
- 9.1.1.2. Biologics
- 9.1.2. Devices
- 9.1.2.1. Therapeutic Devices
- 9.1.2.2. Diagnostic Devices
- 9.1.1. Drugs
- 9.2. Market Analysis, Insights and Forecast - by Application
- 9.2.1. Macular Degeneration
- 9.2.2. Glaucoma
- 9.2.3. Diabetic Retinopathy
- 9.2.4. Other Applications
- 9.1. Market Analysis, Insights and Forecast - by Product
- 10. South America Posterior Segment Eye Diseases Industry Analysis, Insights and Forecast, 2019-2031
- 10.1. Market Analysis, Insights and Forecast - by Product
- 10.1.1. Drugs
- 10.1.1.1. Small Molecules
- 10.1.1.2. Biologics
- 10.1.2. Devices
- 10.1.2.1. Therapeutic Devices
- 10.1.2.2. Diagnostic Devices
- 10.1.1. Drugs
- 10.2. Market Analysis, Insights and Forecast - by Application
- 10.2.1. Macular Degeneration
- 10.2.2. Glaucoma
- 10.2.3. Diabetic Retinopathy
- 10.2.4. Other Applications
- 10.1. Market Analysis, Insights and Forecast - by Product
- 11. North America Posterior Segment Eye Diseases Industry Analysis, Insights and Forecast, 2019-2031
- 11.1. Market Analysis, Insights and Forecast - By Country/Sub-region
- 11.1.1. undefined
- 12. Europe Posterior Segment Eye Diseases Industry Analysis, Insights and Forecast, 2019-2031
- 12.1. Market Analysis, Insights and Forecast - By Country/Sub-region
- 12.1.1. undefined
- 13. Asia Pacific Posterior Segment Eye Diseases Industry Analysis, Insights and Forecast, 2019-2031
- 13.1. Market Analysis, Insights and Forecast - By Country/Sub-region
- 13.1.1. undefined
- 14. Middle East and Africa Posterior Segment Eye Diseases Industry Analysis, Insights and Forecast, 2019-2031
- 14.1. Market Analysis, Insights and Forecast - By Country/Sub-region
- 14.1.1. undefined
- 15. South America Posterior Segment Eye Diseases Industry Analysis, Insights and Forecast, 2019-2031
- 15.1. Market Analysis, Insights and Forecast - By Country/Sub-region
- 15.1.1. undefined
- 16. Competitive Analysis
- 16.1. Global Market Share Analysis 2024
- 16.2. Company Profiles
- 16.2.1 Aerie Pharmaceuticals
- 16.2.1.1. Overview
- 16.2.1.2. Products
- 16.2.1.3. SWOT Analysis
- 16.2.1.4. Recent Developments
- 16.2.1.5. Financials (Based on Availability)
- 16.2.2 Rainbow Medical Ltd (Nano Retina)
- 16.2.2.1. Overview
- 16.2.2.2. Products
- 16.2.2.3. SWOT Analysis
- 16.2.2.4. Recent Developments
- 16.2.2.5. Financials (Based on Availability)
- 16.2.3 Second Sight Medical Products Inc
- 16.2.3.1. Overview
- 16.2.3.2. Products
- 16.2.3.3. SWOT Analysis
- 16.2.3.4. Recent Developments
- 16.2.3.5. Financials (Based on Availability)
- 16.2.4 Regeneron Pharmaceuticals Inc
- 16.2.4.1. Overview
- 16.2.4.2. Products
- 16.2.4.3. SWOT Analysis
- 16.2.4.4. Recent Developments
- 16.2.4.5. Financials (Based on Availability)
- 16.2.5 Novartis AG
- 16.2.5.1. Overview
- 16.2.5.2. Products
- 16.2.5.3. SWOT Analysis
- 16.2.5.4. Recent Developments
- 16.2.5.5. Financials (Based on Availability)
- 16.2.6 Merck & Co Inc
- 16.2.6.1. Overview
- 16.2.6.2. Products
- 16.2.6.3. SWOT Analysis
- 16.2.6.4. Recent Developments
- 16.2.6.5. Financials (Based on Availability)
- 16.2.7 Santen Pharmaceuticals
- 16.2.7.1. Overview
- 16.2.7.2. Products
- 16.2.7.3. SWOT Analysis
- 16.2.7.4. Recent Developments
- 16.2.7.5. Financials (Based on Availability)
- 16.2.8 Abbvie Inc (Allergen PLC)
- 16.2.8.1. Overview
- 16.2.8.2. Products
- 16.2.8.3. SWOT Analysis
- 16.2.8.4. Recent Developments
- 16.2.8.5. Financials (Based on Availability)
- 16.2.9 F Hoffmann-La Roche
- 16.2.9.1. Overview
- 16.2.9.2. Products
- 16.2.9.3. SWOT Analysis
- 16.2.9.4. Recent Developments
- 16.2.9.5. Financials (Based on Availability)
- 16.2.10 Alcon Inc
- 16.2.10.1. Overview
- 16.2.10.2. Products
- 16.2.10.3. SWOT Analysis
- 16.2.10.4. Recent Developments
- 16.2.10.5. Financials (Based on Availability)
- 16.2.11 Bausch Health Companies Inc
- 16.2.11.1. Overview
- 16.2.11.2. Products
- 16.2.11.3. SWOT Analysis
- 16.2.11.4. Recent Developments
- 16.2.11.5. Financials (Based on Availability)
- 16.2.1 Aerie Pharmaceuticals
List of Figures
- Figure 1: Global Posterior Segment Eye Diseases Industry Revenue Breakdown (Million, %) by Region 2024 & 2032
- Figure 2: Global Posterior Segment Eye Diseases Industry Volume Breakdown (K Unit, %) by Region 2024 & 2032
- Figure 3: North America Posterior Segment Eye Diseases Industry Revenue (Million), by Country 2024 & 2032
- Figure 4: North America Posterior Segment Eye Diseases Industry Volume (K Unit), by Country 2024 & 2032
- Figure 5: North America Posterior Segment Eye Diseases Industry Revenue Share (%), by Country 2024 & 2032
- Figure 6: North America Posterior Segment Eye Diseases Industry Volume Share (%), by Country 2024 & 2032
- Figure 7: Europe Posterior Segment Eye Diseases Industry Revenue (Million), by Country 2024 & 2032
- Figure 8: Europe Posterior Segment Eye Diseases Industry Volume (K Unit), by Country 2024 & 2032
- Figure 9: Europe Posterior Segment Eye Diseases Industry Revenue Share (%), by Country 2024 & 2032
- Figure 10: Europe Posterior Segment Eye Diseases Industry Volume Share (%), by Country 2024 & 2032
- Figure 11: Asia Pacific Posterior Segment Eye Diseases Industry Revenue (Million), by Country 2024 & 2032
- Figure 12: Asia Pacific Posterior Segment Eye Diseases Industry Volume (K Unit), by Country 2024 & 2032
- Figure 13: Asia Pacific Posterior Segment Eye Diseases Industry Revenue Share (%), by Country 2024 & 2032
- Figure 14: Asia Pacific Posterior Segment Eye Diseases Industry Volume Share (%), by Country 2024 & 2032
- Figure 15: Middle East and Africa Posterior Segment Eye Diseases Industry Revenue (Million), by Country 2024 & 2032
- Figure 16: Middle East and Africa Posterior Segment Eye Diseases Industry Volume (K Unit), by Country 2024 & 2032
- Figure 17: Middle East and Africa Posterior Segment Eye Diseases Industry Revenue Share (%), by Country 2024 & 2032
- Figure 18: Middle East and Africa Posterior Segment Eye Diseases Industry Volume Share (%), by Country 2024 & 2032
- Figure 19: South America Posterior Segment Eye Diseases Industry Revenue (Million), by Country 2024 & 2032
- Figure 20: South America Posterior Segment Eye Diseases Industry Volume (K Unit), by Country 2024 & 2032
- Figure 21: South America Posterior Segment Eye Diseases Industry Revenue Share (%), by Country 2024 & 2032
- Figure 22: South America Posterior Segment Eye Diseases Industry Volume Share (%), by Country 2024 & 2032
- Figure 23: North America Posterior Segment Eye Diseases Industry Revenue (Million), by Product 2024 & 2032
- Figure 24: North America Posterior Segment Eye Diseases Industry Volume (K Unit), by Product 2024 & 2032
- Figure 25: North America Posterior Segment Eye Diseases Industry Revenue Share (%), by Product 2024 & 2032
- Figure 26: North America Posterior Segment Eye Diseases Industry Volume Share (%), by Product 2024 & 2032
- Figure 27: North America Posterior Segment Eye Diseases Industry Revenue (Million), by Application 2024 & 2032
- Figure 28: North America Posterior Segment Eye Diseases Industry Volume (K Unit), by Application 2024 & 2032
- Figure 29: North America Posterior Segment Eye Diseases Industry Revenue Share (%), by Application 2024 & 2032
- Figure 30: North America Posterior Segment Eye Diseases Industry Volume Share (%), by Application 2024 & 2032
- Figure 31: North America Posterior Segment Eye Diseases Industry Revenue (Million), by Country 2024 & 2032
- Figure 32: North America Posterior Segment Eye Diseases Industry Volume (K Unit), by Country 2024 & 2032
- Figure 33: North America Posterior Segment Eye Diseases Industry Revenue Share (%), by Country 2024 & 2032
- Figure 34: North America Posterior Segment Eye Diseases Industry Volume Share (%), by Country 2024 & 2032
- Figure 35: Europe Posterior Segment Eye Diseases Industry Revenue (Million), by Product 2024 & 2032
- Figure 36: Europe Posterior Segment Eye Diseases Industry Volume (K Unit), by Product 2024 & 2032
- Figure 37: Europe Posterior Segment Eye Diseases Industry Revenue Share (%), by Product 2024 & 2032
- Figure 38: Europe Posterior Segment Eye Diseases Industry Volume Share (%), by Product 2024 & 2032
- Figure 39: Europe Posterior Segment Eye Diseases Industry Revenue (Million), by Application 2024 & 2032
- Figure 40: Europe Posterior Segment Eye Diseases Industry Volume (K Unit), by Application 2024 & 2032
- Figure 41: Europe Posterior Segment Eye Diseases Industry Revenue Share (%), by Application 2024 & 2032
- Figure 42: Europe Posterior Segment Eye Diseases Industry Volume Share (%), by Application 2024 & 2032
- Figure 43: Europe Posterior Segment Eye Diseases Industry Revenue (Million), by Country 2024 & 2032
- Figure 44: Europe Posterior Segment Eye Diseases Industry Volume (K Unit), by Country 2024 & 2032
- Figure 45: Europe Posterior Segment Eye Diseases Industry Revenue Share (%), by Country 2024 & 2032
- Figure 46: Europe Posterior Segment Eye Diseases Industry Volume Share (%), by Country 2024 & 2032
- Figure 47: Asia Pacific Posterior Segment Eye Diseases Industry Revenue (Million), by Product 2024 & 2032
- Figure 48: Asia Pacific Posterior Segment Eye Diseases Industry Volume (K Unit), by Product 2024 & 2032
- Figure 49: Asia Pacific Posterior Segment Eye Diseases Industry Revenue Share (%), by Product 2024 & 2032
- Figure 50: Asia Pacific Posterior Segment Eye Diseases Industry Volume Share (%), by Product 2024 & 2032
- Figure 51: Asia Pacific Posterior Segment Eye Diseases Industry Revenue (Million), by Application 2024 & 2032
- Figure 52: Asia Pacific Posterior Segment Eye Diseases Industry Volume (K Unit), by Application 2024 & 2032
- Figure 53: Asia Pacific Posterior Segment Eye Diseases Industry Revenue Share (%), by Application 2024 & 2032
- Figure 54: Asia Pacific Posterior Segment Eye Diseases Industry Volume Share (%), by Application 2024 & 2032
- Figure 55: Asia Pacific Posterior Segment Eye Diseases Industry Revenue (Million), by Country 2024 & 2032
- Figure 56: Asia Pacific Posterior Segment Eye Diseases Industry Volume (K Unit), by Country 2024 & 2032
- Figure 57: Asia Pacific Posterior Segment Eye Diseases Industry Revenue Share (%), by Country 2024 & 2032
- Figure 58: Asia Pacific Posterior Segment Eye Diseases Industry Volume Share (%), by Country 2024 & 2032
- Figure 59: Middle East and Africa Posterior Segment Eye Diseases Industry Revenue (Million), by Product 2024 & 2032
- Figure 60: Middle East and Africa Posterior Segment Eye Diseases Industry Volume (K Unit), by Product 2024 & 2032
- Figure 61: Middle East and Africa Posterior Segment Eye Diseases Industry Revenue Share (%), by Product 2024 & 2032
- Figure 62: Middle East and Africa Posterior Segment Eye Diseases Industry Volume Share (%), by Product 2024 & 2032
- Figure 63: Middle East and Africa Posterior Segment Eye Diseases Industry Revenue (Million), by Application 2024 & 2032
- Figure 64: Middle East and Africa Posterior Segment Eye Diseases Industry Volume (K Unit), by Application 2024 & 2032
- Figure 65: Middle East and Africa Posterior Segment Eye Diseases Industry Revenue Share (%), by Application 2024 & 2032
- Figure 66: Middle East and Africa Posterior Segment Eye Diseases Industry Volume Share (%), by Application 2024 & 2032
- Figure 67: Middle East and Africa Posterior Segment Eye Diseases Industry Revenue (Million), by Country 2024 & 2032
- Figure 68: Middle East and Africa Posterior Segment Eye Diseases Industry Volume (K Unit), by Country 2024 & 2032
- Figure 69: Middle East and Africa Posterior Segment Eye Diseases Industry Revenue Share (%), by Country 2024 & 2032
- Figure 70: Middle East and Africa Posterior Segment Eye Diseases Industry Volume Share (%), by Country 2024 & 2032
- Figure 71: South America Posterior Segment Eye Diseases Industry Revenue (Million), by Product 2024 & 2032
- Figure 72: South America Posterior Segment Eye Diseases Industry Volume (K Unit), by Product 2024 & 2032
- Figure 73: South America Posterior Segment Eye Diseases Industry Revenue Share (%), by Product 2024 & 2032
- Figure 74: South America Posterior Segment Eye Diseases Industry Volume Share (%), by Product 2024 & 2032
- Figure 75: South America Posterior Segment Eye Diseases Industry Revenue (Million), by Application 2024 & 2032
- Figure 76: South America Posterior Segment Eye Diseases Industry Volume (K Unit), by Application 2024 & 2032
- Figure 77: South America Posterior Segment Eye Diseases Industry Revenue Share (%), by Application 2024 & 2032
- Figure 78: South America Posterior Segment Eye Diseases Industry Volume Share (%), by Application 2024 & 2032
- Figure 79: South America Posterior Segment Eye Diseases Industry Revenue (Million), by Country 2024 & 2032
- Figure 80: South America Posterior Segment Eye Diseases Industry Volume (K Unit), by Country 2024 & 2032
- Figure 81: South America Posterior Segment Eye Diseases Industry Revenue Share (%), by Country 2024 & 2032
- Figure 82: South America Posterior Segment Eye Diseases Industry Volume Share (%), by Country 2024 & 2032
List of Tables
- Table 1: Global Posterior Segment Eye Diseases Industry Revenue Million Forecast, by Region 2019 & 2032
- Table 2: Global Posterior Segment Eye Diseases Industry Volume K Unit Forecast, by Region 2019 & 2032
- Table 3: Global Posterior Segment Eye Diseases Industry Revenue Million Forecast, by Product 2019 & 2032
- Table 4: Global Posterior Segment Eye Diseases Industry Volume K Unit Forecast, by Product 2019 & 2032
- Table 5: Global Posterior Segment Eye Diseases Industry Revenue Million Forecast, by Application 2019 & 2032
- Table 6: Global Posterior Segment Eye Diseases Industry Volume K Unit Forecast, by Application 2019 & 2032
- Table 7: Global Posterior Segment Eye Diseases Industry Revenue Million Forecast, by Region 2019 & 2032
- Table 8: Global Posterior Segment Eye Diseases Industry Volume K Unit Forecast, by Region 2019 & 2032
- Table 9: Global Posterior Segment Eye Diseases Industry Revenue Million Forecast, by Country 2019 & 2032
- Table 10: Global Posterior Segment Eye Diseases Industry Volume K Unit Forecast, by Country 2019 & 2032
- Table 11: Global Posterior Segment Eye Diseases Industry Revenue Million Forecast, by Country 2019 & 2032
- Table 12: Global Posterior Segment Eye Diseases Industry Volume K Unit Forecast, by Country 2019 & 2032
- Table 13: Global Posterior Segment Eye Diseases Industry Revenue Million Forecast, by Country 2019 & 2032
- Table 14: Global Posterior Segment Eye Diseases Industry Volume K Unit Forecast, by Country 2019 & 2032
- Table 15: Global Posterior Segment Eye Diseases Industry Revenue Million Forecast, by Country 2019 & 2032
- Table 16: Global Posterior Segment Eye Diseases Industry Volume K Unit Forecast, by Country 2019 & 2032
- Table 17: Global Posterior Segment Eye Diseases Industry Revenue Million Forecast, by Country 2019 & 2032
- Table 18: Global Posterior Segment Eye Diseases Industry Volume K Unit Forecast, by Country 2019 & 2032
- Table 19: Global Posterior Segment Eye Diseases Industry Revenue Million Forecast, by Product 2019 & 2032
- Table 20: Global Posterior Segment Eye Diseases Industry Volume K Unit Forecast, by Product 2019 & 2032
- Table 21: Global Posterior Segment Eye Diseases Industry Revenue Million Forecast, by Application 2019 & 2032
- Table 22: Global Posterior Segment Eye Diseases Industry Volume K Unit Forecast, by Application 2019 & 2032
- Table 23: Global Posterior Segment Eye Diseases Industry Revenue Million Forecast, by Country 2019 & 2032
- Table 24: Global Posterior Segment Eye Diseases Industry Volume K Unit Forecast, by Country 2019 & 2032
- Table 25: United States Posterior Segment Eye Diseases Industry Revenue (Million) Forecast, by Application 2019 & 2032
- Table 26: United States Posterior Segment Eye Diseases Industry Volume (K Unit) Forecast, by Application 2019 & 2032
- Table 27: Canada Posterior Segment Eye Diseases Industry Revenue (Million) Forecast, by Application 2019 & 2032
- Table 28: Canada Posterior Segment Eye Diseases Industry Volume (K Unit) Forecast, by Application 2019 & 2032
- Table 29: Mexico Posterior Segment Eye Diseases Industry Revenue (Million) Forecast, by Application 2019 & 2032
- Table 30: Mexico Posterior Segment Eye Diseases Industry Volume (K Unit) Forecast, by Application 2019 & 2032
- Table 31: Global Posterior Segment Eye Diseases Industry Revenue Million Forecast, by Product 2019 & 2032
- Table 32: Global Posterior Segment Eye Diseases Industry Volume K Unit Forecast, by Product 2019 & 2032
- Table 33: Global Posterior Segment Eye Diseases Industry Revenue Million Forecast, by Application 2019 & 2032
- Table 34: Global Posterior Segment Eye Diseases Industry Volume K Unit Forecast, by Application 2019 & 2032
- Table 35: Global Posterior Segment Eye Diseases Industry Revenue Million Forecast, by Country 2019 & 2032
- Table 36: Global Posterior Segment Eye Diseases Industry Volume K Unit Forecast, by Country 2019 & 2032
- Table 37: Germany Posterior Segment Eye Diseases Industry Revenue (Million) Forecast, by Application 2019 & 2032
- Table 38: Germany Posterior Segment Eye Diseases Industry Volume (K Unit) Forecast, by Application 2019 & 2032
- Table 39: United Kingdom Posterior Segment Eye Diseases Industry Revenue (Million) Forecast, by Application 2019 & 2032
- Table 40: United Kingdom Posterior Segment Eye Diseases Industry Volume (K Unit) Forecast, by Application 2019 & 2032
- Table 41: France Posterior Segment Eye Diseases Industry Revenue (Million) Forecast, by Application 2019 & 2032
- Table 42: France Posterior Segment Eye Diseases Industry Volume (K Unit) Forecast, by Application 2019 & 2032
- Table 43: Italy Posterior Segment Eye Diseases Industry Revenue (Million) Forecast, by Application 2019 & 2032
- Table 44: Italy Posterior Segment Eye Diseases Industry Volume (K Unit) Forecast, by Application 2019 & 2032
- Table 45: Spain Posterior Segment Eye Diseases Industry Revenue (Million) Forecast, by Application 2019 & 2032
- Table 46: Spain Posterior Segment Eye Diseases Industry Volume (K Unit) Forecast, by Application 2019 & 2032
- Table 47: Rest of Europe Posterior Segment Eye Diseases Industry Revenue (Million) Forecast, by Application 2019 & 2032
- Table 48: Rest of Europe Posterior Segment Eye Diseases Industry Volume (K Unit) Forecast, by Application 2019 & 2032
- Table 49: Global Posterior Segment Eye Diseases Industry Revenue Million Forecast, by Product 2019 & 2032
- Table 50: Global Posterior Segment Eye Diseases Industry Volume K Unit Forecast, by Product 2019 & 2032
- Table 51: Global Posterior Segment Eye Diseases Industry Revenue Million Forecast, by Application 2019 & 2032
- Table 52: Global Posterior Segment Eye Diseases Industry Volume K Unit Forecast, by Application 2019 & 2032
- Table 53: Global Posterior Segment Eye Diseases Industry Revenue Million Forecast, by Country 2019 & 2032
- Table 54: Global Posterior Segment Eye Diseases Industry Volume K Unit Forecast, by Country 2019 & 2032
- Table 55: China Posterior Segment Eye Diseases Industry Revenue (Million) Forecast, by Application 2019 & 2032
- Table 56: China Posterior Segment Eye Diseases Industry Volume (K Unit) Forecast, by Application 2019 & 2032
- Table 57: Japan Posterior Segment Eye Diseases Industry Revenue (Million) Forecast, by Application 2019 & 2032
- Table 58: Japan Posterior Segment Eye Diseases Industry Volume (K Unit) Forecast, by Application 2019 & 2032
- Table 59: India Posterior Segment Eye Diseases Industry Revenue (Million) Forecast, by Application 2019 & 2032
- Table 60: India Posterior Segment Eye Diseases Industry Volume (K Unit) Forecast, by Application 2019 & 2032
- Table 61: Australia Posterior Segment Eye Diseases Industry Revenue (Million) Forecast, by Application 2019 & 2032
- Table 62: Australia Posterior Segment Eye Diseases Industry Volume (K Unit) Forecast, by Application 2019 & 2032
- Table 63: South Korea Posterior Segment Eye Diseases Industry Revenue (Million) Forecast, by Application 2019 & 2032
- Table 64: South Korea Posterior Segment Eye Diseases Industry Volume (K Unit) Forecast, by Application 2019 & 2032
- Table 65: Rest of Asia Pacific Posterior Segment Eye Diseases Industry Revenue (Million) Forecast, by Application 2019 & 2032
- Table 66: Rest of Asia Pacific Posterior Segment Eye Diseases Industry Volume (K Unit) Forecast, by Application 2019 & 2032
- Table 67: Global Posterior Segment Eye Diseases Industry Revenue Million Forecast, by Product 2019 & 2032
- Table 68: Global Posterior Segment Eye Diseases Industry Volume K Unit Forecast, by Product 2019 & 2032
- Table 69: Global Posterior Segment Eye Diseases Industry Revenue Million Forecast, by Application 2019 & 2032
- Table 70: Global Posterior Segment Eye Diseases Industry Volume K Unit Forecast, by Application 2019 & 2032
- Table 71: Global Posterior Segment Eye Diseases Industry Revenue Million Forecast, by Country 2019 & 2032
- Table 72: Global Posterior Segment Eye Diseases Industry Volume K Unit Forecast, by Country 2019 & 2032
- Table 73: GCC Posterior Segment Eye Diseases Industry Revenue (Million) Forecast, by Application 2019 & 2032
- Table 74: GCC Posterior Segment Eye Diseases Industry Volume (K Unit) Forecast, by Application 2019 & 2032
- Table 75: South Africa Posterior Segment Eye Diseases Industry Revenue (Million) Forecast, by Application 2019 & 2032
- Table 76: South Africa Posterior Segment Eye Diseases Industry Volume (K Unit) Forecast, by Application 2019 & 2032
- Table 77: Rest of Middle East and Africa Posterior Segment Eye Diseases Industry Revenue (Million) Forecast, by Application 2019 & 2032
- Table 78: Rest of Middle East and Africa Posterior Segment Eye Diseases Industry Volume (K Unit) Forecast, by Application 2019 & 2032
- Table 79: Global Posterior Segment Eye Diseases Industry Revenue Million Forecast, by Product 2019 & 2032
- Table 80: Global Posterior Segment Eye Diseases Industry Volume K Unit Forecast, by Product 2019 & 2032
- Table 81: Global Posterior Segment Eye Diseases Industry Revenue Million Forecast, by Application 2019 & 2032
- Table 82: Global Posterior Segment Eye Diseases Industry Volume K Unit Forecast, by Application 2019 & 2032
- Table 83: Global Posterior Segment Eye Diseases Industry Revenue Million Forecast, by Country 2019 & 2032
- Table 84: Global Posterior Segment Eye Diseases Industry Volume K Unit Forecast, by Country 2019 & 2032
- Table 85: Brazil Posterior Segment Eye Diseases Industry Revenue (Million) Forecast, by Application 2019 & 2032
- Table 86: Brazil Posterior Segment Eye Diseases Industry Volume (K Unit) Forecast, by Application 2019 & 2032
- Table 87: Argentina Posterior Segment Eye Diseases Industry Revenue (Million) Forecast, by Application 2019 & 2032
- Table 88: Argentina Posterior Segment Eye Diseases Industry Volume (K Unit) Forecast, by Application 2019 & 2032
- Table 89: Rest of South America Posterior Segment Eye Diseases Industry Revenue (Million) Forecast, by Application 2019 & 2032
- Table 90: Rest of South America Posterior Segment Eye Diseases Industry Volume (K Unit) Forecast, by Application 2019 & 2032
Frequently Asked Questions
1. What is the projected Compound Annual Growth Rate (CAGR) of the Posterior Segment Eye Diseases Industry?
The projected CAGR is approximately 5.42%.
2. Which companies are prominent players in the Posterior Segment Eye Diseases Industry?
Key companies in the market include Aerie Pharmaceuticals, Rainbow Medical Ltd (Nano Retina), Second Sight Medical Products Inc, Regeneron Pharmaceuticals Inc, Novartis AG, Merck & Co Inc, Santen Pharmaceuticals, Abbvie Inc (Allergen PLC), F Hoffmann-La Roche, Alcon Inc, Bausch Health Companies Inc.
3. What are the main segments of the Posterior Segment Eye Diseases Industry?
The market segments include Product, Application.
4. Can you provide details about the market size?
The market size is estimated to be USD 32.12 Million as of 2022.
5. What are some drivers contributing to market growth?
Increasing Burden of Back of the Eye Disorders; Growing R&D for New Therapies for the Treatment of Posterior Segment Eye Disorders.
6. What are the notable trends driving market growth?
Small Molecules by Drugs Segment is Expected to Hold a Significant Market Share Over the Forecast Period.
7. Are there any restraints impacting market growth?
Stringent Regulatory Policies.
8. Can you provide examples of recent developments in the market?
In June 2022, Amring Pharmaceuticals Inc. (Amring) received the US FDA approval for generic Timolol Maleate Ophthalmic Solution, USP 0.5%, 60 pack of 0.3mL unit dose vials (AT3 rated generic equivalent of Timoptic in Ocudose).
9. What pricing options are available for accessing the report?
Pricing options include single-user, multi-user, and enterprise licenses priced at USD 4750, USD 5250, and USD 8750 respectively.
10. Is the market size provided in terms of value or volume?
The market size is provided in terms of value, measured in Million and volume, measured in K Unit.
11. Are there any specific market keywords associated with the report?
Yes, the market keyword associated with the report is "Posterior Segment Eye Diseases Industry," which aids in identifying and referencing the specific market segment covered.
12. How do I determine which pricing option suits my needs best?
The pricing options vary based on user requirements and access needs. Individual users may opt for single-user licenses, while businesses requiring broader access may choose multi-user or enterprise licenses for cost-effective access to the report.
13. Are there any additional resources or data provided in the Posterior Segment Eye Diseases Industry report?
While the report offers comprehensive insights, it's advisable to review the specific contents or supplementary materials provided to ascertain if additional resources or data are available.
14. How can I stay updated on further developments or reports in the Posterior Segment Eye Diseases Industry?
To stay informed about further developments, trends, and reports in the Posterior Segment Eye Diseases Industry, consider subscribing to industry newsletters, following relevant companies and organizations, or regularly checking reputable industry news sources and publications.
Methodology
Step 1 - Identification of Relevant Samples Size from Population Database


Step 2 - Approaches for Defining Global Market Size (Value, Volume* & Price*)

Note*: In applicable scenarios
Step 3 - Data Sources
Primary Research
- Web Analytics
- Survey Reports
- Research Institute
- Latest Research Reports
- Opinion Leaders
Secondary Research
- Annual Reports
- White Paper
- Latest Press Release
- Industry Association
- Paid Database
- Investor Presentations

Step 4 - Data Triangulation
Involves using different sources of information in order to increase the validity of a study
These sources are likely to be stakeholders in a program - participants, other researchers, program staff, other community members, and so on.
Then we put all data in single framework & apply various statistical tools to find out the dynamic on the market.
During the analysis stage, feedback from the stakeholder groups would be compared to determine areas of agreement as well as areas of divergence


