
Key Insights
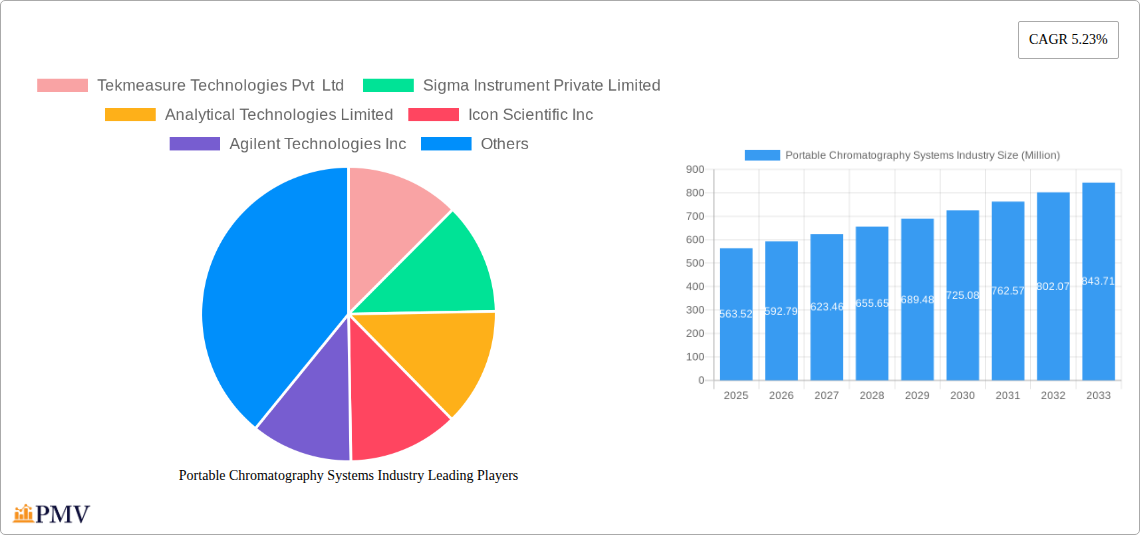
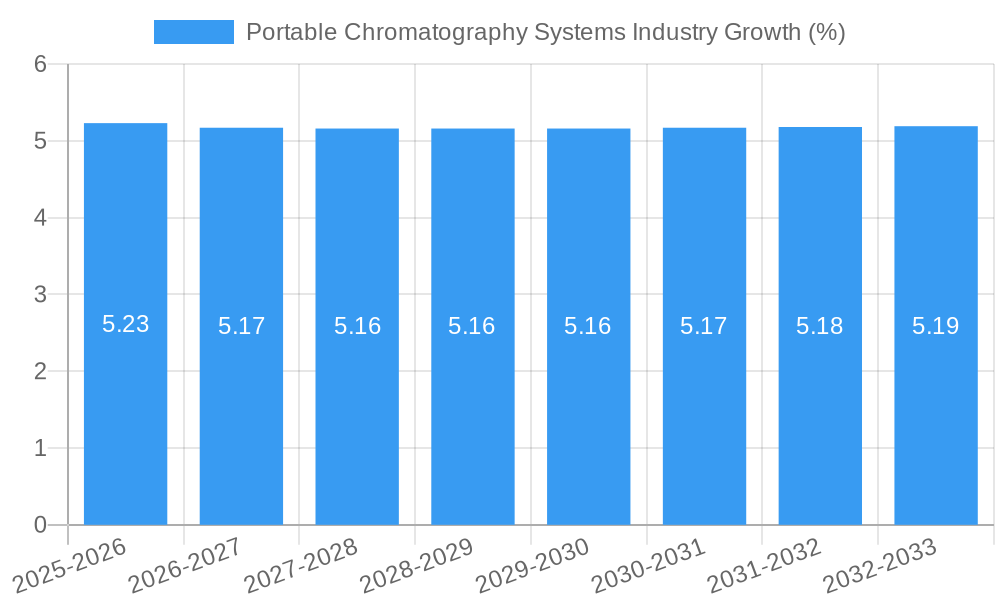
The global Portable Chromatography Systems market is poised for robust expansion, projected to reach a significant valuation of USD 563.52 million by 2025, driven by a Compound Annual Growth Rate (CAGR) of 5.23% throughout the forecast period extending to 2033. This growth is largely fueled by the increasing demand for real-time, on-site analysis across diverse industries, particularly in biotechnology and pharmaceuticals for quality control, impurity profiling, and process monitoring. The inherent portability of these systems allows for immediate sample analysis, reducing turnaround times and enhancing operational efficiency, a critical factor in fast-paced research and development environments. Furthermore, advancements in miniaturization and detector technology are making these systems more accessible and versatile, expanding their application scope. The market is segmented into person-portable and transportable devices, with both portable gas and liquid chromatography systems experiencing healthy adoption.
The market's upward trajectory is further supported by the increasing stringency of regulatory compliance in pharmaceutical manufacturing and a growing emphasis on environmental monitoring, where portable chromatography offers crucial on-the-spot detection capabilities. Key drivers include the need for rapid diagnostics, field-based environmental testing, and the expansion of point-of-care medical applications. While opportunities abound, restraints such as the initial high cost of advanced systems and the requirement for skilled personnel for operation and maintenance present challenges that manufacturers are actively addressing through technological innovation and user-friendly designs. The market's competitive landscape features prominent players like Agilent Technologies Inc. and PerkinElmer Inc., alongside emerging innovators, all vying to capture market share through product differentiation and strategic partnerships.
This comprehensive report delves into the dynamic Portable Chromatography Systems Industry, providing a detailed analysis of market structure, trends, competitive landscape, and future growth prospects. Covering the period from 2019 to 2033, with a base year of 2025, this report offers actionable insights for stakeholders seeking to understand and capitalize on the evolving portable GC and LC market.
Portable Chromatography Systems Industry Market Structure & Competitive Dynamics
The Portable Chromatography Systems Market exhibits a moderately concentrated structure, with key players such as Agilent Technologies Inc., PerkinElmer Inc., and INFICON holding significant market share. Innovation ecosystems are thriving, driven by a continuous pursuit of enhanced portability, sensitivity, and user-friendliness in portable gas chromatography and portable liquid chromatography systems. Regulatory frameworks, particularly those governing environmental monitoring and industrial safety, play a crucial role in shaping market entry and product development. Product substitutes, while present in some niche applications, are largely outpaced by the unique advantages offered by chromatography, such as precise compound identification and quantification. End-user trends are increasingly favoring on-site analysis, reducing the need for laboratory-based testing and driving demand for person portable chromatography solutions. Merger and acquisition (M&A) activities, while not consistently high, are strategic in nature, aiming to consolidate market presence or acquire specialized technologies. For instance, a recent strategic acquisition in the biotechnology and pharmaceutical segments by a leading vendor was valued at an estimated $150 Million, underscoring the consolidation potential within the industry. The market share distribution for the base year 2025 is estimated as: Agilent Technologies Inc. (22%), PerkinElmer Inc. (18%), INFICON (15%), and a combined 45% for other key players.
Portable Chromatography Systems Industry Industry Trends & Insights
The Portable Chromatography Systems Industry is experiencing robust growth, projected at a Compound Annual Growth Rate (CAGR) of approximately 7.5% over the forecast period of 2025–2033. This growth is fueled by several interconnected trends. The increasing global focus on environmental monitoring, particularly concerning air and water quality, is a primary driver. This necessitates rapid, on-site analysis capabilities that transportable chromatography systems and person portable chromatography devices provide, reducing sample turnaround times and costs. Technological advancements are continuously pushing the boundaries of miniaturization, power efficiency, and data processing, making these systems more accessible and user-friendly. The burgeoning biotechnology and pharmaceutical companies are significant contributors, leveraging portable chromatography for quality control, process monitoring, and drug discovery applications. The expanding reach of research laboratories, especially in remote or field-based research, also fuels demand. Consumer preferences are shifting towards solutions that offer immediate results and operational flexibility, aligning perfectly with the core value proposition of portable chromatography. Competitive dynamics are characterized by intense innovation, with companies striving to differentiate through superior performance, specialized functionalities, and competitive pricing. The market penetration for portable chromatography systems, currently estimated at around 40% in developed regions, is expected to rise significantly as awareness and adoption increase in emerging economies. The ongoing development of advanced detectors and integrated software solutions further enhances the value proposition, making these systems indispensable tools across various sectors.
Dominant Markets & Segments in Portable Chromatography Systems Industry
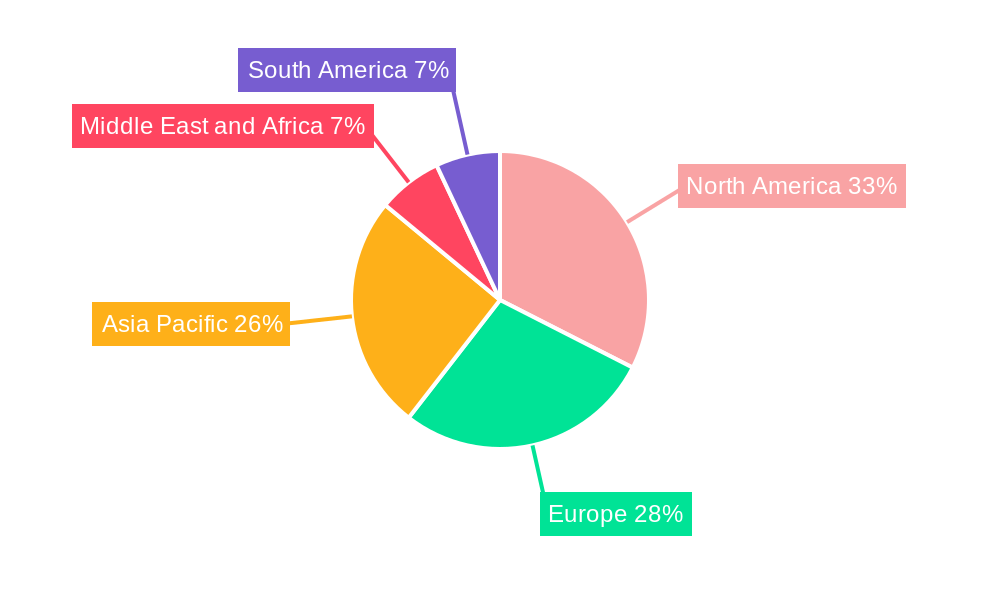
The Portable Chromatography Systems Industry is witnessing significant dominance from certain regions and segments. North America, particularly the United States, and Europe are leading markets due to their well-established regulatory frameworks, high R&D spending, and the presence of a large number of biotechnology and pharmaceutical companies.
Dominant Region/Country:
- North America: Characterized by strong government initiatives for environmental protection and substantial investment in healthcare research and development. Economic policies supporting innovation and robust infrastructure for distribution further bolster its leading position. The market size for portable chromatography systems in North America is estimated at $450 Million in 2025.
- Europe: Driven by stringent environmental regulations and a mature pharmaceutical industry. The focus on sustainable development and industrial safety standards contributes to consistent demand.
Dominant Portability Segment:
- Transportable: Currently holds a larger market share due to its balance of portability and analytical capability, suitable for mobile labs and field investigations. Estimated market size for transportable systems in 2025 is $380 Million.
- Person Portable: Experiencing rapid growth due to advancements in miniaturization, enabling direct on-site, real-time analysis in demanding environments.
Dominant Type Segment:
- Portable Gas Chromatography Systems (Portable GC): Dominates due to its widespread application in environmental monitoring, industrial safety, and homeland security. The ability to detect a wide range of volatile organic compounds (VOCs) makes it indispensable. Estimated market size for portable GC in 2025 is $420 Million.
- Portable Liquid Chromatography Systems (Portable LC): Growing rapidly, particularly in pharmaceutical quality control and food safety analysis, offering precise analysis of non-volatile compounds.
Dominant End-User Segment:
- Biotechnology and Pharmaceutical Companies: Represent the largest end-user segment, leveraging portable chromatography for in-process control, quality assurance, and research. The stringent quality requirements in this sector drive the adoption of advanced analytical solutions. Estimated market size for this segment in 2025 is $480 Million.
- Research Laboratories: Play a crucial role, especially in academic and government-funded research, for field studies and specialized analytical tasks.
Portable Chromatography Systems Industry Product Innovations
Product innovation in the Portable Chromatography Systems Industry is focused on miniaturization, enhanced sensitivity, faster analysis times, and user-friendly interfaces. Key developments include the integration of advanced detectors like mass spectrometers for comprehensive identification, improved battery life for extended field operations, and the incorporation of AI-driven data analysis for simplified interpretation. These innovations are leading to more versatile and powerful portable GC and LC solutions, offering significant competitive advantages by enabling on-site, real-time decision-making in diverse environments, from industrial sites to remote environmental monitoring locations. The market fit is enhanced by ruggedized designs and wireless connectivity options.
Report Segmentation & Scope
This report segments the Portable Chromatography Systems Industry across key parameters to provide a granular view of market dynamics.
Portability: The market is divided into Person Portable and Transportable systems. Person portable systems, characterized by their compact size and lightweight design, are crucial for immediate, on-the-spot analysis. Transportable systems offer a balance of mobility and advanced analytical capabilities, suitable for mobile laboratories. The person portable segment is projected to grow at a CAGR of 8.2% from 2025–2033, reaching an estimated market size of $350 Million by 2033, while transportable systems are expected to reach $550 Million with a CAGR of 6.9%.
Type: The report distinguishes between Portable Gas Chromatography Systems (Portable GC) and Portable Liquid Chromatography Systems (Portable LC). Portable GC systems, with an estimated market size of $420 Million in 2025, continue to lead due to their broad applications in environmental and safety testing. Portable LC systems, estimated at $300 Million in 2025, are experiencing rapid growth driven by the pharmaceutical and food industries, projected to reach $500 Million by 2033 at a CAGR of 7.8%.
End-User: Key end-user segments include Biotechnology and Pharmaceutical Companies, Research Laboratories, and Others. Biotechnology and Pharmaceutical Companies, representing the largest segment with an estimated $480 Million in 2025, are expected to grow at a CAGR of 7.2% to reach $800 Million by 2033. Research Laboratories are also a significant driver, with an estimated market of $250 Million in 2025 and projected growth to $400 Million by 2033. The "Others" category encompasses industrial sectors like environmental monitoring, homeland security, and food safety, with a combined market size of $190 Million in 2025, growing to $300 Million by 2033.
Key Drivers of Portable Chromatography Systems Industry Growth
The Portable Chromatography Systems Industry is propelled by a confluence of potent growth drivers. Technological advancements, particularly in miniaturization and sensor technology, are making systems more compact, sensitive, and affordable. Increasing global emphasis on environmental monitoring and stringent regulations for air and water quality necessitate on-site analytical capabilities, directly benefiting portable chromatography. The expanding pharmaceutical and biotechnology sectors, with their need for rapid quality control and process monitoring, represent a significant demand source. Furthermore, government initiatives promoting industrial safety and emergency response preparedness fuel the adoption of portable analytical instruments. The growing trend towards decentralized analysis and the need for real-time data in field applications are also key accelerators.
Challenges in the Portable Chromatography Systems Industry Sector
Despite strong growth, the Portable Chromatography Systems Industry Sector faces several challenges. High initial equipment costs can be a barrier for smaller organizations and research institutions. The need for specialized training to operate and maintain these advanced instruments can also limit widespread adoption. Regulatory complexities and the varying standards across different regions can create hurdles for manufacturers. Supply chain disruptions and the availability of skilled labor for manufacturing and servicing also pose potential risks. Moreover, intense competition among key players can lead to price pressures, impacting profit margins for some product segments. Continuous research and development investment is required to stay competitive, which can be a significant challenge for smaller companies.
Leading Players in the Portable Chromatography Systems Industry Market
- Agilent Technologies Inc.
- PerkinElmer Inc.
- INFICON
- Axcend
- Tekmeasure Technologies Pvt Ltd
- Sigma Instrument Private Limited
- Analytical Technologies Limited
- Icon Scientific Inc
- FLIR Systems Inc.
Key Developments in Portable Chromatography Systems Industry Sector
- 2024 February: Axcend launched a new ultra-high pressure liquid chromatography (UHPLC) system with enhanced portability and speed, targeting pharmaceutical QC.
- 2023 November: Agilent Technologies Inc. introduced a next-generation portable gas chromatograph with improved sensitivity and faster detection limits for environmental monitoring.
- 2023 July: PerkinElmer Inc. announced the acquisition of a key player in portable mass spectrometry, strengthening its analytical portfolio.
- 2023 March: INFICON expanded its portable GC product line with an emphasis on industrial process monitoring applications.
- 2022 December: FLIR Systems Inc. integrated advanced sensor technology into its portable detection systems, enhancing multi-gas analysis capabilities.
Strategic Portable Chromatography Systems Industry Market Outlook
The Portable Chromatography Systems Industry is poised for sustained growth, driven by ongoing innovation and increasing demand for real-time, on-site analytical solutions. Strategic opportunities lie in developing ultra-portable, highly sensitive, and user-friendly systems catering to emerging markets and niche applications like point-of-care diagnostics and advanced food safety testing. Partnerships and collaborations will be crucial for expanding market reach and technological integration. The continued focus on environmental regulations and the evolving needs of the pharmaceutical and biotechnology sectors will shape future market trends, presenting significant growth accelerators for vendors who can adapt and innovate effectively. The market is expected to see increased adoption of cloud-based data management and AI-driven analytics, further enhancing the value proposition of portable chromatography.
Portable Chromatography Systems Industry Segmentation
-
1. Portability
- 1.1. Person Portable
- 1.2. Transportable
-
2. Type
- 2.1. Portable Gas Chromatography Systems
- 2.2. Portable Liquid Chromatography Systems
-
3. End-User
- 3.1. Biotechnology and Pharmaceutical Companies
- 3.2. Research Laboratories
- 3.3. Others
Portable Chromatography Systems Industry Segmentation By Geography
-
1. North America
- 1.1. United States
- 1.2. Canada
- 1.3. Mexico
-
2. Europe
- 2.1. Germany
- 2.2. United Kingdom
- 2.3. France
- 2.4. Italy
- 2.5. Spain
- 2.6. Rest of Europe
-
3. Asia Pacific
- 3.1. China
- 3.2. Japan
- 3.3. India
- 3.4. Australia
- 3.5. South Korea
- 3.6. Rest of Asia Pacific
-
4. Middle East and Africa
- 4.1. GCC
- 4.2. South Africa
- 4.3. Rest of Middle East and Africa
-
5. South America
- 5.1. Brazil
- 5.2. Argentina
- 5.3. Rest of South America
Portable Chromatography Systems Industry REPORT HIGHLIGHTS
| Aspects | Details |
|---|---|
| Study Period | 2019-2033 |
| Base Year | 2024 |
| Estimated Year | 2025 |
| Forecast Period | 2025-2033 |
| Historical Period | 2019-2024 |
| Growth Rate | CAGR of 5.23% from 2019-2033 |
| Segmentation |
|
Table of Contents
- 1. Introduction
- 1.1. Research Scope
- 1.2. Market Segmentation
- 1.3. Research Methodology
- 1.4. Definitions and Assumptions
- 2. Executive Summary
- 2.1. Introduction
- 3. Market Dynamics
- 3.1. Introduction
- 3.2. Market Drivers
- 3.2.1. ; Advancements in Device Technologies; Growing Applications of Portable Chromatography Systems
- 3.3. Market Restrains
- 3.3.1. ; High Cost of Portable Chromatography Techniques
- 3.4. Market Trends
- 3.4.1. Transportable Chromatography Systems to Grow at a Significant Rate
- 4. Market Factor Analysis
- 4.1. Porters Five Forces
- 4.2. Supply/Value Chain
- 4.3. PESTEL analysis
- 4.4. Market Entropy
- 4.5. Patent/Trademark Analysis
- 5. Global Portable Chromatography Systems Industry Analysis, Insights and Forecast, 2019-2031
- 5.1. Market Analysis, Insights and Forecast - by Portability
- 5.1.1. Person Portable
- 5.1.2. Transportable
- 5.2. Market Analysis, Insights and Forecast - by Type
- 5.2.1. Portable Gas Chromatography Systems
- 5.2.2. Portable Liquid Chromatography Systems
- 5.3. Market Analysis, Insights and Forecast - by End-User
- 5.3.1. Biotechnology and Pharmaceutical Companies
- 5.3.2. Research Laboratories
- 5.3.3. Others
- 5.4. Market Analysis, Insights and Forecast - by Region
- 5.4.1. North America
- 5.4.2. Europe
- 5.4.3. Asia Pacific
- 5.4.4. Middle East and Africa
- 5.4.5. South America
- 5.1. Market Analysis, Insights and Forecast - by Portability
- 6. North America Portable Chromatography Systems Industry Analysis, Insights and Forecast, 2019-2031
- 6.1. Market Analysis, Insights and Forecast - by Portability
- 6.1.1. Person Portable
- 6.1.2. Transportable
- 6.2. Market Analysis, Insights and Forecast - by Type
- 6.2.1. Portable Gas Chromatography Systems
- 6.2.2. Portable Liquid Chromatography Systems
- 6.3. Market Analysis, Insights and Forecast - by End-User
- 6.3.1. Biotechnology and Pharmaceutical Companies
- 6.3.2. Research Laboratories
- 6.3.3. Others
- 6.1. Market Analysis, Insights and Forecast - by Portability
- 7. Europe Portable Chromatography Systems Industry Analysis, Insights and Forecast, 2019-2031
- 7.1. Market Analysis, Insights and Forecast - by Portability
- 7.1.1. Person Portable
- 7.1.2. Transportable
- 7.2. Market Analysis, Insights and Forecast - by Type
- 7.2.1. Portable Gas Chromatography Systems
- 7.2.2. Portable Liquid Chromatography Systems
- 7.3. Market Analysis, Insights and Forecast - by End-User
- 7.3.1. Biotechnology and Pharmaceutical Companies
- 7.3.2. Research Laboratories
- 7.3.3. Others
- 7.1. Market Analysis, Insights and Forecast - by Portability
- 8. Asia Pacific Portable Chromatography Systems Industry Analysis, Insights and Forecast, 2019-2031
- 8.1. Market Analysis, Insights and Forecast - by Portability
- 8.1.1. Person Portable
- 8.1.2. Transportable
- 8.2. Market Analysis, Insights and Forecast - by Type
- 8.2.1. Portable Gas Chromatography Systems
- 8.2.2. Portable Liquid Chromatography Systems
- 8.3. Market Analysis, Insights and Forecast - by End-User
- 8.3.1. Biotechnology and Pharmaceutical Companies
- 8.3.2. Research Laboratories
- 8.3.3. Others
- 8.1. Market Analysis, Insights and Forecast - by Portability
- 9. Middle East and Africa Portable Chromatography Systems Industry Analysis, Insights and Forecast, 2019-2031
- 9.1. Market Analysis, Insights and Forecast - by Portability
- 9.1.1. Person Portable
- 9.1.2. Transportable
- 9.2. Market Analysis, Insights and Forecast - by Type
- 9.2.1. Portable Gas Chromatography Systems
- 9.2.2. Portable Liquid Chromatography Systems
- 9.3. Market Analysis, Insights and Forecast - by End-User
- 9.3.1. Biotechnology and Pharmaceutical Companies
- 9.3.2. Research Laboratories
- 9.3.3. Others
- 9.1. Market Analysis, Insights and Forecast - by Portability
- 10. South America Portable Chromatography Systems Industry Analysis, Insights and Forecast, 2019-2031
- 10.1. Market Analysis, Insights and Forecast - by Portability
- 10.1.1. Person Portable
- 10.1.2. Transportable
- 10.2. Market Analysis, Insights and Forecast - by Type
- 10.2.1. Portable Gas Chromatography Systems
- 10.2.2. Portable Liquid Chromatography Systems
- 10.3. Market Analysis, Insights and Forecast - by End-User
- 10.3.1. Biotechnology and Pharmaceutical Companies
- 10.3.2. Research Laboratories
- 10.3.3. Others
- 10.1. Market Analysis, Insights and Forecast - by Portability
- 11. North America Portable Chromatography Systems Industry Analysis, Insights and Forecast, 2019-2031
- 11.1. Market Analysis, Insights and Forecast - By Country/Sub-region
- 11.1.1 United States
- 11.1.2 Canada
- 11.1.3 Mexico
- 12. Europe Portable Chromatography Systems Industry Analysis, Insights and Forecast, 2019-2031
- 12.1. Market Analysis, Insights and Forecast - By Country/Sub-region
- 12.1.1 Germany
- 12.1.2 United Kingdom
- 12.1.3 France
- 12.1.4 Italy
- 12.1.5 Spain
- 12.1.6 Rest of Europe
- 13. Asia Pacific Portable Chromatography Systems Industry Analysis, Insights and Forecast, 2019-2031
- 13.1. Market Analysis, Insights and Forecast - By Country/Sub-region
- 13.1.1 China
- 13.1.2 Japan
- 13.1.3 India
- 13.1.4 Australia
- 13.1.5 South Korea
- 13.1.6 Rest of Asia Pacific
- 14. Middle East and Africa Portable Chromatography Systems Industry Analysis, Insights and Forecast, 2019-2031
- 14.1. Market Analysis, Insights and Forecast - By Country/Sub-region
- 14.1.1 GCC
- 14.1.2 South Africa
- 14.1.3 Rest of Middle East and Africa
- 15. South America Portable Chromatography Systems Industry Analysis, Insights and Forecast, 2019-2031
- 15.1. Market Analysis, Insights and Forecast - By Country/Sub-region
- 15.1.1 Brazil
- 15.1.2 Argentina
- 15.1.3 Rest of South America
- 16. Competitive Analysis
- 16.1. Global Market Share Analysis 2024
- 16.2. Company Profiles
- 16.2.1 Tekmeasure Technologies Pvt Ltd
- 16.2.1.1. Overview
- 16.2.1.2. Products
- 16.2.1.3. SWOT Analysis
- 16.2.1.4. Recent Developments
- 16.2.1.5. Financials (Based on Availability)
- 16.2.2 Sigma Instrument Private Limited
- 16.2.2.1. Overview
- 16.2.2.2. Products
- 16.2.2.3. SWOT Analysis
- 16.2.2.4. Recent Developments
- 16.2.2.5. Financials (Based on Availability)
- 16.2.3 Analytical Technologies Limited
- 16.2.3.1. Overview
- 16.2.3.2. Products
- 16.2.3.3. SWOT Analysis
- 16.2.3.4. Recent Developments
- 16.2.3.5. Financials (Based on Availability)
- 16.2.4 Icon Scientific Inc
- 16.2.4.1. Overview
- 16.2.4.2. Products
- 16.2.4.3. SWOT Analysis
- 16.2.4.4. Recent Developments
- 16.2.4.5. Financials (Based on Availability)
- 16.2.5 Agilent Technologies Inc
- 16.2.5.1. Overview
- 16.2.5.2. Products
- 16.2.5.3. SWOT Analysis
- 16.2.5.4. Recent Developments
- 16.2.5.5. Financials (Based on Availability)
- 16.2.6 PerkinElmer Inc
- 16.2.6.1. Overview
- 16.2.6.2. Products
- 16.2.6.3. SWOT Analysis
- 16.2.6.4. Recent Developments
- 16.2.6.5. Financials (Based on Availability)
- 16.2.7 INFICON
- 16.2.7.1. Overview
- 16.2.7.2. Products
- 16.2.7.3. SWOT Analysis
- 16.2.7.4. Recent Developments
- 16.2.7.5. Financials (Based on Availability)
- 16.2.8 Axcend
- 16.2.8.1. Overview
- 16.2.8.2. Products
- 16.2.8.3. SWOT Analysis
- 16.2.8.4. Recent Developments
- 16.2.8.5. Financials (Based on Availability)
- 16.2.9 FLIR Systems Inc
- 16.2.9.1. Overview
- 16.2.9.2. Products
- 16.2.9.3. SWOT Analysis
- 16.2.9.4. Recent Developments
- 16.2.9.5. Financials (Based on Availability)
- 16.2.1 Tekmeasure Technologies Pvt Ltd
List of Figures
- Figure 1: Global Portable Chromatography Systems Industry Revenue Breakdown (Million, %) by Region 2024 & 2032
- Figure 2: Global Portable Chromatography Systems Industry Volume Breakdown (K Unit, %) by Region 2024 & 2032
- Figure 3: North America Portable Chromatography Systems Industry Revenue (Million), by Country 2024 & 2032
- Figure 4: North America Portable Chromatography Systems Industry Volume (K Unit), by Country 2024 & 2032
- Figure 5: North America Portable Chromatography Systems Industry Revenue Share (%), by Country 2024 & 2032
- Figure 6: North America Portable Chromatography Systems Industry Volume Share (%), by Country 2024 & 2032
- Figure 7: Europe Portable Chromatography Systems Industry Revenue (Million), by Country 2024 & 2032
- Figure 8: Europe Portable Chromatography Systems Industry Volume (K Unit), by Country 2024 & 2032
- Figure 9: Europe Portable Chromatography Systems Industry Revenue Share (%), by Country 2024 & 2032
- Figure 10: Europe Portable Chromatography Systems Industry Volume Share (%), by Country 2024 & 2032
- Figure 11: Asia Pacific Portable Chromatography Systems Industry Revenue (Million), by Country 2024 & 2032
- Figure 12: Asia Pacific Portable Chromatography Systems Industry Volume (K Unit), by Country 2024 & 2032
- Figure 13: Asia Pacific Portable Chromatography Systems Industry Revenue Share (%), by Country 2024 & 2032
- Figure 14: Asia Pacific Portable Chromatography Systems Industry Volume Share (%), by Country 2024 & 2032
- Figure 15: Middle East and Africa Portable Chromatography Systems Industry Revenue (Million), by Country 2024 & 2032
- Figure 16: Middle East and Africa Portable Chromatography Systems Industry Volume (K Unit), by Country 2024 & 2032
- Figure 17: Middle East and Africa Portable Chromatography Systems Industry Revenue Share (%), by Country 2024 & 2032
- Figure 18: Middle East and Africa Portable Chromatography Systems Industry Volume Share (%), by Country 2024 & 2032
- Figure 19: South America Portable Chromatography Systems Industry Revenue (Million), by Country 2024 & 2032
- Figure 20: South America Portable Chromatography Systems Industry Volume (K Unit), by Country 2024 & 2032
- Figure 21: South America Portable Chromatography Systems Industry Revenue Share (%), by Country 2024 & 2032
- Figure 22: South America Portable Chromatography Systems Industry Volume Share (%), by Country 2024 & 2032
- Figure 23: North America Portable Chromatography Systems Industry Revenue (Million), by Portability 2024 & 2032
- Figure 24: North America Portable Chromatography Systems Industry Volume (K Unit), by Portability 2024 & 2032
- Figure 25: North America Portable Chromatography Systems Industry Revenue Share (%), by Portability 2024 & 2032
- Figure 26: North America Portable Chromatography Systems Industry Volume Share (%), by Portability 2024 & 2032
- Figure 27: North America Portable Chromatography Systems Industry Revenue (Million), by Type 2024 & 2032
- Figure 28: North America Portable Chromatography Systems Industry Volume (K Unit), by Type 2024 & 2032
- Figure 29: North America Portable Chromatography Systems Industry Revenue Share (%), by Type 2024 & 2032
- Figure 30: North America Portable Chromatography Systems Industry Volume Share (%), by Type 2024 & 2032
- Figure 31: North America Portable Chromatography Systems Industry Revenue (Million), by End-User 2024 & 2032
- Figure 32: North America Portable Chromatography Systems Industry Volume (K Unit), by End-User 2024 & 2032
- Figure 33: North America Portable Chromatography Systems Industry Revenue Share (%), by End-User 2024 & 2032
- Figure 34: North America Portable Chromatography Systems Industry Volume Share (%), by End-User 2024 & 2032
- Figure 35: North America Portable Chromatography Systems Industry Revenue (Million), by Country 2024 & 2032
- Figure 36: North America Portable Chromatography Systems Industry Volume (K Unit), by Country 2024 & 2032
- Figure 37: North America Portable Chromatography Systems Industry Revenue Share (%), by Country 2024 & 2032
- Figure 38: North America Portable Chromatography Systems Industry Volume Share (%), by Country 2024 & 2032
- Figure 39: Europe Portable Chromatography Systems Industry Revenue (Million), by Portability 2024 & 2032
- Figure 40: Europe Portable Chromatography Systems Industry Volume (K Unit), by Portability 2024 & 2032
- Figure 41: Europe Portable Chromatography Systems Industry Revenue Share (%), by Portability 2024 & 2032
- Figure 42: Europe Portable Chromatography Systems Industry Volume Share (%), by Portability 2024 & 2032
- Figure 43: Europe Portable Chromatography Systems Industry Revenue (Million), by Type 2024 & 2032
- Figure 44: Europe Portable Chromatography Systems Industry Volume (K Unit), by Type 2024 & 2032
- Figure 45: Europe Portable Chromatography Systems Industry Revenue Share (%), by Type 2024 & 2032
- Figure 46: Europe Portable Chromatography Systems Industry Volume Share (%), by Type 2024 & 2032
- Figure 47: Europe Portable Chromatography Systems Industry Revenue (Million), by End-User 2024 & 2032
- Figure 48: Europe Portable Chromatography Systems Industry Volume (K Unit), by End-User 2024 & 2032
- Figure 49: Europe Portable Chromatography Systems Industry Revenue Share (%), by End-User 2024 & 2032
- Figure 50: Europe Portable Chromatography Systems Industry Volume Share (%), by End-User 2024 & 2032
- Figure 51: Europe Portable Chromatography Systems Industry Revenue (Million), by Country 2024 & 2032
- Figure 52: Europe Portable Chromatography Systems Industry Volume (K Unit), by Country 2024 & 2032
- Figure 53: Europe Portable Chromatography Systems Industry Revenue Share (%), by Country 2024 & 2032
- Figure 54: Europe Portable Chromatography Systems Industry Volume Share (%), by Country 2024 & 2032
- Figure 55: Asia Pacific Portable Chromatography Systems Industry Revenue (Million), by Portability 2024 & 2032
- Figure 56: Asia Pacific Portable Chromatography Systems Industry Volume (K Unit), by Portability 2024 & 2032
- Figure 57: Asia Pacific Portable Chromatography Systems Industry Revenue Share (%), by Portability 2024 & 2032
- Figure 58: Asia Pacific Portable Chromatography Systems Industry Volume Share (%), by Portability 2024 & 2032
- Figure 59: Asia Pacific Portable Chromatography Systems Industry Revenue (Million), by Type 2024 & 2032
- Figure 60: Asia Pacific Portable Chromatography Systems Industry Volume (K Unit), by Type 2024 & 2032
- Figure 61: Asia Pacific Portable Chromatography Systems Industry Revenue Share (%), by Type 2024 & 2032
- Figure 62: Asia Pacific Portable Chromatography Systems Industry Volume Share (%), by Type 2024 & 2032
- Figure 63: Asia Pacific Portable Chromatography Systems Industry Revenue (Million), by End-User 2024 & 2032
- Figure 64: Asia Pacific Portable Chromatography Systems Industry Volume (K Unit), by End-User 2024 & 2032
- Figure 65: Asia Pacific Portable Chromatography Systems Industry Revenue Share (%), by End-User 2024 & 2032
- Figure 66: Asia Pacific Portable Chromatography Systems Industry Volume Share (%), by End-User 2024 & 2032
- Figure 67: Asia Pacific Portable Chromatography Systems Industry Revenue (Million), by Country 2024 & 2032
- Figure 68: Asia Pacific Portable Chromatography Systems Industry Volume (K Unit), by Country 2024 & 2032
- Figure 69: Asia Pacific Portable Chromatography Systems Industry Revenue Share (%), by Country 2024 & 2032
- Figure 70: Asia Pacific Portable Chromatography Systems Industry Volume Share (%), by Country 2024 & 2032
- Figure 71: Middle East and Africa Portable Chromatography Systems Industry Revenue (Million), by Portability 2024 & 2032
- Figure 72: Middle East and Africa Portable Chromatography Systems Industry Volume (K Unit), by Portability 2024 & 2032
- Figure 73: Middle East and Africa Portable Chromatography Systems Industry Revenue Share (%), by Portability 2024 & 2032
- Figure 74: Middle East and Africa Portable Chromatography Systems Industry Volume Share (%), by Portability 2024 & 2032
- Figure 75: Middle East and Africa Portable Chromatography Systems Industry Revenue (Million), by Type 2024 & 2032
- Figure 76: Middle East and Africa Portable Chromatography Systems Industry Volume (K Unit), by Type 2024 & 2032
- Figure 77: Middle East and Africa Portable Chromatography Systems Industry Revenue Share (%), by Type 2024 & 2032
- Figure 78: Middle East and Africa Portable Chromatography Systems Industry Volume Share (%), by Type 2024 & 2032
- Figure 79: Middle East and Africa Portable Chromatography Systems Industry Revenue (Million), by End-User 2024 & 2032
- Figure 80: Middle East and Africa Portable Chromatography Systems Industry Volume (K Unit), by End-User 2024 & 2032
- Figure 81: Middle East and Africa Portable Chromatography Systems Industry Revenue Share (%), by End-User 2024 & 2032
- Figure 82: Middle East and Africa Portable Chromatography Systems Industry Volume Share (%), by End-User 2024 & 2032
- Figure 83: Middle East and Africa Portable Chromatography Systems Industry Revenue (Million), by Country 2024 & 2032
- Figure 84: Middle East and Africa Portable Chromatography Systems Industry Volume (K Unit), by Country 2024 & 2032
- Figure 85: Middle East and Africa Portable Chromatography Systems Industry Revenue Share (%), by Country 2024 & 2032
- Figure 86: Middle East and Africa Portable Chromatography Systems Industry Volume Share (%), by Country 2024 & 2032
- Figure 87: South America Portable Chromatography Systems Industry Revenue (Million), by Portability 2024 & 2032
- Figure 88: South America Portable Chromatography Systems Industry Volume (K Unit), by Portability 2024 & 2032
- Figure 89: South America Portable Chromatography Systems Industry Revenue Share (%), by Portability 2024 & 2032
- Figure 90: South America Portable Chromatography Systems Industry Volume Share (%), by Portability 2024 & 2032
- Figure 91: South America Portable Chromatography Systems Industry Revenue (Million), by Type 2024 & 2032
- Figure 92: South America Portable Chromatography Systems Industry Volume (K Unit), by Type 2024 & 2032
- Figure 93: South America Portable Chromatography Systems Industry Revenue Share (%), by Type 2024 & 2032
- Figure 94: South America Portable Chromatography Systems Industry Volume Share (%), by Type 2024 & 2032
- Figure 95: South America Portable Chromatography Systems Industry Revenue (Million), by End-User 2024 & 2032
- Figure 96: South America Portable Chromatography Systems Industry Volume (K Unit), by End-User 2024 & 2032
- Figure 97: South America Portable Chromatography Systems Industry Revenue Share (%), by End-User 2024 & 2032
- Figure 98: South America Portable Chromatography Systems Industry Volume Share (%), by End-User 2024 & 2032
- Figure 99: South America Portable Chromatography Systems Industry Revenue (Million), by Country 2024 & 2032
- Figure 100: South America Portable Chromatography Systems Industry Volume (K Unit), by Country 2024 & 2032
- Figure 101: South America Portable Chromatography Systems Industry Revenue Share (%), by Country 2024 & 2032
- Figure 102: South America Portable Chromatography Systems Industry Volume Share (%), by Country 2024 & 2032
List of Tables
- Table 1: Global Portable Chromatography Systems Industry Revenue Million Forecast, by Region 2019 & 2032
- Table 2: Global Portable Chromatography Systems Industry Volume K Unit Forecast, by Region 2019 & 2032
- Table 3: Global Portable Chromatography Systems Industry Revenue Million Forecast, by Portability 2019 & 2032
- Table 4: Global Portable Chromatography Systems Industry Volume K Unit Forecast, by Portability 2019 & 2032
- Table 5: Global Portable Chromatography Systems Industry Revenue Million Forecast, by Type 2019 & 2032
- Table 6: Global Portable Chromatography Systems Industry Volume K Unit Forecast, by Type 2019 & 2032
- Table 7: Global Portable Chromatography Systems Industry Revenue Million Forecast, by End-User 2019 & 2032
- Table 8: Global Portable Chromatography Systems Industry Volume K Unit Forecast, by End-User 2019 & 2032
- Table 9: Global Portable Chromatography Systems Industry Revenue Million Forecast, by Region 2019 & 2032
- Table 10: Global Portable Chromatography Systems Industry Volume K Unit Forecast, by Region 2019 & 2032
- Table 11: Global Portable Chromatography Systems Industry Revenue Million Forecast, by Country 2019 & 2032
- Table 12: Global Portable Chromatography Systems Industry Volume K Unit Forecast, by Country 2019 & 2032
- Table 13: United States Portable Chromatography Systems Industry Revenue (Million) Forecast, by Application 2019 & 2032
- Table 14: United States Portable Chromatography Systems Industry Volume (K Unit) Forecast, by Application 2019 & 2032
- Table 15: Canada Portable Chromatography Systems Industry Revenue (Million) Forecast, by Application 2019 & 2032
- Table 16: Canada Portable Chromatography Systems Industry Volume (K Unit) Forecast, by Application 2019 & 2032
- Table 17: Mexico Portable Chromatography Systems Industry Revenue (Million) Forecast, by Application 2019 & 2032
- Table 18: Mexico Portable Chromatography Systems Industry Volume (K Unit) Forecast, by Application 2019 & 2032
- Table 19: Global Portable Chromatography Systems Industry Revenue Million Forecast, by Country 2019 & 2032
- Table 20: Global Portable Chromatography Systems Industry Volume K Unit Forecast, by Country 2019 & 2032
- Table 21: Germany Portable Chromatography Systems Industry Revenue (Million) Forecast, by Application 2019 & 2032
- Table 22: Germany Portable Chromatography Systems Industry Volume (K Unit) Forecast, by Application 2019 & 2032
- Table 23: United Kingdom Portable Chromatography Systems Industry Revenue (Million) Forecast, by Application 2019 & 2032
- Table 24: United Kingdom Portable Chromatography Systems Industry Volume (K Unit) Forecast, by Application 2019 & 2032
- Table 25: France Portable Chromatography Systems Industry Revenue (Million) Forecast, by Application 2019 & 2032
- Table 26: France Portable Chromatography Systems Industry Volume (K Unit) Forecast, by Application 2019 & 2032
- Table 27: Italy Portable Chromatography Systems Industry Revenue (Million) Forecast, by Application 2019 & 2032
- Table 28: Italy Portable Chromatography Systems Industry Volume (K Unit) Forecast, by Application 2019 & 2032
- Table 29: Spain Portable Chromatography Systems Industry Revenue (Million) Forecast, by Application 2019 & 2032
- Table 30: Spain Portable Chromatography Systems Industry Volume (K Unit) Forecast, by Application 2019 & 2032
- Table 31: Rest of Europe Portable Chromatography Systems Industry Revenue (Million) Forecast, by Application 2019 & 2032
- Table 32: Rest of Europe Portable Chromatography Systems Industry Volume (K Unit) Forecast, by Application 2019 & 2032
- Table 33: Global Portable Chromatography Systems Industry Revenue Million Forecast, by Country 2019 & 2032
- Table 34: Global Portable Chromatography Systems Industry Volume K Unit Forecast, by Country 2019 & 2032
- Table 35: China Portable Chromatography Systems Industry Revenue (Million) Forecast, by Application 2019 & 2032
- Table 36: China Portable Chromatography Systems Industry Volume (K Unit) Forecast, by Application 2019 & 2032
- Table 37: Japan Portable Chromatography Systems Industry Revenue (Million) Forecast, by Application 2019 & 2032
- Table 38: Japan Portable Chromatography Systems Industry Volume (K Unit) Forecast, by Application 2019 & 2032
- Table 39: India Portable Chromatography Systems Industry Revenue (Million) Forecast, by Application 2019 & 2032
- Table 40: India Portable Chromatography Systems Industry Volume (K Unit) Forecast, by Application 2019 & 2032
- Table 41: Australia Portable Chromatography Systems Industry Revenue (Million) Forecast, by Application 2019 & 2032
- Table 42: Australia Portable Chromatography Systems Industry Volume (K Unit) Forecast, by Application 2019 & 2032
- Table 43: South Korea Portable Chromatography Systems Industry Revenue (Million) Forecast, by Application 2019 & 2032
- Table 44: South Korea Portable Chromatography Systems Industry Volume (K Unit) Forecast, by Application 2019 & 2032
- Table 45: Rest of Asia Pacific Portable Chromatography Systems Industry Revenue (Million) Forecast, by Application 2019 & 2032
- Table 46: Rest of Asia Pacific Portable Chromatography Systems Industry Volume (K Unit) Forecast, by Application 2019 & 2032
- Table 47: Global Portable Chromatography Systems Industry Revenue Million Forecast, by Country 2019 & 2032
- Table 48: Global Portable Chromatography Systems Industry Volume K Unit Forecast, by Country 2019 & 2032
- Table 49: GCC Portable Chromatography Systems Industry Revenue (Million) Forecast, by Application 2019 & 2032
- Table 50: GCC Portable Chromatography Systems Industry Volume (K Unit) Forecast, by Application 2019 & 2032
- Table 51: South Africa Portable Chromatography Systems Industry Revenue (Million) Forecast, by Application 2019 & 2032
- Table 52: South Africa Portable Chromatography Systems Industry Volume (K Unit) Forecast, by Application 2019 & 2032
- Table 53: Rest of Middle East and Africa Portable Chromatography Systems Industry Revenue (Million) Forecast, by Application 2019 & 2032
- Table 54: Rest of Middle East and Africa Portable Chromatography Systems Industry Volume (K Unit) Forecast, by Application 2019 & 2032
- Table 55: Global Portable Chromatography Systems Industry Revenue Million Forecast, by Country 2019 & 2032
- Table 56: Global Portable Chromatography Systems Industry Volume K Unit Forecast, by Country 2019 & 2032
- Table 57: Brazil Portable Chromatography Systems Industry Revenue (Million) Forecast, by Application 2019 & 2032
- Table 58: Brazil Portable Chromatography Systems Industry Volume (K Unit) Forecast, by Application 2019 & 2032
- Table 59: Argentina Portable Chromatography Systems Industry Revenue (Million) Forecast, by Application 2019 & 2032
- Table 60: Argentina Portable Chromatography Systems Industry Volume (K Unit) Forecast, by Application 2019 & 2032
- Table 61: Rest of South America Portable Chromatography Systems Industry Revenue (Million) Forecast, by Application 2019 & 2032
- Table 62: Rest of South America Portable Chromatography Systems Industry Volume (K Unit) Forecast, by Application 2019 & 2032
- Table 63: Global Portable Chromatography Systems Industry Revenue Million Forecast, by Portability 2019 & 2032
- Table 64: Global Portable Chromatography Systems Industry Volume K Unit Forecast, by Portability 2019 & 2032
- Table 65: Global Portable Chromatography Systems Industry Revenue Million Forecast, by Type 2019 & 2032
- Table 66: Global Portable Chromatography Systems Industry Volume K Unit Forecast, by Type 2019 & 2032
- Table 67: Global Portable Chromatography Systems Industry Revenue Million Forecast, by End-User 2019 & 2032
- Table 68: Global Portable Chromatography Systems Industry Volume K Unit Forecast, by End-User 2019 & 2032
- Table 69: Global Portable Chromatography Systems Industry Revenue Million Forecast, by Country 2019 & 2032
- Table 70: Global Portable Chromatography Systems Industry Volume K Unit Forecast, by Country 2019 & 2032
- Table 71: United States Portable Chromatography Systems Industry Revenue (Million) Forecast, by Application 2019 & 2032
- Table 72: United States Portable Chromatography Systems Industry Volume (K Unit) Forecast, by Application 2019 & 2032
- Table 73: Canada Portable Chromatography Systems Industry Revenue (Million) Forecast, by Application 2019 & 2032
- Table 74: Canada Portable Chromatography Systems Industry Volume (K Unit) Forecast, by Application 2019 & 2032
- Table 75: Mexico Portable Chromatography Systems Industry Revenue (Million) Forecast, by Application 2019 & 2032
- Table 76: Mexico Portable Chromatography Systems Industry Volume (K Unit) Forecast, by Application 2019 & 2032
- Table 77: Global Portable Chromatography Systems Industry Revenue Million Forecast, by Portability 2019 & 2032
- Table 78: Global Portable Chromatography Systems Industry Volume K Unit Forecast, by Portability 2019 & 2032
- Table 79: Global Portable Chromatography Systems Industry Revenue Million Forecast, by Type 2019 & 2032
- Table 80: Global Portable Chromatography Systems Industry Volume K Unit Forecast, by Type 2019 & 2032
- Table 81: Global Portable Chromatography Systems Industry Revenue Million Forecast, by End-User 2019 & 2032
- Table 82: Global Portable Chromatography Systems Industry Volume K Unit Forecast, by End-User 2019 & 2032
- Table 83: Global Portable Chromatography Systems Industry Revenue Million Forecast, by Country 2019 & 2032
- Table 84: Global Portable Chromatography Systems Industry Volume K Unit Forecast, by Country 2019 & 2032
- Table 85: Germany Portable Chromatography Systems Industry Revenue (Million) Forecast, by Application 2019 & 2032
- Table 86: Germany Portable Chromatography Systems Industry Volume (K Unit) Forecast, by Application 2019 & 2032
- Table 87: United Kingdom Portable Chromatography Systems Industry Revenue (Million) Forecast, by Application 2019 & 2032
- Table 88: United Kingdom Portable Chromatography Systems Industry Volume (K Unit) Forecast, by Application 2019 & 2032
- Table 89: France Portable Chromatography Systems Industry Revenue (Million) Forecast, by Application 2019 & 2032
- Table 90: France Portable Chromatography Systems Industry Volume (K Unit) Forecast, by Application 2019 & 2032
- Table 91: Italy Portable Chromatography Systems Industry Revenue (Million) Forecast, by Application 2019 & 2032
- Table 92: Italy Portable Chromatography Systems Industry Volume (K Unit) Forecast, by Application 2019 & 2032
- Table 93: Spain Portable Chromatography Systems Industry Revenue (Million) Forecast, by Application 2019 & 2032
- Table 94: Spain Portable Chromatography Systems Industry Volume (K Unit) Forecast, by Application 2019 & 2032
- Table 95: Rest of Europe Portable Chromatography Systems Industry Revenue (Million) Forecast, by Application 2019 & 2032
- Table 96: Rest of Europe Portable Chromatography Systems Industry Volume (K Unit) Forecast, by Application 2019 & 2032
- Table 97: Global Portable Chromatography Systems Industry Revenue Million Forecast, by Portability 2019 & 2032
- Table 98: Global Portable Chromatography Systems Industry Volume K Unit Forecast, by Portability 2019 & 2032
- Table 99: Global Portable Chromatography Systems Industry Revenue Million Forecast, by Type 2019 & 2032
- Table 100: Global Portable Chromatography Systems Industry Volume K Unit Forecast, by Type 2019 & 2032
- Table 101: Global Portable Chromatography Systems Industry Revenue Million Forecast, by End-User 2019 & 2032
- Table 102: Global Portable Chromatography Systems Industry Volume K Unit Forecast, by End-User 2019 & 2032
- Table 103: Global Portable Chromatography Systems Industry Revenue Million Forecast, by Country 2019 & 2032
- Table 104: Global Portable Chromatography Systems Industry Volume K Unit Forecast, by Country 2019 & 2032
- Table 105: China Portable Chromatography Systems Industry Revenue (Million) Forecast, by Application 2019 & 2032
- Table 106: China Portable Chromatography Systems Industry Volume (K Unit) Forecast, by Application 2019 & 2032
- Table 107: Japan Portable Chromatography Systems Industry Revenue (Million) Forecast, by Application 2019 & 2032
- Table 108: Japan Portable Chromatography Systems Industry Volume (K Unit) Forecast, by Application 2019 & 2032
- Table 109: India Portable Chromatography Systems Industry Revenue (Million) Forecast, by Application 2019 & 2032
- Table 110: India Portable Chromatography Systems Industry Volume (K Unit) Forecast, by Application 2019 & 2032
- Table 111: Australia Portable Chromatography Systems Industry Revenue (Million) Forecast, by Application 2019 & 2032
- Table 112: Australia Portable Chromatography Systems Industry Volume (K Unit) Forecast, by Application 2019 & 2032
- Table 113: South Korea Portable Chromatography Systems Industry Revenue (Million) Forecast, by Application 2019 & 2032
- Table 114: South Korea Portable Chromatography Systems Industry Volume (K Unit) Forecast, by Application 2019 & 2032
- Table 115: Rest of Asia Pacific Portable Chromatography Systems Industry Revenue (Million) Forecast, by Application 2019 & 2032
- Table 116: Rest of Asia Pacific Portable Chromatography Systems Industry Volume (K Unit) Forecast, by Application 2019 & 2032
- Table 117: Global Portable Chromatography Systems Industry Revenue Million Forecast, by Portability 2019 & 2032
- Table 118: Global Portable Chromatography Systems Industry Volume K Unit Forecast, by Portability 2019 & 2032
- Table 119: Global Portable Chromatography Systems Industry Revenue Million Forecast, by Type 2019 & 2032
- Table 120: Global Portable Chromatography Systems Industry Volume K Unit Forecast, by Type 2019 & 2032
- Table 121: Global Portable Chromatography Systems Industry Revenue Million Forecast, by End-User 2019 & 2032
- Table 122: Global Portable Chromatography Systems Industry Volume K Unit Forecast, by End-User 2019 & 2032
- Table 123: Global Portable Chromatography Systems Industry Revenue Million Forecast, by Country 2019 & 2032
- Table 124: Global Portable Chromatography Systems Industry Volume K Unit Forecast, by Country 2019 & 2032
- Table 125: GCC Portable Chromatography Systems Industry Revenue (Million) Forecast, by Application 2019 & 2032
- Table 126: GCC Portable Chromatography Systems Industry Volume (K Unit) Forecast, by Application 2019 & 2032
- Table 127: South Africa Portable Chromatography Systems Industry Revenue (Million) Forecast, by Application 2019 & 2032
- Table 128: South Africa Portable Chromatography Systems Industry Volume (K Unit) Forecast, by Application 2019 & 2032
- Table 129: Rest of Middle East and Africa Portable Chromatography Systems Industry Revenue (Million) Forecast, by Application 2019 & 2032
- Table 130: Rest of Middle East and Africa Portable Chromatography Systems Industry Volume (K Unit) Forecast, by Application 2019 & 2032
- Table 131: Global Portable Chromatography Systems Industry Revenue Million Forecast, by Portability 2019 & 2032
- Table 132: Global Portable Chromatography Systems Industry Volume K Unit Forecast, by Portability 2019 & 2032
- Table 133: Global Portable Chromatography Systems Industry Revenue Million Forecast, by Type 2019 & 2032
- Table 134: Global Portable Chromatography Systems Industry Volume K Unit Forecast, by Type 2019 & 2032
- Table 135: Global Portable Chromatography Systems Industry Revenue Million Forecast, by End-User 2019 & 2032
- Table 136: Global Portable Chromatography Systems Industry Volume K Unit Forecast, by End-User 2019 & 2032
- Table 137: Global Portable Chromatography Systems Industry Revenue Million Forecast, by Country 2019 & 2032
- Table 138: Global Portable Chromatography Systems Industry Volume K Unit Forecast, by Country 2019 & 2032
- Table 139: Brazil Portable Chromatography Systems Industry Revenue (Million) Forecast, by Application 2019 & 2032
- Table 140: Brazil Portable Chromatography Systems Industry Volume (K Unit) Forecast, by Application 2019 & 2032
- Table 141: Argentina Portable Chromatography Systems Industry Revenue (Million) Forecast, by Application 2019 & 2032
- Table 142: Argentina Portable Chromatography Systems Industry Volume (K Unit) Forecast, by Application 2019 & 2032
- Table 143: Rest of South America Portable Chromatography Systems Industry Revenue (Million) Forecast, by Application 2019 & 2032
- Table 144: Rest of South America Portable Chromatography Systems Industry Volume (K Unit) Forecast, by Application 2019 & 2032
Frequently Asked Questions
1. What is the projected Compound Annual Growth Rate (CAGR) of the Portable Chromatography Systems Industry?
The projected CAGR is approximately 5.23%.
2. Which companies are prominent players in the Portable Chromatography Systems Industry?
Key companies in the market include Tekmeasure Technologies Pvt Ltd , Sigma Instrument Private Limited, Analytical Technologies Limited, Icon Scientific Inc, Agilent Technologies Inc, PerkinElmer Inc, INFICON, Axcend, FLIR Systems Inc.
3. What are the main segments of the Portable Chromatography Systems Industry?
The market segments include Portability, Type, End-User.
4. Can you provide details about the market size?
The market size is estimated to be USD 563.52 Million as of 2022.
5. What are some drivers contributing to market growth?
; Advancements in Device Technologies; Growing Applications of Portable Chromatography Systems.
6. What are the notable trends driving market growth?
Transportable Chromatography Systems to Grow at a Significant Rate.
7. Are there any restraints impacting market growth?
; High Cost of Portable Chromatography Techniques.
8. Can you provide examples of recent developments in the market?
N/A
9. What pricing options are available for accessing the report?
Pricing options include single-user, multi-user, and enterprise licenses priced at USD 4750, USD 5250, and USD 8750 respectively.
10. Is the market size provided in terms of value or volume?
The market size is provided in terms of value, measured in Million and volume, measured in K Unit.
11. Are there any specific market keywords associated with the report?
Yes, the market keyword associated with the report is "Portable Chromatography Systems Industry," which aids in identifying and referencing the specific market segment covered.
12. How do I determine which pricing option suits my needs best?
The pricing options vary based on user requirements and access needs. Individual users may opt for single-user licenses, while businesses requiring broader access may choose multi-user or enterprise licenses for cost-effective access to the report.
13. Are there any additional resources or data provided in the Portable Chromatography Systems Industry report?
While the report offers comprehensive insights, it's advisable to review the specific contents or supplementary materials provided to ascertain if additional resources or data are available.
14. How can I stay updated on further developments or reports in the Portable Chromatography Systems Industry?
To stay informed about further developments, trends, and reports in the Portable Chromatography Systems Industry, consider subscribing to industry newsletters, following relevant companies and organizations, or regularly checking reputable industry news sources and publications.
Methodology
Step 1 - Identification of Relevant Samples Size from Population Database


Step 2 - Approaches for Defining Global Market Size (Value, Volume* & Price*)

Note*: In applicable scenarios
Step 3 - Data Sources
Primary Research
- Web Analytics
- Survey Reports
- Research Institute
- Latest Research Reports
- Opinion Leaders
Secondary Research
- Annual Reports
- White Paper
- Latest Press Release
- Industry Association
- Paid Database
- Investor Presentations

Step 4 - Data Triangulation
Involves using different sources of information in order to increase the validity of a study
These sources are likely to be stakeholders in a program - participants, other researchers, program staff, other community members, and so on.
Then we put all data in single framework & apply various statistical tools to find out the dynamic on the market.
During the analysis stage, feedback from the stakeholder groups would be compared to determine areas of agreement as well as areas of divergence


