
Key Insights
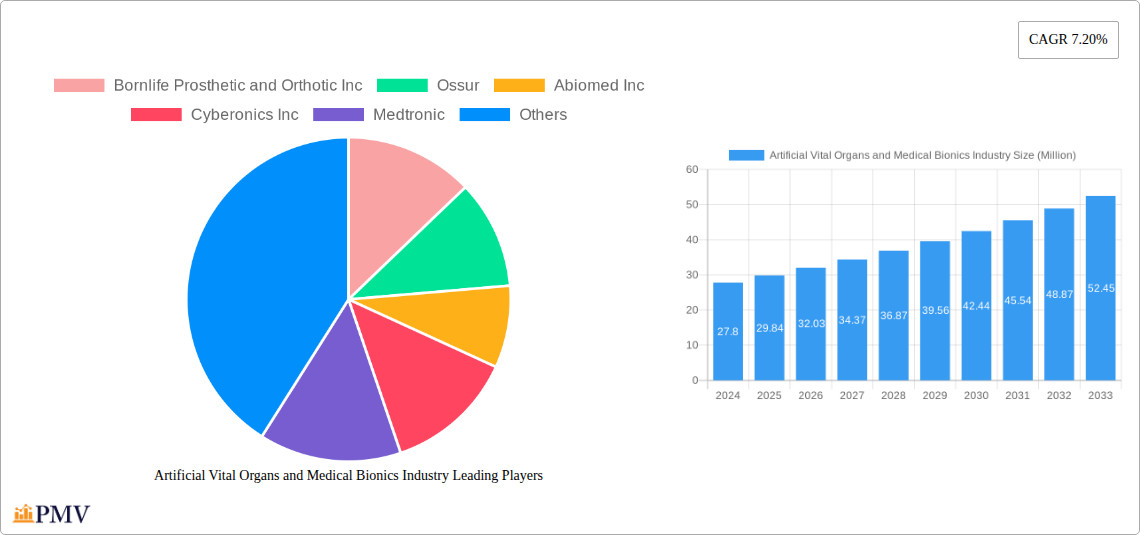
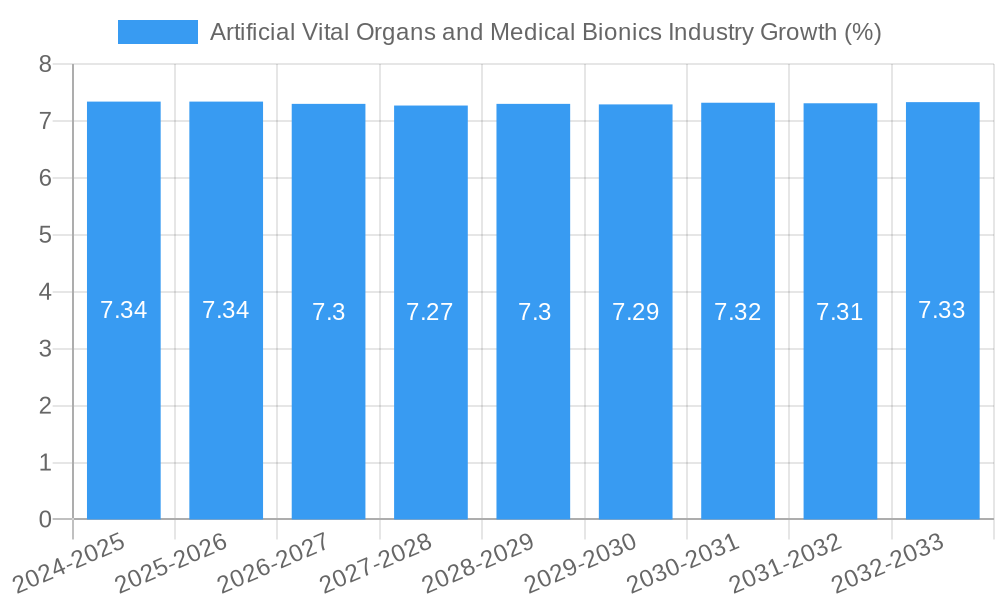
The global Artificial Vital Organs and Medical Bionics market is poised for robust expansion, currently valued at approximately $29.84 million, and is projected to grow at a Compound Annual Growth Rate (CAGR) of 7.20% through 2033. This significant growth is propelled by several key drivers. Advancements in regenerative medicine and biomaterials are enabling the development of more sophisticated and integrated artificial organs, offering life-saving solutions for organ failure patients and reducing reliance on transplantation. The increasing prevalence of chronic diseases, such as cardiovascular conditions, kidney disease, and hearing loss, is creating a sustained demand for bionic implants and artificial organ replacements. Furthermore, a growing elderly population, more susceptible to age-related organ degeneration and sensory impairments, further fuels market expansion. Favorable regulatory frameworks in developed regions, coupled with increased healthcare expenditure and growing patient awareness, are also contributing to the optimistic outlook.
The market is segmented into Artificial Vital Organs and Bionics. Within Artificial Vital Organs, artificial hearts, kidneys, and lungs are witnessing substantial development and adoption. Cochlear implants are a mature yet consistently growing segment, driven by the increasing incidence of hearing loss. The Bionics segment is broadly categorized by application, with Vision Bionics, Ear Bionics, Orthopedic Bionics, and Cardiac Bionics each presenting unique growth opportunities. Technological innovations, such as miniaturization, enhanced functionality, and improved biocompatibility, are at the forefront of market trends. However, high research and development costs, coupled with the complex regulatory approval processes for novel devices, present significant restraints. Reimbursement challenges and the need for specialized surgical expertise also pose hurdles to widespread adoption. Despite these challenges, strategic collaborations between research institutions and leading medical device manufacturers, along with a focus on reducing the cost of these advanced technologies, are expected to mitigate these restraints and pave the way for sustained market growth.
This in-depth market research report provides a definitive analysis of the global Artificial Vital Organs and Medical Bionics Industry. Covering the historical period from 2019 to 2024 and projecting growth through 2033, with a base and estimated year of 2025, this report delves into the intricate dynamics of this rapidly evolving sector. We meticulously analyze market segmentation, key growth drivers, emerging trends, competitive landscape, and product innovations. This report is an essential resource for stakeholders seeking to understand and capitalize on the burgeoning opportunities within artificial organs, medical bionics, prosthetics, orthotics, implantable devices, regenerative medicine, and biotechnology.
Artificial Vital Organs and Medical Bionics Industry Market Structure & Competitive Dynamics
The Artificial Vital Organs and Medical Bionics Industry exhibits a moderately concentrated market structure, characterized by the presence of both large, established multinational corporations and a growing number of agile, specialized startups. Innovation ecosystems are thriving, driven by significant R&D investments and collaborations between research institutions and industry players. Regulatory frameworks, while crucial for ensuring patient safety and efficacy, also present a significant hurdle for market entry and product development. The threat of product substitutes, though currently limited for vital organ replacement, is being addressed by advancements in regenerative medicine and advanced therapies. End-user trends are largely dictated by an aging global population, a rising prevalence of chronic diseases, and increasing patient demand for improved quality of life and life-saving interventions. Mergers and acquisition (M&A) activities are a key feature, with larger companies acquiring innovative startups to expand their portfolios and market reach. For instance, acquisitions in the artificial kidney and artificial heart segments aim to consolidate technological leadership. Significant M&A deal values are anticipated to further shape market concentration in the coming years, with an estimated market share shift of up to 15% annually driven by strategic consolidations.
Artificial Vital Organs and Medical Bionics Industry Industry Trends & Insights
The Artificial Vital Organs and Medical Bionics Industry is poised for exceptional growth, projected to expand at a Compound Annual Growth Rate (CAGR) of approximately 18.5% during the forecast period. This surge is fueled by several interconnected trends. Firstly, the escalating global burden of end-stage organ diseases, coupled with a persistent shortage of organ donors, is creating an unprecedented demand for artificial organs such as artificial hearts, artificial kidneys, and artificial lungs. Secondly, rapid advancements in biotechnology, nanotechnology, and robotics are enabling the development of more sophisticated, biocompatible, and functionally superior bionic devices. This includes groundbreaking innovations in vision bionics, ear bionics (like advanced cochlear implants), and orthopedic bionics that restore mobility and independence. The increasing integration of AI and machine learning in bionic devices is further enhancing their adaptability and personalized functionality. Consumer preferences are shifting towards minimally invasive procedures, faster recovery times, and devices that offer greater autonomy and improved quality of life. Competitive dynamics are intensifying, with companies fiercely vying for market share through continuous product innovation, strategic partnerships, and targeted marketing efforts. The market penetration of advanced bionic solutions, particularly in developed economies, is steadily increasing, reflecting growing awareness and accessibility. The ongoing research into bioartificial organs and personalized regenerative medicine solutions represents a significant long-term growth driver, aiming to bridge the gap between artificial replacement and natural regeneration.
Dominant Markets & Segments in Artificial Vital Organs and Medical Bionics Industry
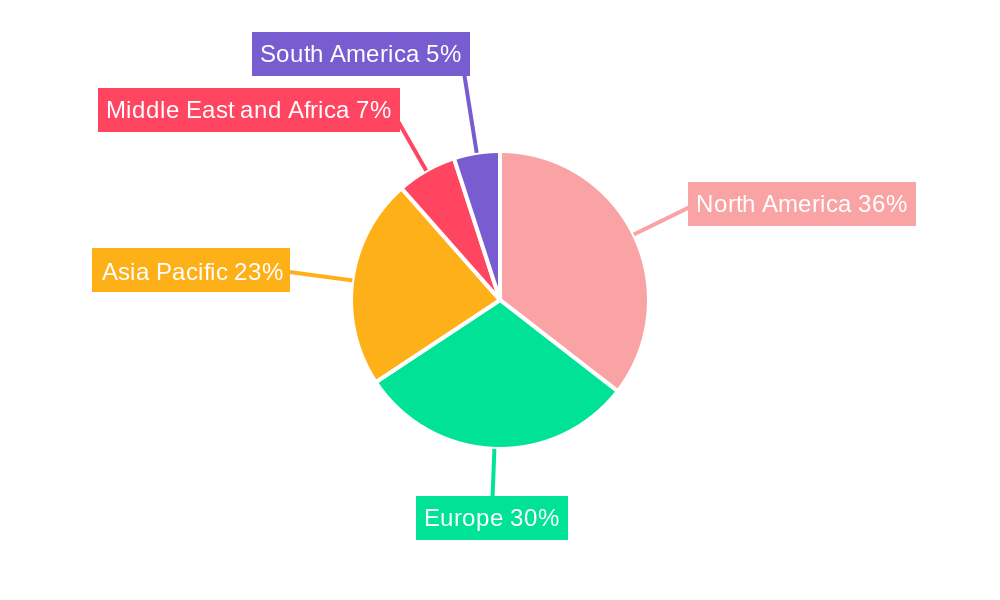
North America currently dominates the Artificial Vital Organs and Medical Bionics Industry, with the United States leading due to substantial healthcare expenditure, robust research infrastructure, and a high prevalence of chronic diseases requiring advanced medical interventions. Key economic policies supporting medical innovation and extensive healthcare reimbursement frameworks further bolster its leading position. The Artificial Organ segment, particularly Artificial Heart and Artificial Kidney technologies, holds significant market share due to the critical unmet need for organ replacement. The growing adoption of Cochlear Implants within the Ear Bionics sub-segment also contributes substantially to market dominance, driven by advancements in audiology and increased diagnosis of hearing loss.
Artificial Organs:
- Artificial Heart: Driven by increasing rates of cardiovascular diseases and a lack of donor organs. Significant investments in miniaturization and improved power sources.
- Artificial Kidney: Growing demand due to the rising incidence of kidney failure and the limitations of dialysis. Focus on developing implantable and bioartificial kidney prototypes.
- Artificial Lungs: Critical for patients with respiratory failure, with ongoing research into more efficient and less invasive extracorporeal membrane oxygenation (ECMO) technologies.
- Cochlear Implants: Experiencing consistent growth due to technological improvements leading to better hearing outcomes and wider patient eligibility.
- Other Organ Types: Including artificial pancreas and liver devices, representing emerging areas with high growth potential.
Bionics:
- Vision Bionics: Advancements in retinal implants and prosthetic eyes are offering renewed hope for individuals with visual impairments.
- Ear Bionics: Beyond cochlear implants, this segment includes advanced hearing aids and auditory brainstem implants.
- Orthopedic Bionic: Driven by the development of advanced prosthetic limbs and exoskeletons, enhancing mobility and functionality for amputees and individuals with mobility disorders.
- Cardiac Bionics: This overlaps with artificial hearts but also includes bionic pacemakers and other implantable devices that regulate heart rhythm and function.
Infrastructure development in advanced healthcare facilities and supportive government initiatives focused on medical device manufacturing and research further solidify North America's leadership. However, the Asia-Pacific region, particularly China and India, is exhibiting the fastest growth due to a rapidly expanding patient base, increasing disposable incomes, and a growing focus on healthcare modernization and indigenous technological development.
Artificial Vital Organs and Medical Bionics Industry Product Innovations
Product innovation in the Artificial Vital Organs and Medical Bionics Industry is characterized by a relentless pursuit of enhanced functionality, improved biocompatibility, and patient-centric design. Key advancements include the development of smaller, more durable artificial hearts with improved pumping efficiency and reduced power consumption. In the realm of artificial kidneys, significant strides are being made towards creating more compact and potentially implantable bioartificial kidneys that mimic native kidney function. For medical bionics, innovations are focused on creating more intuitive and responsive devices, such as AI-powered prosthetic limbs that learn and adapt to user movements and advanced cochlear implants offering superior sound processing and speech recognition. The integration of smart sensors and remote monitoring capabilities allows for real-time data collection, enabling personalized treatment adjustments and predictive maintenance. These innovations are crucial for improving patient outcomes, reducing healthcare costs, and expanding market access for life-altering technologies.
Report Segmentation & Scope
This report meticulously segments the Artificial Vital Organs and Medical Bionics Industry to provide a granular understanding of market dynamics. The primary segmentation focuses on Type, encompassing Artificial Organs and Bionics. Within Artificial Organs, we analyze sub-segments including Artificial Heart, Artificial Kidney, Artificial Lungs, Cochlear Implants, and Other Organ Types. For Bionics, the report details Vision Bionics, Ear Bionics, Orthopedic Bionic, and Cardiac Bionics. Each segment's growth projections are based on current market penetration, technological advancements, and anticipated demand. For instance, the Artificial Kidney segment is projected to experience a CAGR of over 20% due to breakthroughs in bioartificial kidney development. The Orthopedic Bionic segment is also poised for significant expansion, driven by the increasing need for advanced prosthetic solutions. The scope of this report extends to analyzing the market size, key market drivers, and competitive landscapes within each of these defined segments.
Key Drivers of Artificial Vital Organs and Medical Bionics Industry Growth
The Artificial Vital Organs and Medical Bionics Industry is experiencing robust growth driven by a confluence of factors. Firstly, the escalating global prevalence of chronic diseases, such as heart failure, kidney disease, and diabetes, directly fuels the demand for artificial organs and bionic interventions. Secondly, continuous technological advancements in areas like biotechnology, materials science, and miniaturization are leading to the development of more effective and safer medical devices. For example, breakthroughs in 3D bioprinting are paving the way for custom-made artificial organs. Thirdly, a growing aging population worldwide necessitates advanced medical solutions to manage age-related health issues, further propelling market expansion. Regulatory support in the form of faster approval pathways for innovative medical devices also plays a crucial role. Finally, increasing healthcare expenditure, both public and private, and growing patient awareness and acceptance of these advanced technologies are significant growth accelerators.
Challenges in the Artificial Vital Organs and Medical Bionics Industry Sector
Despite the promising growth trajectory, the Artificial Vital Organs and Medical Bionics Industry faces several significant challenges. High development and manufacturing costs associated with these complex technologies translate into substantial pricing, limiting accessibility for a considerable portion of the global population. Regulatory hurdles, while necessary for patient safety, can be time-consuming and costly, potentially delaying the market entry of innovative products. The need for rigorous clinical trials to demonstrate safety and efficacy adds to the financial and temporal burdens. Supply chain disruptions, particularly for specialized components and raw materials, can impact production timelines and costs. Furthermore, the inherent complexity of these devices often necessitates specialized training for healthcare professionals involved in their implantation and maintenance, creating a skilled labor gap. Competitive pressures from both established players and emerging innovators also demand constant investment in R&D and market differentiation.
Leading Players in the Artificial Vital Organs and Medical Bionics Industry Market
- Bornlife Prosthetic and Orthotic Inc
- Ossur
- Abiomed Inc
- Cyberonics Inc
- Medtronic
- Baxter
- Asahi Kasei Medical Co Ltd
- Getinge AB
- Ekso Bionics Holdings Inc
- Boston Scientific Corporation
- Sonova
- Berlin Heart GmbH
Key Developments in Artificial Vital Organs and Medical Bionics Industry Sector
- August 2022: The American Society of Nephrology and the United States Department of Health and Human Services launched a USD 10.5 million prize competition from the Kidney Innovation Accelerator, focusing on Phase 2 of the Artificial Kidney Prize. This initiative actively seeks innovative suggestions for creating prototype bioartificial kidneys and novel equipment or parts essential for their realization, significantly boosting R&D in artificial kidney technology.
- January 2022: IIT-Kanpur initiated a crucial project to develop an advanced artificial heart, in collaboration with several Indian hospitals. This ambitious program is guided by a team of experienced innovators and supported by a task force comprising industry experts, marking a significant step forward in artificial heart research and development within India.
Strategic Artificial Vital Organs and Medical Bionics Industry Market Outlook
The strategic outlook for the Artificial Vital Organs and Medical Bionics Industry is exceptionally positive, characterized by sustained innovation and expanding market opportunities. The increasing global demand for advanced medical solutions, driven by demographic shifts and rising disease burdens, provides a robust foundation for future growth. Key strategic opportunities lie in the development of more sophisticated and personalized bionic devices, particularly in areas like orthopedic bionics and vision bionics, that offer greater autonomy and improved quality of life. Furthermore, significant potential exists in advancing regenerative medicine and bioartificial organ technologies, aiming to create organs that can integrate seamlessly with the human body. Strategic collaborations between research institutions, technology providers, and healthcare organizations will be crucial for accelerating the development and adoption of these groundbreaking solutions. Investments in emerging markets, alongside continued R&D in established regions, will drive global market expansion and solidify the industry's role in transforming healthcare.
Artificial Vital Organs and Medical Bionics Industry Segmentation
-
1. Type
-
1.1. Artificial Organ
- 1.1.1. Artificial Heart
- 1.1.2. Artificial Kidney
- 1.1.3. Artificial Lungs
- 1.1.4. Cochlear Implants
- 1.1.5. Other Organ Types
-
1.2. Bionics
- 1.2.1. Vision Bionics
- 1.2.2. Ear Bionics
- 1.2.3. Orthopedic Bionic
- 1.2.4. Cardiac Bionics
-
1.1. Artificial Organ
Artificial Vital Organs and Medical Bionics Industry Segmentation By Geography
-
1. North America
- 1.1. United States
- 1.2. Canada
- 1.3. Mexico
-
2. Europe
- 2.1. Germany
- 2.2. United Kingdom
- 2.3. France
- 2.4. Italy
- 2.5. Spain
- 2.6. Rest of Europe
-
3. Asia Pacific
- 3.1. China
- 3.2. Japan
- 3.3. India
- 3.4. Australia
- 3.5. South Korea
- 3.6. Rest of Asia Pacific
-
4. Middle East and Africa
- 4.1. GCC
- 4.2. South Africa
- 4.3. Rest of Middle East and Africa
-
5. South America
- 5.1. Brazil
- 5.2. Argentina
- 5.3. Rest of South America
Artificial Vital Organs and Medical Bionics Industry REPORT HIGHLIGHTS
| Aspects | Details |
|---|---|
| Study Period | 2019-2033 |
| Base Year | 2024 |
| Estimated Year | 2025 |
| Forecast Period | 2025-2033 |
| Historical Period | 2019-2024 |
| Growth Rate | CAGR of 7.20% from 2019-2033 |
| Segmentation |
|
Table of Contents
- 1. Introduction
- 1.1. Research Scope
- 1.2. Market Segmentation
- 1.3. Research Methodology
- 1.4. Definitions and Assumptions
- 2. Executive Summary
- 2.1. Introduction
- 3. Market Dynamics
- 3.1. Introduction
- 3.2. Market Drivers
- 3.2.1. Increased Incidence of Disabilities and Organ Failures; High Incidence of Road Accidents Leading to Amputations; Scarcity of Donor Organs; Technological Advancements in the Artificial Organ and Bionics
- 3.3. Market Restrains
- 3.3.1. Expensive Procedures; Compatibility Issues and Malfunctions
- 3.4. Market Trends
- 3.4.1. Artificial Kidney by Artificial Organ Segment is anticipated to Grow Over the Forecast Period
- 4. Market Factor Analysis
- 4.1. Porters Five Forces
- 4.2. Supply/Value Chain
- 4.3. PESTEL analysis
- 4.4. Market Entropy
- 4.5. Patent/Trademark Analysis
- 5. Global Artificial Vital Organs and Medical Bionics Industry Analysis, Insights and Forecast, 2019-2031
- 5.1. Market Analysis, Insights and Forecast - by Type
- 5.1.1. Artificial Organ
- 5.1.1.1. Artificial Heart
- 5.1.1.2. Artificial Kidney
- 5.1.1.3. Artificial Lungs
- 5.1.1.4. Cochlear Implants
- 5.1.1.5. Other Organ Types
- 5.1.2. Bionics
- 5.1.2.1. Vision Bionics
- 5.1.2.2. Ear Bionics
- 5.1.2.3. Orthopedic Bionic
- 5.1.2.4. Cardiac Bionics
- 5.1.1. Artificial Organ
- 5.2. Market Analysis, Insights and Forecast - by Region
- 5.2.1. North America
- 5.2.2. Europe
- 5.2.3. Asia Pacific
- 5.2.4. Middle East and Africa
- 5.2.5. South America
- 5.1. Market Analysis, Insights and Forecast - by Type
- 6. North America Artificial Vital Organs and Medical Bionics Industry Analysis, Insights and Forecast, 2019-2031
- 6.1. Market Analysis, Insights and Forecast - by Type
- 6.1.1. Artificial Organ
- 6.1.1.1. Artificial Heart
- 6.1.1.2. Artificial Kidney
- 6.1.1.3. Artificial Lungs
- 6.1.1.4. Cochlear Implants
- 6.1.1.5. Other Organ Types
- 6.1.2. Bionics
- 6.1.2.1. Vision Bionics
- 6.1.2.2. Ear Bionics
- 6.1.2.3. Orthopedic Bionic
- 6.1.2.4. Cardiac Bionics
- 6.1.1. Artificial Organ
- 6.1. Market Analysis, Insights and Forecast - by Type
- 7. Europe Artificial Vital Organs and Medical Bionics Industry Analysis, Insights and Forecast, 2019-2031
- 7.1. Market Analysis, Insights and Forecast - by Type
- 7.1.1. Artificial Organ
- 7.1.1.1. Artificial Heart
- 7.1.1.2. Artificial Kidney
- 7.1.1.3. Artificial Lungs
- 7.1.1.4. Cochlear Implants
- 7.1.1.5. Other Organ Types
- 7.1.2. Bionics
- 7.1.2.1. Vision Bionics
- 7.1.2.2. Ear Bionics
- 7.1.2.3. Orthopedic Bionic
- 7.1.2.4. Cardiac Bionics
- 7.1.1. Artificial Organ
- 7.1. Market Analysis, Insights and Forecast - by Type
- 8. Asia Pacific Artificial Vital Organs and Medical Bionics Industry Analysis, Insights and Forecast, 2019-2031
- 8.1. Market Analysis, Insights and Forecast - by Type
- 8.1.1. Artificial Organ
- 8.1.1.1. Artificial Heart
- 8.1.1.2. Artificial Kidney
- 8.1.1.3. Artificial Lungs
- 8.1.1.4. Cochlear Implants
- 8.1.1.5. Other Organ Types
- 8.1.2. Bionics
- 8.1.2.1. Vision Bionics
- 8.1.2.2. Ear Bionics
- 8.1.2.3. Orthopedic Bionic
- 8.1.2.4. Cardiac Bionics
- 8.1.1. Artificial Organ
- 8.1. Market Analysis, Insights and Forecast - by Type
- 9. Middle East and Africa Artificial Vital Organs and Medical Bionics Industry Analysis, Insights and Forecast, 2019-2031
- 9.1. Market Analysis, Insights and Forecast - by Type
- 9.1.1. Artificial Organ
- 9.1.1.1. Artificial Heart
- 9.1.1.2. Artificial Kidney
- 9.1.1.3. Artificial Lungs
- 9.1.1.4. Cochlear Implants
- 9.1.1.5. Other Organ Types
- 9.1.2. Bionics
- 9.1.2.1. Vision Bionics
- 9.1.2.2. Ear Bionics
- 9.1.2.3. Orthopedic Bionic
- 9.1.2.4. Cardiac Bionics
- 9.1.1. Artificial Organ
- 9.1. Market Analysis, Insights and Forecast - by Type
- 10. South America Artificial Vital Organs and Medical Bionics Industry Analysis, Insights and Forecast, 2019-2031
- 10.1. Market Analysis, Insights and Forecast - by Type
- 10.1.1. Artificial Organ
- 10.1.1.1. Artificial Heart
- 10.1.1.2. Artificial Kidney
- 10.1.1.3. Artificial Lungs
- 10.1.1.4. Cochlear Implants
- 10.1.1.5. Other Organ Types
- 10.1.2. Bionics
- 10.1.2.1. Vision Bionics
- 10.1.2.2. Ear Bionics
- 10.1.2.3. Orthopedic Bionic
- 10.1.2.4. Cardiac Bionics
- 10.1.1. Artificial Organ
- 10.1. Market Analysis, Insights and Forecast - by Type
- 11. North America Artificial Vital Organs and Medical Bionics Industry Analysis, Insights and Forecast, 2019-2031
- 11.1. Market Analysis, Insights and Forecast - By Country/Sub-region
- 11.1.1 United States
- 11.1.2 Canada
- 11.1.3 Mexico
- 12. Europe Artificial Vital Organs and Medical Bionics Industry Analysis, Insights and Forecast, 2019-2031
- 12.1. Market Analysis, Insights and Forecast - By Country/Sub-region
- 12.1.1 Germany
- 12.1.2 United Kingdom
- 12.1.3 France
- 12.1.4 Italy
- 12.1.5 Spain
- 12.1.6 Rest of Europe
- 13. Asia Pacific Artificial Vital Organs and Medical Bionics Industry Analysis, Insights and Forecast, 2019-2031
- 13.1. Market Analysis, Insights and Forecast - By Country/Sub-region
- 13.1.1 China
- 13.1.2 Japan
- 13.1.3 India
- 13.1.4 Australia
- 13.1.5 South Korea
- 13.1.6 Rest of Asia Pacific
- 14. Middle East and Africa Artificial Vital Organs and Medical Bionics Industry Analysis, Insights and Forecast, 2019-2031
- 14.1. Market Analysis, Insights and Forecast - By Country/Sub-region
- 14.1.1 GCC
- 14.1.2 South Africa
- 14.1.3 Rest of Middle East and Africa
- 15. South America Artificial Vital Organs and Medical Bionics Industry Analysis, Insights and Forecast, 2019-2031
- 15.1. Market Analysis, Insights and Forecast - By Country/Sub-region
- 15.1.1 Brazil
- 15.1.2 Argentina
- 15.1.3 Rest of South America
- 16. Competitive Analysis
- 16.1. Global Market Share Analysis 2024
- 16.2. Company Profiles
- 16.2.1 Bornlife Prosthetic and Orthotic Inc
- 16.2.1.1. Overview
- 16.2.1.2. Products
- 16.2.1.3. SWOT Analysis
- 16.2.1.4. Recent Developments
- 16.2.1.5. Financials (Based on Availability)
- 16.2.2 Ossur
- 16.2.2.1. Overview
- 16.2.2.2. Products
- 16.2.2.3. SWOT Analysis
- 16.2.2.4. Recent Developments
- 16.2.2.5. Financials (Based on Availability)
- 16.2.3 Abiomed Inc
- 16.2.3.1. Overview
- 16.2.3.2. Products
- 16.2.3.3. SWOT Analysis
- 16.2.3.4. Recent Developments
- 16.2.3.5. Financials (Based on Availability)
- 16.2.4 Cyberonics Inc
- 16.2.4.1. Overview
- 16.2.4.2. Products
- 16.2.4.3. SWOT Analysis
- 16.2.4.4. Recent Developments
- 16.2.4.5. Financials (Based on Availability)
- 16.2.5 Medtronic
- 16.2.5.1. Overview
- 16.2.5.2. Products
- 16.2.5.3. SWOT Analysis
- 16.2.5.4. Recent Developments
- 16.2.5.5. Financials (Based on Availability)
- 16.2.6 Baxter
- 16.2.6.1. Overview
- 16.2.6.2. Products
- 16.2.6.3. SWOT Analysis
- 16.2.6.4. Recent Developments
- 16.2.6.5. Financials (Based on Availability)
- 16.2.7 Asahi Kasei Medical Co Ltd
- 16.2.7.1. Overview
- 16.2.7.2. Products
- 16.2.7.3. SWOT Analysis
- 16.2.7.4. Recent Developments
- 16.2.7.5. Financials (Based on Availability)
- 16.2.8 Getinge AB
- 16.2.8.1. Overview
- 16.2.8.2. Products
- 16.2.8.3. SWOT Analysis
- 16.2.8.4. Recent Developments
- 16.2.8.5. Financials (Based on Availability)
- 16.2.9 Ekso Bionics Holdings Inc
- 16.2.9.1. Overview
- 16.2.9.2. Products
- 16.2.9.3. SWOT Analysis
- 16.2.9.4. Recent Developments
- 16.2.9.5. Financials (Based on Availability)
- 16.2.10 Boston Scientific Corporation
- 16.2.10.1. Overview
- 16.2.10.2. Products
- 16.2.10.3. SWOT Analysis
- 16.2.10.4. Recent Developments
- 16.2.10.5. Financials (Based on Availability)
- 16.2.11 Sonova*List Not Exhaustive
- 16.2.11.1. Overview
- 16.2.11.2. Products
- 16.2.11.3. SWOT Analysis
- 16.2.11.4. Recent Developments
- 16.2.11.5. Financials (Based on Availability)
- 16.2.12 Berlin Heart GmbH
- 16.2.12.1. Overview
- 16.2.12.2. Products
- 16.2.12.3. SWOT Analysis
- 16.2.12.4. Recent Developments
- 16.2.12.5. Financials (Based on Availability)
- 16.2.1 Bornlife Prosthetic and Orthotic Inc
List of Figures
- Figure 1: Global Artificial Vital Organs and Medical Bionics Industry Revenue Breakdown (Million, %) by Region 2024 & 2032
- Figure 2: Global Artificial Vital Organs and Medical Bionics Industry Volume Breakdown (Piece, %) by Region 2024 & 2032
- Figure 3: North America Artificial Vital Organs and Medical Bionics Industry Revenue (Million), by Country 2024 & 2032
- Figure 4: North America Artificial Vital Organs and Medical Bionics Industry Volume (Piece), by Country 2024 & 2032
- Figure 5: North America Artificial Vital Organs and Medical Bionics Industry Revenue Share (%), by Country 2024 & 2032
- Figure 6: North America Artificial Vital Organs and Medical Bionics Industry Volume Share (%), by Country 2024 & 2032
- Figure 7: Europe Artificial Vital Organs and Medical Bionics Industry Revenue (Million), by Country 2024 & 2032
- Figure 8: Europe Artificial Vital Organs and Medical Bionics Industry Volume (Piece), by Country 2024 & 2032
- Figure 9: Europe Artificial Vital Organs and Medical Bionics Industry Revenue Share (%), by Country 2024 & 2032
- Figure 10: Europe Artificial Vital Organs and Medical Bionics Industry Volume Share (%), by Country 2024 & 2032
- Figure 11: Asia Pacific Artificial Vital Organs and Medical Bionics Industry Revenue (Million), by Country 2024 & 2032
- Figure 12: Asia Pacific Artificial Vital Organs and Medical Bionics Industry Volume (Piece), by Country 2024 & 2032
- Figure 13: Asia Pacific Artificial Vital Organs and Medical Bionics Industry Revenue Share (%), by Country 2024 & 2032
- Figure 14: Asia Pacific Artificial Vital Organs and Medical Bionics Industry Volume Share (%), by Country 2024 & 2032
- Figure 15: Middle East and Africa Artificial Vital Organs and Medical Bionics Industry Revenue (Million), by Country 2024 & 2032
- Figure 16: Middle East and Africa Artificial Vital Organs and Medical Bionics Industry Volume (Piece), by Country 2024 & 2032
- Figure 17: Middle East and Africa Artificial Vital Organs and Medical Bionics Industry Revenue Share (%), by Country 2024 & 2032
- Figure 18: Middle East and Africa Artificial Vital Organs and Medical Bionics Industry Volume Share (%), by Country 2024 & 2032
- Figure 19: South America Artificial Vital Organs and Medical Bionics Industry Revenue (Million), by Country 2024 & 2032
- Figure 20: South America Artificial Vital Organs and Medical Bionics Industry Volume (Piece), by Country 2024 & 2032
- Figure 21: South America Artificial Vital Organs and Medical Bionics Industry Revenue Share (%), by Country 2024 & 2032
- Figure 22: South America Artificial Vital Organs and Medical Bionics Industry Volume Share (%), by Country 2024 & 2032
- Figure 23: North America Artificial Vital Organs and Medical Bionics Industry Revenue (Million), by Type 2024 & 2032
- Figure 24: North America Artificial Vital Organs and Medical Bionics Industry Volume (Piece), by Type 2024 & 2032
- Figure 25: North America Artificial Vital Organs and Medical Bionics Industry Revenue Share (%), by Type 2024 & 2032
- Figure 26: North America Artificial Vital Organs and Medical Bionics Industry Volume Share (%), by Type 2024 & 2032
- Figure 27: North America Artificial Vital Organs and Medical Bionics Industry Revenue (Million), by Country 2024 & 2032
- Figure 28: North America Artificial Vital Organs and Medical Bionics Industry Volume (Piece), by Country 2024 & 2032
- Figure 29: North America Artificial Vital Organs and Medical Bionics Industry Revenue Share (%), by Country 2024 & 2032
- Figure 30: North America Artificial Vital Organs and Medical Bionics Industry Volume Share (%), by Country 2024 & 2032
- Figure 31: Europe Artificial Vital Organs and Medical Bionics Industry Revenue (Million), by Type 2024 & 2032
- Figure 32: Europe Artificial Vital Organs and Medical Bionics Industry Volume (Piece), by Type 2024 & 2032
- Figure 33: Europe Artificial Vital Organs and Medical Bionics Industry Revenue Share (%), by Type 2024 & 2032
- Figure 34: Europe Artificial Vital Organs and Medical Bionics Industry Volume Share (%), by Type 2024 & 2032
- Figure 35: Europe Artificial Vital Organs and Medical Bionics Industry Revenue (Million), by Country 2024 & 2032
- Figure 36: Europe Artificial Vital Organs and Medical Bionics Industry Volume (Piece), by Country 2024 & 2032
- Figure 37: Europe Artificial Vital Organs and Medical Bionics Industry Revenue Share (%), by Country 2024 & 2032
- Figure 38: Europe Artificial Vital Organs and Medical Bionics Industry Volume Share (%), by Country 2024 & 2032
- Figure 39: Asia Pacific Artificial Vital Organs and Medical Bionics Industry Revenue (Million), by Type 2024 & 2032
- Figure 40: Asia Pacific Artificial Vital Organs and Medical Bionics Industry Volume (Piece), by Type 2024 & 2032
- Figure 41: Asia Pacific Artificial Vital Organs and Medical Bionics Industry Revenue Share (%), by Type 2024 & 2032
- Figure 42: Asia Pacific Artificial Vital Organs and Medical Bionics Industry Volume Share (%), by Type 2024 & 2032
- Figure 43: Asia Pacific Artificial Vital Organs and Medical Bionics Industry Revenue (Million), by Country 2024 & 2032
- Figure 44: Asia Pacific Artificial Vital Organs and Medical Bionics Industry Volume (Piece), by Country 2024 & 2032
- Figure 45: Asia Pacific Artificial Vital Organs and Medical Bionics Industry Revenue Share (%), by Country 2024 & 2032
- Figure 46: Asia Pacific Artificial Vital Organs and Medical Bionics Industry Volume Share (%), by Country 2024 & 2032
- Figure 47: Middle East and Africa Artificial Vital Organs and Medical Bionics Industry Revenue (Million), by Type 2024 & 2032
- Figure 48: Middle East and Africa Artificial Vital Organs and Medical Bionics Industry Volume (Piece), by Type 2024 & 2032
- Figure 49: Middle East and Africa Artificial Vital Organs and Medical Bionics Industry Revenue Share (%), by Type 2024 & 2032
- Figure 50: Middle East and Africa Artificial Vital Organs and Medical Bionics Industry Volume Share (%), by Type 2024 & 2032
- Figure 51: Middle East and Africa Artificial Vital Organs and Medical Bionics Industry Revenue (Million), by Country 2024 & 2032
- Figure 52: Middle East and Africa Artificial Vital Organs and Medical Bionics Industry Volume (Piece), by Country 2024 & 2032
- Figure 53: Middle East and Africa Artificial Vital Organs and Medical Bionics Industry Revenue Share (%), by Country 2024 & 2032
- Figure 54: Middle East and Africa Artificial Vital Organs and Medical Bionics Industry Volume Share (%), by Country 2024 & 2032
- Figure 55: South America Artificial Vital Organs and Medical Bionics Industry Revenue (Million), by Type 2024 & 2032
- Figure 56: South America Artificial Vital Organs and Medical Bionics Industry Volume (Piece), by Type 2024 & 2032
- Figure 57: South America Artificial Vital Organs and Medical Bionics Industry Revenue Share (%), by Type 2024 & 2032
- Figure 58: South America Artificial Vital Organs and Medical Bionics Industry Volume Share (%), by Type 2024 & 2032
- Figure 59: South America Artificial Vital Organs and Medical Bionics Industry Revenue (Million), by Country 2024 & 2032
- Figure 60: South America Artificial Vital Organs and Medical Bionics Industry Volume (Piece), by Country 2024 & 2032
- Figure 61: South America Artificial Vital Organs and Medical Bionics Industry Revenue Share (%), by Country 2024 & 2032
- Figure 62: South America Artificial Vital Organs and Medical Bionics Industry Volume Share (%), by Country 2024 & 2032
List of Tables
- Table 1: Global Artificial Vital Organs and Medical Bionics Industry Revenue Million Forecast, by Region 2019 & 2032
- Table 2: Global Artificial Vital Organs and Medical Bionics Industry Volume Piece Forecast, by Region 2019 & 2032
- Table 3: Global Artificial Vital Organs and Medical Bionics Industry Revenue Million Forecast, by Type 2019 & 2032
- Table 4: Global Artificial Vital Organs and Medical Bionics Industry Volume Piece Forecast, by Type 2019 & 2032
- Table 5: Global Artificial Vital Organs and Medical Bionics Industry Revenue Million Forecast, by Region 2019 & 2032
- Table 6: Global Artificial Vital Organs and Medical Bionics Industry Volume Piece Forecast, by Region 2019 & 2032
- Table 7: Global Artificial Vital Organs and Medical Bionics Industry Revenue Million Forecast, by Country 2019 & 2032
- Table 8: Global Artificial Vital Organs and Medical Bionics Industry Volume Piece Forecast, by Country 2019 & 2032
- Table 9: United States Artificial Vital Organs and Medical Bionics Industry Revenue (Million) Forecast, by Application 2019 & 2032
- Table 10: United States Artificial Vital Organs and Medical Bionics Industry Volume (Piece) Forecast, by Application 2019 & 2032
- Table 11: Canada Artificial Vital Organs and Medical Bionics Industry Revenue (Million) Forecast, by Application 2019 & 2032
- Table 12: Canada Artificial Vital Organs and Medical Bionics Industry Volume (Piece) Forecast, by Application 2019 & 2032
- Table 13: Mexico Artificial Vital Organs and Medical Bionics Industry Revenue (Million) Forecast, by Application 2019 & 2032
- Table 14: Mexico Artificial Vital Organs and Medical Bionics Industry Volume (Piece) Forecast, by Application 2019 & 2032
- Table 15: Global Artificial Vital Organs and Medical Bionics Industry Revenue Million Forecast, by Country 2019 & 2032
- Table 16: Global Artificial Vital Organs and Medical Bionics Industry Volume Piece Forecast, by Country 2019 & 2032
- Table 17: Germany Artificial Vital Organs and Medical Bionics Industry Revenue (Million) Forecast, by Application 2019 & 2032
- Table 18: Germany Artificial Vital Organs and Medical Bionics Industry Volume (Piece) Forecast, by Application 2019 & 2032
- Table 19: United Kingdom Artificial Vital Organs and Medical Bionics Industry Revenue (Million) Forecast, by Application 2019 & 2032
- Table 20: United Kingdom Artificial Vital Organs and Medical Bionics Industry Volume (Piece) Forecast, by Application 2019 & 2032
- Table 21: France Artificial Vital Organs and Medical Bionics Industry Revenue (Million) Forecast, by Application 2019 & 2032
- Table 22: France Artificial Vital Organs and Medical Bionics Industry Volume (Piece) Forecast, by Application 2019 & 2032
- Table 23: Italy Artificial Vital Organs and Medical Bionics Industry Revenue (Million) Forecast, by Application 2019 & 2032
- Table 24: Italy Artificial Vital Organs and Medical Bionics Industry Volume (Piece) Forecast, by Application 2019 & 2032
- Table 25: Spain Artificial Vital Organs and Medical Bionics Industry Revenue (Million) Forecast, by Application 2019 & 2032
- Table 26: Spain Artificial Vital Organs and Medical Bionics Industry Volume (Piece) Forecast, by Application 2019 & 2032
- Table 27: Rest of Europe Artificial Vital Organs and Medical Bionics Industry Revenue (Million) Forecast, by Application 2019 & 2032
- Table 28: Rest of Europe Artificial Vital Organs and Medical Bionics Industry Volume (Piece) Forecast, by Application 2019 & 2032
- Table 29: Global Artificial Vital Organs and Medical Bionics Industry Revenue Million Forecast, by Country 2019 & 2032
- Table 30: Global Artificial Vital Organs and Medical Bionics Industry Volume Piece Forecast, by Country 2019 & 2032
- Table 31: China Artificial Vital Organs and Medical Bionics Industry Revenue (Million) Forecast, by Application 2019 & 2032
- Table 32: China Artificial Vital Organs and Medical Bionics Industry Volume (Piece) Forecast, by Application 2019 & 2032
- Table 33: Japan Artificial Vital Organs and Medical Bionics Industry Revenue (Million) Forecast, by Application 2019 & 2032
- Table 34: Japan Artificial Vital Organs and Medical Bionics Industry Volume (Piece) Forecast, by Application 2019 & 2032
- Table 35: India Artificial Vital Organs and Medical Bionics Industry Revenue (Million) Forecast, by Application 2019 & 2032
- Table 36: India Artificial Vital Organs and Medical Bionics Industry Volume (Piece) Forecast, by Application 2019 & 2032
- Table 37: Australia Artificial Vital Organs and Medical Bionics Industry Revenue (Million) Forecast, by Application 2019 & 2032
- Table 38: Australia Artificial Vital Organs and Medical Bionics Industry Volume (Piece) Forecast, by Application 2019 & 2032
- Table 39: South Korea Artificial Vital Organs and Medical Bionics Industry Revenue (Million) Forecast, by Application 2019 & 2032
- Table 40: South Korea Artificial Vital Organs and Medical Bionics Industry Volume (Piece) Forecast, by Application 2019 & 2032
- Table 41: Rest of Asia Pacific Artificial Vital Organs and Medical Bionics Industry Revenue (Million) Forecast, by Application 2019 & 2032
- Table 42: Rest of Asia Pacific Artificial Vital Organs and Medical Bionics Industry Volume (Piece) Forecast, by Application 2019 & 2032
- Table 43: Global Artificial Vital Organs and Medical Bionics Industry Revenue Million Forecast, by Country 2019 & 2032
- Table 44: Global Artificial Vital Organs and Medical Bionics Industry Volume Piece Forecast, by Country 2019 & 2032
- Table 45: GCC Artificial Vital Organs and Medical Bionics Industry Revenue (Million) Forecast, by Application 2019 & 2032
- Table 46: GCC Artificial Vital Organs and Medical Bionics Industry Volume (Piece) Forecast, by Application 2019 & 2032
- Table 47: South Africa Artificial Vital Organs and Medical Bionics Industry Revenue (Million) Forecast, by Application 2019 & 2032
- Table 48: South Africa Artificial Vital Organs and Medical Bionics Industry Volume (Piece) Forecast, by Application 2019 & 2032
- Table 49: Rest of Middle East and Africa Artificial Vital Organs and Medical Bionics Industry Revenue (Million) Forecast, by Application 2019 & 2032
- Table 50: Rest of Middle East and Africa Artificial Vital Organs and Medical Bionics Industry Volume (Piece) Forecast, by Application 2019 & 2032
- Table 51: Global Artificial Vital Organs and Medical Bionics Industry Revenue Million Forecast, by Country 2019 & 2032
- Table 52: Global Artificial Vital Organs and Medical Bionics Industry Volume Piece Forecast, by Country 2019 & 2032
- Table 53: Brazil Artificial Vital Organs and Medical Bionics Industry Revenue (Million) Forecast, by Application 2019 & 2032
- Table 54: Brazil Artificial Vital Organs and Medical Bionics Industry Volume (Piece) Forecast, by Application 2019 & 2032
- Table 55: Argentina Artificial Vital Organs and Medical Bionics Industry Revenue (Million) Forecast, by Application 2019 & 2032
- Table 56: Argentina Artificial Vital Organs and Medical Bionics Industry Volume (Piece) Forecast, by Application 2019 & 2032
- Table 57: Rest of South America Artificial Vital Organs and Medical Bionics Industry Revenue (Million) Forecast, by Application 2019 & 2032
- Table 58: Rest of South America Artificial Vital Organs and Medical Bionics Industry Volume (Piece) Forecast, by Application 2019 & 2032
- Table 59: Global Artificial Vital Organs and Medical Bionics Industry Revenue Million Forecast, by Type 2019 & 2032
- Table 60: Global Artificial Vital Organs and Medical Bionics Industry Volume Piece Forecast, by Type 2019 & 2032
- Table 61: Global Artificial Vital Organs and Medical Bionics Industry Revenue Million Forecast, by Country 2019 & 2032
- Table 62: Global Artificial Vital Organs and Medical Bionics Industry Volume Piece Forecast, by Country 2019 & 2032
- Table 63: United States Artificial Vital Organs and Medical Bionics Industry Revenue (Million) Forecast, by Application 2019 & 2032
- Table 64: United States Artificial Vital Organs and Medical Bionics Industry Volume (Piece) Forecast, by Application 2019 & 2032
- Table 65: Canada Artificial Vital Organs and Medical Bionics Industry Revenue (Million) Forecast, by Application 2019 & 2032
- Table 66: Canada Artificial Vital Organs and Medical Bionics Industry Volume (Piece) Forecast, by Application 2019 & 2032
- Table 67: Mexico Artificial Vital Organs and Medical Bionics Industry Revenue (Million) Forecast, by Application 2019 & 2032
- Table 68: Mexico Artificial Vital Organs and Medical Bionics Industry Volume (Piece) Forecast, by Application 2019 & 2032
- Table 69: Global Artificial Vital Organs and Medical Bionics Industry Revenue Million Forecast, by Type 2019 & 2032
- Table 70: Global Artificial Vital Organs and Medical Bionics Industry Volume Piece Forecast, by Type 2019 & 2032
- Table 71: Global Artificial Vital Organs and Medical Bionics Industry Revenue Million Forecast, by Country 2019 & 2032
- Table 72: Global Artificial Vital Organs and Medical Bionics Industry Volume Piece Forecast, by Country 2019 & 2032
- Table 73: Germany Artificial Vital Organs and Medical Bionics Industry Revenue (Million) Forecast, by Application 2019 & 2032
- Table 74: Germany Artificial Vital Organs and Medical Bionics Industry Volume (Piece) Forecast, by Application 2019 & 2032
- Table 75: United Kingdom Artificial Vital Organs and Medical Bionics Industry Revenue (Million) Forecast, by Application 2019 & 2032
- Table 76: United Kingdom Artificial Vital Organs and Medical Bionics Industry Volume (Piece) Forecast, by Application 2019 & 2032
- Table 77: France Artificial Vital Organs and Medical Bionics Industry Revenue (Million) Forecast, by Application 2019 & 2032
- Table 78: France Artificial Vital Organs and Medical Bionics Industry Volume (Piece) Forecast, by Application 2019 & 2032
- Table 79: Italy Artificial Vital Organs and Medical Bionics Industry Revenue (Million) Forecast, by Application 2019 & 2032
- Table 80: Italy Artificial Vital Organs and Medical Bionics Industry Volume (Piece) Forecast, by Application 2019 & 2032
- Table 81: Spain Artificial Vital Organs and Medical Bionics Industry Revenue (Million) Forecast, by Application 2019 & 2032
- Table 82: Spain Artificial Vital Organs and Medical Bionics Industry Volume (Piece) Forecast, by Application 2019 & 2032
- Table 83: Rest of Europe Artificial Vital Organs and Medical Bionics Industry Revenue (Million) Forecast, by Application 2019 & 2032
- Table 84: Rest of Europe Artificial Vital Organs and Medical Bionics Industry Volume (Piece) Forecast, by Application 2019 & 2032
- Table 85: Global Artificial Vital Organs and Medical Bionics Industry Revenue Million Forecast, by Type 2019 & 2032
- Table 86: Global Artificial Vital Organs and Medical Bionics Industry Volume Piece Forecast, by Type 2019 & 2032
- Table 87: Global Artificial Vital Organs and Medical Bionics Industry Revenue Million Forecast, by Country 2019 & 2032
- Table 88: Global Artificial Vital Organs and Medical Bionics Industry Volume Piece Forecast, by Country 2019 & 2032
- Table 89: China Artificial Vital Organs and Medical Bionics Industry Revenue (Million) Forecast, by Application 2019 & 2032
- Table 90: China Artificial Vital Organs and Medical Bionics Industry Volume (Piece) Forecast, by Application 2019 & 2032
- Table 91: Japan Artificial Vital Organs and Medical Bionics Industry Revenue (Million) Forecast, by Application 2019 & 2032
- Table 92: Japan Artificial Vital Organs and Medical Bionics Industry Volume (Piece) Forecast, by Application 2019 & 2032
- Table 93: India Artificial Vital Organs and Medical Bionics Industry Revenue (Million) Forecast, by Application 2019 & 2032
- Table 94: India Artificial Vital Organs and Medical Bionics Industry Volume (Piece) Forecast, by Application 2019 & 2032
- Table 95: Australia Artificial Vital Organs and Medical Bionics Industry Revenue (Million) Forecast, by Application 2019 & 2032
- Table 96: Australia Artificial Vital Organs and Medical Bionics Industry Volume (Piece) Forecast, by Application 2019 & 2032
- Table 97: South Korea Artificial Vital Organs and Medical Bionics Industry Revenue (Million) Forecast, by Application 2019 & 2032
- Table 98: South Korea Artificial Vital Organs and Medical Bionics Industry Volume (Piece) Forecast, by Application 2019 & 2032
- Table 99: Rest of Asia Pacific Artificial Vital Organs and Medical Bionics Industry Revenue (Million) Forecast, by Application 2019 & 2032
- Table 100: Rest of Asia Pacific Artificial Vital Organs and Medical Bionics Industry Volume (Piece) Forecast, by Application 2019 & 2032
- Table 101: Global Artificial Vital Organs and Medical Bionics Industry Revenue Million Forecast, by Type 2019 & 2032
- Table 102: Global Artificial Vital Organs and Medical Bionics Industry Volume Piece Forecast, by Type 2019 & 2032
- Table 103: Global Artificial Vital Organs and Medical Bionics Industry Revenue Million Forecast, by Country 2019 & 2032
- Table 104: Global Artificial Vital Organs and Medical Bionics Industry Volume Piece Forecast, by Country 2019 & 2032
- Table 105: GCC Artificial Vital Organs and Medical Bionics Industry Revenue (Million) Forecast, by Application 2019 & 2032
- Table 106: GCC Artificial Vital Organs and Medical Bionics Industry Volume (Piece) Forecast, by Application 2019 & 2032
- Table 107: South Africa Artificial Vital Organs and Medical Bionics Industry Revenue (Million) Forecast, by Application 2019 & 2032
- Table 108: South Africa Artificial Vital Organs and Medical Bionics Industry Volume (Piece) Forecast, by Application 2019 & 2032
- Table 109: Rest of Middle East and Africa Artificial Vital Organs and Medical Bionics Industry Revenue (Million) Forecast, by Application 2019 & 2032
- Table 110: Rest of Middle East and Africa Artificial Vital Organs and Medical Bionics Industry Volume (Piece) Forecast, by Application 2019 & 2032
- Table 111: Global Artificial Vital Organs and Medical Bionics Industry Revenue Million Forecast, by Type 2019 & 2032
- Table 112: Global Artificial Vital Organs and Medical Bionics Industry Volume Piece Forecast, by Type 2019 & 2032
- Table 113: Global Artificial Vital Organs and Medical Bionics Industry Revenue Million Forecast, by Country 2019 & 2032
- Table 114: Global Artificial Vital Organs and Medical Bionics Industry Volume Piece Forecast, by Country 2019 & 2032
- Table 115: Brazil Artificial Vital Organs and Medical Bionics Industry Revenue (Million) Forecast, by Application 2019 & 2032
- Table 116: Brazil Artificial Vital Organs and Medical Bionics Industry Volume (Piece) Forecast, by Application 2019 & 2032
- Table 117: Argentina Artificial Vital Organs and Medical Bionics Industry Revenue (Million) Forecast, by Application 2019 & 2032
- Table 118: Argentina Artificial Vital Organs and Medical Bionics Industry Volume (Piece) Forecast, by Application 2019 & 2032
- Table 119: Rest of South America Artificial Vital Organs and Medical Bionics Industry Revenue (Million) Forecast, by Application 2019 & 2032
- Table 120: Rest of South America Artificial Vital Organs and Medical Bionics Industry Volume (Piece) Forecast, by Application 2019 & 2032
Frequently Asked Questions
1. What is the projected Compound Annual Growth Rate (CAGR) of the Artificial Vital Organs and Medical Bionics Industry?
The projected CAGR is approximately 7.20%.
2. Which companies are prominent players in the Artificial Vital Organs and Medical Bionics Industry?
Key companies in the market include Bornlife Prosthetic and Orthotic Inc, Ossur, Abiomed Inc, Cyberonics Inc, Medtronic, Baxter, Asahi Kasei Medical Co Ltd, Getinge AB, Ekso Bionics Holdings Inc, Boston Scientific Corporation, Sonova*List Not Exhaustive, Berlin Heart GmbH.
3. What are the main segments of the Artificial Vital Organs and Medical Bionics Industry?
The market segments include Type.
4. Can you provide details about the market size?
The market size is estimated to be USD 29.84 Million as of 2022.
5. What are some drivers contributing to market growth?
Increased Incidence of Disabilities and Organ Failures; High Incidence of Road Accidents Leading to Amputations; Scarcity of Donor Organs; Technological Advancements in the Artificial Organ and Bionics.
6. What are the notable trends driving market growth?
Artificial Kidney by Artificial Organ Segment is anticipated to Grow Over the Forecast Period.
7. Are there any restraints impacting market growth?
Expensive Procedures; Compatibility Issues and Malfunctions.
8. Can you provide examples of recent developments in the market?
In August 2022, the American Society of Nephrology and the United States Department of Health and Human Services offered USD 10.5 million for a new prize competition from the Kidney Innovation Accelerator. Phase 2 of the Artificial Kidney Prize competition is looking for suggestions for creating prototype bioartificial kidneys, as well as any novel equipment or parts that would make them possible.
9. What pricing options are available for accessing the report?
Pricing options include single-user, multi-user, and enterprise licenses priced at USD 4750, USD 5250, and USD 8750 respectively.
10. Is the market size provided in terms of value or volume?
The market size is provided in terms of value, measured in Million and volume, measured in Piece.
11. Are there any specific market keywords associated with the report?
Yes, the market keyword associated with the report is "Artificial Vital Organs and Medical Bionics Industry," which aids in identifying and referencing the specific market segment covered.
12. How do I determine which pricing option suits my needs best?
The pricing options vary based on user requirements and access needs. Individual users may opt for single-user licenses, while businesses requiring broader access may choose multi-user or enterprise licenses for cost-effective access to the report.
13. Are there any additional resources or data provided in the Artificial Vital Organs and Medical Bionics Industry report?
While the report offers comprehensive insights, it's advisable to review the specific contents or supplementary materials provided to ascertain if additional resources or data are available.
14. How can I stay updated on further developments or reports in the Artificial Vital Organs and Medical Bionics Industry?
To stay informed about further developments, trends, and reports in the Artificial Vital Organs and Medical Bionics Industry, consider subscribing to industry newsletters, following relevant companies and organizations, or regularly checking reputable industry news sources and publications.
Methodology
Step 1 - Identification of Relevant Samples Size from Population Database


Step 2 - Approaches for Defining Global Market Size (Value, Volume* & Price*)

Note*: In applicable scenarios
Step 3 - Data Sources
Primary Research
- Web Analytics
- Survey Reports
- Research Institute
- Latest Research Reports
- Opinion Leaders
Secondary Research
- Annual Reports
- White Paper
- Latest Press Release
- Industry Association
- Paid Database
- Investor Presentations

Step 4 - Data Triangulation
Involves using different sources of information in order to increase the validity of a study
These sources are likely to be stakeholders in a program - participants, other researchers, program staff, other community members, and so on.
Then we put all data in single framework & apply various statistical tools to find out the dynamic on the market.
During the analysis stage, feedback from the stakeholder groups would be compared to determine areas of agreement as well as areas of divergence


