
Key Insights
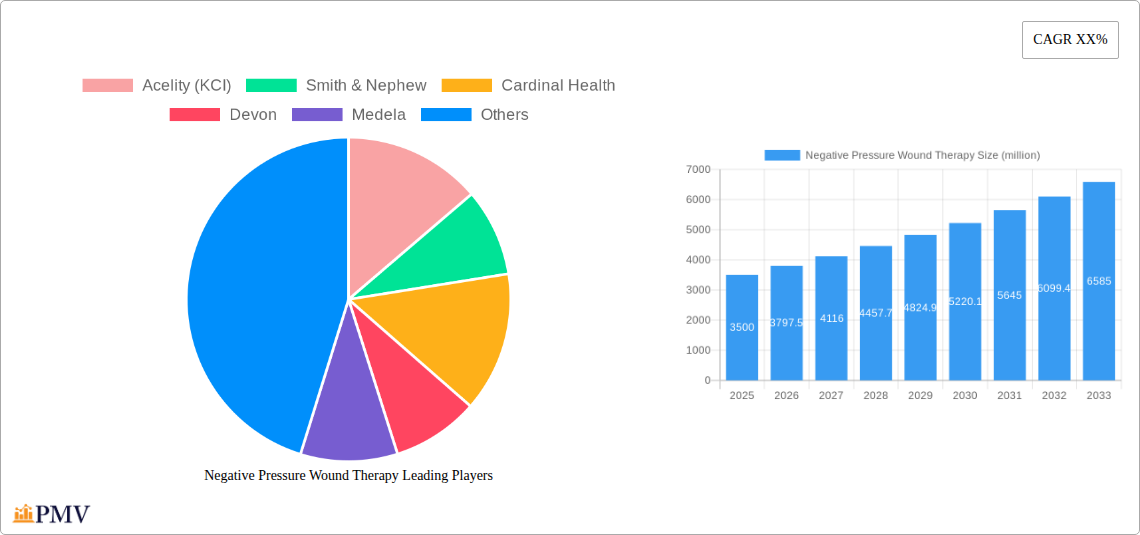
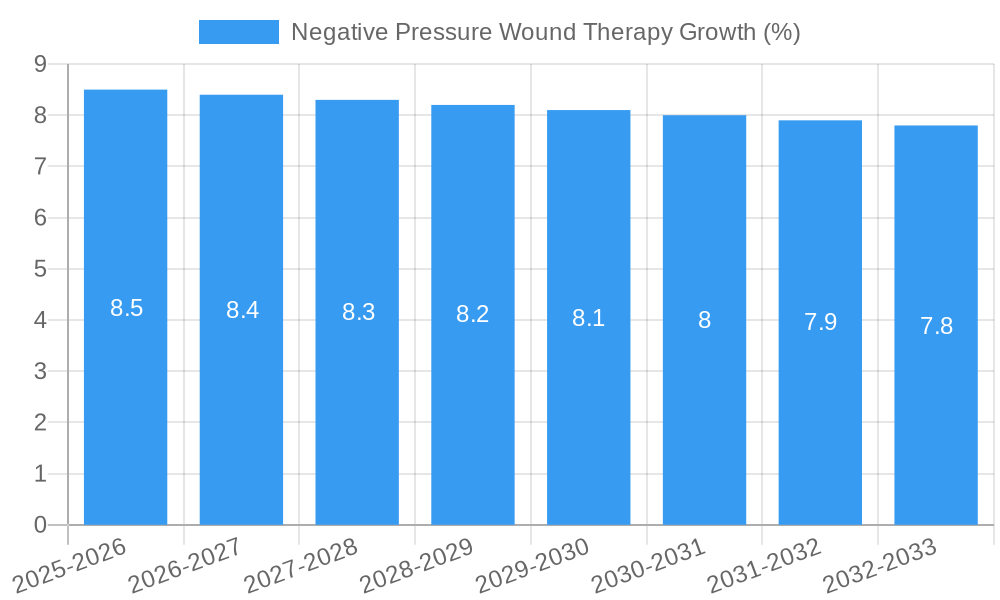
The global Negative Pressure Wound Therapy (NPWT) market is experiencing robust expansion, projected to reach an estimated USD 3,500 million in 2025 and grow at a significant Compound Annual Growth Rate (CAGR) of 8.5% through 2033. This upward trajectory is primarily fueled by the increasing prevalence of chronic wounds, such as diabetic foot ulcers and pressure ulcers, driven by aging global populations and rising rates of lifestyle-related diseases. Advancements in NPWT technology, including the development of portable and disposable devices, are enhancing patient comfort, reducing infection risks, and improving healing outcomes, thereby driving adoption across various healthcare settings. The growing demand for homecare solutions, facilitated by the convenience and effectiveness of NPWT, further bolsters market growth.
The market is strategically segmented to cater to diverse healthcare needs. In terms of application, hospitals remain a dominant segment due to the concentration of complex wound cases and the availability of specialized medical infrastructure. However, clinics and homecare settings are emerging as significant growth areas, reflecting the trend towards decentralized healthcare delivery and patient empowerment. On the product type front, disposable NPWT devices are gaining considerable traction, offering enhanced ease of use and cost-effectiveness compared to conventional reusable systems. Key industry players like Acelity (KCI), Smith & Nephew, and Cardinal Health are actively investing in research and development, expanding their product portfolios, and forging strategic partnerships to capitalize on these market dynamics and address unmet clinical needs globally.
This detailed report provides an in-depth analysis of the global Negative Pressure Wound Therapy (NPWT) market, offering strategic insights for industry stakeholders. Covering the historical period from 2019 to 2024 and projecting growth through 2033, this study is an indispensable resource for understanding market dynamics, identifying lucrative opportunities, and navigating the evolving landscape of advanced wound management.
Negative Pressure Wound Therapy Market Structure & Competitive Dynamics
The Negative Pressure Wound Therapy (NPWT) market exhibits a moderate to high degree of concentration, with leading players holding significant market share. Innovation ecosystems are robust, driven by continuous research and development and strategic collaborations. Regulatory frameworks, while evolving, provide a foundation for market entry and product approval, though compliance remains a critical aspect for companies. Product substitutes, such as traditional wound dressings and advanced topical treatments, exist but are increasingly being overshadowed by the superior efficacy of NPWT for complex wounds. End-user trends point towards a growing demand for minimally invasive and effective treatments, fueling the adoption of NPWT across various healthcare settings. Mergers and acquisitions (M&A) activities are notable, with recent deals valued in the hundreds of millions signifying consolidation and strategic expansion. For instance, key M&A transactions have focused on acquiring innovative technologies and expanding geographical reach. The competitive landscape is shaped by a blend of established giants and emerging innovators, all vying for market dominance through product differentiation and strategic partnerships. Market share analysis indicates that established companies like Acelity (KCI) and Smith & Nephew command substantial portions of the global market, estimated in the billions of dollars.
Negative Pressure Wound Therapy Industry Trends & Insights
The Negative Pressure Wound Therapy (NPWT) market is experiencing robust growth, propelled by a convergence of factors that are redefining advanced wound care. A significant market growth driver is the increasing global prevalence of chronic wounds, including diabetic foot ulcers, pressure ulcers, and venous leg ulcers, which are often complex and resistant to conventional treatments. This escalating burden on healthcare systems necessitates more effective therapeutic interventions, positioning NPWT as a leading solution. Technological disruptions are at the forefront of this evolution, with continuous innovation leading to the development of more sophisticated and user-friendly NPWT devices. These advancements include miniaturized portable systems, smart devices with integrated monitoring capabilities, and improved dressing materials that enhance patient comfort and treatment outcomes. Consumer preferences are shifting towards treatments that offer faster healing times, reduced pain, and improved quality of life, all of which are key benefits associated with NPWT. The competitive dynamics within the industry are characterized by intense innovation, strategic alliances, and a focus on expanding access to these advanced therapies. Market penetration of NPWT is steadily increasing, particularly in developed economies, as healthcare professionals recognize its efficacy in reducing hospital stays, preventing complications, and lowering overall treatment costs. The projected Compound Annual Growth Rate (CAGR) for the NPWT market is estimated to be around 8-10% over the forecast period, driven by these influential trends. Furthermore, the growing awareness among both healthcare providers and patients regarding the benefits of NPWT, coupled with increasing reimbursement coverage in various regions, is further accelerating its adoption. The rising incidence of surgical site infections and the subsequent demand for effective post-operative wound management also contribute significantly to market expansion.
Dominant Markets & Segments in Negative Pressure Wound Therapy
The global Negative Pressure Wound Therapy (NPWT) market is characterized by distinct regional and segment dominance, driven by a confluence of healthcare infrastructure, economic policies, and end-user adoption rates.
Regional Dominance:
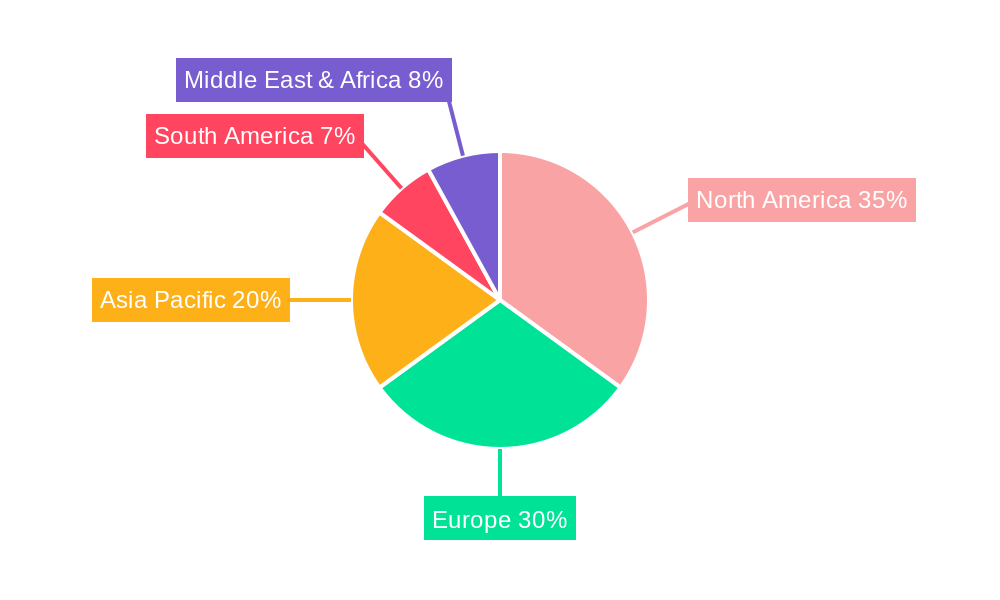
- North America currently holds the leading position in the NPWT market, driven by a well-established healthcare infrastructure, high healthcare expenditure, and a strong emphasis on adopting advanced medical technologies. The significant prevalence of chronic diseases, such as diabetes, which often leads to complex wound complications, further fuels demand.
- Europe follows closely, with advanced healthcare systems and favorable reimbursement policies contributing to widespread NPWT adoption in hospitals and clinics.
- Asia Pacific is emerging as a high-growth region, owing to increasing healthcare investments, rising disposable incomes, and a growing awareness of advanced wound care solutions, particularly in countries like China and India.
Segment Dominance:
- Application: Hospitals represent the largest and most dominant application segment for NPWT. The complex nature of wounds treated in inpatient settings, coupled with the availability of specialized medical staff and robust infrastructure, makes hospitals the primary adopters of NPWT devices. Economic policies that prioritize efficient patient recovery and reduced readmission rates further support this dominance.
- Types: Disposable NPWT Devices are experiencing significant growth and are poised to become increasingly dominant. Their convenience, ease of use, and reduced risk of infection compared to reusable systems make them highly attractive across all application settings. The initial investment for disposable systems is often lower, making them accessible to a wider range of healthcare facilities.
Key drivers of dominance within these segments include:
- Economic Policies: Government initiatives promoting wound healing, reducing healthcare costs associated with chronic wounds, and supporting the adoption of advanced medical devices.
- Infrastructure: Well-developed hospital networks, specialized wound care centers, and the availability of trained personnel to operate NPWT systems.
- Technological Advancements: Continuous innovation in disposable NPWT kits and portable devices that cater to the specific needs of hospital environments and outpatient care.
- Reimbursement Policies: Favorable reimbursement structures for NPWT procedures and devices in key markets, encouraging their widespread use.
The market size for hospitals is projected to reach billions of dollars by 2033, with disposable NPWT devices capturing an increasingly larger share due to their user-friendliness and cost-effectiveness in the long run.
Negative Pressure Wound Therapy Product Innovations
Product innovations in Negative Pressure Wound Therapy (NPWT) are primarily focused on enhancing patient comfort, improving portability, and integrating smart technologies. Developments include advanced foam and gauze dressings designed for better conformity to wound beds, reducing pain and improving exudate management. Miniaturized and portable NPWT systems are gaining traction, enabling seamless transition of patients from hospital to homecare settings. Furthermore, the integration of pressure sensors and connectivity features in some devices allows for remote monitoring and data logging, providing valuable insights into treatment efficacy and patient adherence. These innovations offer distinct competitive advantages by addressing unmet clinical needs and improving the overall patient experience.
Report Segmentation & Scope
This comprehensive report segments the Negative Pressure Wound Therapy market across key dimensions for detailed analysis.
Application Segmentation:
- Hospitals: This segment encompasses the use of NPWT in acute care settings, including surgical wards, intensive care units, and emergency departments. Projected market growth in this segment is substantial, reaching billions of dollars, driven by the high acuity of wounds and established reimbursement pathways.
- Clinics: This includes outpatient wound care centers and specialty clinics. While currently a smaller segment, it is expected to witness significant expansion as NPWT devices become more accessible and patient preference for outpatient care grows.
- Homecare: This rapidly growing segment focuses on NPWT devices used in patients' residences. Its growth is fueled by the demand for convenient, long-term wound management solutions and the increasing capabilities of portable NPWT systems.
Type Segmentation:
- Conventional NPWT Devices: These are typically larger, stationary systems often used in hospital settings. While established, their market share is gradually being complemented by more advanced alternatives.
- Disposable NPWT Devices: This segment includes single-use systems comprising a canister, tubing, and a foam or gauze dressing. They offer convenience and infection control benefits, driving significant market growth and projected to capture a market share in the hundreds of millions by the end of the forecast period.
Key Drivers of Negative Pressure Wound Therapy Growth
The Negative Pressure Wound Therapy (NPWT) market is propelled by several powerful growth drivers. Technologically, the continuous innovation in developing smaller, more portable, and user-friendly NPWT devices significantly enhances patient mobility and homecare accessibility. Economically, the increasing burden of chronic wounds, such as diabetic foot ulcers and pressure ulcers, leads to substantial healthcare costs, making cost-effective solutions like NPWT highly attractive. Favorable reimbursement policies for NPWT procedures in key markets further encourage adoption. Regulatory bodies are also increasingly recognizing the efficacy of NPWT, facilitating market access. Furthermore, a growing awareness among healthcare professionals and patients about the benefits of NPWT, including accelerated healing, reduced infection rates, and improved patient outcomes, acts as a crucial catalyst for market expansion.
Challenges in the Negative Pressure Wound Therapy Sector
Despite its significant growth potential, the Negative Pressure Wound Therapy (NPWT) sector faces several challenges. Regulatory hurdles can be substantial, with stringent approval processes for new devices and therapies in different regions potentially slowing down market entry. Supply chain disruptions, exacerbated by global events, can impact the availability and cost of essential NPWT components and consumables, leading to potential stockouts and increased operational expenses. Competitive pressures from both established players and emerging companies can lead to pricing wars and a need for constant innovation to maintain market share. Furthermore, the high initial cost of some advanced NPWT systems can be a barrier to adoption in resource-constrained healthcare settings. Training and education for healthcare professionals on the correct application and management of NPWT also remain crucial for optimal outcomes. The estimated financial impact of these challenges could represent a loss in potential market revenue in the tens to hundreds of millions.
Leading Players in the Negative Pressure Wound Therapy Market
- Acelity (KCI)
- Smith & Nephew
- Cardinal Health
- Devon
- Medela
- Triage Meditech
- WuHan VSD
- Talley Group
Key Developments in Negative Pressure Wound Therapy Sector
- 2023: Launch of new generation portable NPWT devices with enhanced battery life and connectivity features.
- 2023: Strategic partnership formed between a leading NPWT manufacturer and a major medical device distributor to expand market reach in emerging economies.
- 2022: Acquisition of a niche NPWT technology company by a global player to bolster its product portfolio in specialized wound care applications.
- 2022: FDA clearance for a novel disposable NPWT system designed for complex surgical site management.
- 2021: Introduction of advanced NPWT dressings with antimicrobial properties to combat wound infections.
- 2021: Increased focus on homecare NPWT solutions, with companies investing in user-friendly interfaces and remote monitoring capabilities.
- 2020: Significant advancements in research and development for NPWT devices targeting burns and trauma management.
Strategic Negative Pressure Wound Therapy Market Outlook
The strategic outlook for the Negative Pressure Wound Therapy (NPWT) market remains exceptionally strong, driven by an aging global population, a rising incidence of chronic diseases, and a consistent demand for more effective wound management solutions. Future growth accelerators include the continued development of smart NPWT devices with integrated data analytics for personalized treatment plans, and the expansion of homecare services leveraging advanced portable systems. Strategic opportunities lie in emerging markets where the adoption of advanced wound care is still in its nascent stages, offering significant untapped potential. Companies that focus on product innovation, cost-effectiveness, and strategic partnerships with healthcare providers and payers are well-positioned to capitalize on the evolving needs of patients and the healthcare landscape, contributing to a projected market value in the tens of billions by 2033.
Negative Pressure Wound Therapy Segmentation
-
1. Application
- 1.1. Hospitals
- 1.2. Clinics
- 1.3. Homecare
-
2. Types
- 2.1. Conventional NPWT Devices
- 2.2. Disposable NPWT Devices
Negative Pressure Wound Therapy Segmentation By Geography
-
1. North America
- 1.1. United States
- 1.2. Canada
- 1.3. Mexico
-
2. South America
- 2.1. Brazil
- 2.2. Argentina
- 2.3. Rest of South America
-
3. Europe
- 3.1. United Kingdom
- 3.2. Germany
- 3.3. France
- 3.4. Italy
- 3.5. Spain
- 3.6. Russia
- 3.7. Benelux
- 3.8. Nordics
- 3.9. Rest of Europe
-
4. Middle East & Africa
- 4.1. Turkey
- 4.2. Israel
- 4.3. GCC
- 4.4. North Africa
- 4.5. South Africa
- 4.6. Rest of Middle East & Africa
-
5. Asia Pacific
- 5.1. China
- 5.2. India
- 5.3. Japan
- 5.4. South Korea
- 5.5. ASEAN
- 5.6. Oceania
- 5.7. Rest of Asia Pacific
Negative Pressure Wound Therapy REPORT HIGHLIGHTS
| Aspects | Details |
|---|---|
| Study Period | 2019-2033 |
| Base Year | 2024 |
| Estimated Year | 2025 |
| Forecast Period | 2025-2033 |
| Historical Period | 2019-2024 |
| Growth Rate | CAGR of XX% from 2019-2033 |
| Segmentation |
|
Table of Contents
- 1. Introduction
- 1.1. Research Scope
- 1.2. Market Segmentation
- 1.3. Research Methodology
- 1.4. Definitions and Assumptions
- 2. Executive Summary
- 2.1. Introduction
- 3. Market Dynamics
- 3.1. Introduction
- 3.2. Market Drivers
- 3.3. Market Restrains
- 3.4. Market Trends
- 4. Market Factor Analysis
- 4.1. Porters Five Forces
- 4.2. Supply/Value Chain
- 4.3. PESTEL analysis
- 4.4. Market Entropy
- 4.5. Patent/Trademark Analysis
- 5. Global Negative Pressure Wound Therapy Analysis, Insights and Forecast, 2019-2031
- 5.1. Market Analysis, Insights and Forecast - by Application
- 5.1.1. Hospitals
- 5.1.2. Clinics
- 5.1.3. Homecare
- 5.2. Market Analysis, Insights and Forecast - by Types
- 5.2.1. Conventional NPWT Devices
- 5.2.2. Disposable NPWT Devices
- 5.3. Market Analysis, Insights and Forecast - by Region
- 5.3.1. North America
- 5.3.2. South America
- 5.3.3. Europe
- 5.3.4. Middle East & Africa
- 5.3.5. Asia Pacific
- 5.1. Market Analysis, Insights and Forecast - by Application
- 6. North America Negative Pressure Wound Therapy Analysis, Insights and Forecast, 2019-2031
- 6.1. Market Analysis, Insights and Forecast - by Application
- 6.1.1. Hospitals
- 6.1.2. Clinics
- 6.1.3. Homecare
- 6.2. Market Analysis, Insights and Forecast - by Types
- 6.2.1. Conventional NPWT Devices
- 6.2.2. Disposable NPWT Devices
- 6.1. Market Analysis, Insights and Forecast - by Application
- 7. South America Negative Pressure Wound Therapy Analysis, Insights and Forecast, 2019-2031
- 7.1. Market Analysis, Insights and Forecast - by Application
- 7.1.1. Hospitals
- 7.1.2. Clinics
- 7.1.3. Homecare
- 7.2. Market Analysis, Insights and Forecast - by Types
- 7.2.1. Conventional NPWT Devices
- 7.2.2. Disposable NPWT Devices
- 7.1. Market Analysis, Insights and Forecast - by Application
- 8. Europe Negative Pressure Wound Therapy Analysis, Insights and Forecast, 2019-2031
- 8.1. Market Analysis, Insights and Forecast - by Application
- 8.1.1. Hospitals
- 8.1.2. Clinics
- 8.1.3. Homecare
- 8.2. Market Analysis, Insights and Forecast - by Types
- 8.2.1. Conventional NPWT Devices
- 8.2.2. Disposable NPWT Devices
- 8.1. Market Analysis, Insights and Forecast - by Application
- 9. Middle East & Africa Negative Pressure Wound Therapy Analysis, Insights and Forecast, 2019-2031
- 9.1. Market Analysis, Insights and Forecast - by Application
- 9.1.1. Hospitals
- 9.1.2. Clinics
- 9.1.3. Homecare
- 9.2. Market Analysis, Insights and Forecast - by Types
- 9.2.1. Conventional NPWT Devices
- 9.2.2. Disposable NPWT Devices
- 9.1. Market Analysis, Insights and Forecast - by Application
- 10. Asia Pacific Negative Pressure Wound Therapy Analysis, Insights and Forecast, 2019-2031
- 10.1. Market Analysis, Insights and Forecast - by Application
- 10.1.1. Hospitals
- 10.1.2. Clinics
- 10.1.3. Homecare
- 10.2. Market Analysis, Insights and Forecast - by Types
- 10.2.1. Conventional NPWT Devices
- 10.2.2. Disposable NPWT Devices
- 10.1. Market Analysis, Insights and Forecast - by Application
- 11. Competitive Analysis
- 11.1. Global Market Share Analysis 2024
- 11.2. Company Profiles
- 11.2.1 Acelity (KCI)
- 11.2.1.1. Overview
- 11.2.1.2. Products
- 11.2.1.3. SWOT Analysis
- 11.2.1.4. Recent Developments
- 11.2.1.5. Financials (Based on Availability)
- 11.2.2 Smith & Nephew
- 11.2.2.1. Overview
- 11.2.2.2. Products
- 11.2.2.3. SWOT Analysis
- 11.2.2.4. Recent Developments
- 11.2.2.5. Financials (Based on Availability)
- 11.2.3 Cardinal Health
- 11.2.3.1. Overview
- 11.2.3.2. Products
- 11.2.3.3. SWOT Analysis
- 11.2.3.4. Recent Developments
- 11.2.3.5. Financials (Based on Availability)
- 11.2.4 Devon
- 11.2.4.1. Overview
- 11.2.4.2. Products
- 11.2.4.3. SWOT Analysis
- 11.2.4.4. Recent Developments
- 11.2.4.5. Financials (Based on Availability)
- 11.2.5 Medela
- 11.2.5.1. Overview
- 11.2.5.2. Products
- 11.2.5.3. SWOT Analysis
- 11.2.5.4. Recent Developments
- 11.2.5.5. Financials (Based on Availability)
- 11.2.6 Triage Meditech
- 11.2.6.1. Overview
- 11.2.6.2. Products
- 11.2.6.3. SWOT Analysis
- 11.2.6.4. Recent Developments
- 11.2.6.5. Financials (Based on Availability)
- 11.2.7 WuHan VSD
- 11.2.7.1. Overview
- 11.2.7.2. Products
- 11.2.7.3. SWOT Analysis
- 11.2.7.4. Recent Developments
- 11.2.7.5. Financials (Based on Availability)
- 11.2.8 Talley Group
- 11.2.8.1. Overview
- 11.2.8.2. Products
- 11.2.8.3. SWOT Analysis
- 11.2.8.4. Recent Developments
- 11.2.8.5. Financials (Based on Availability)
- 11.2.1 Acelity (KCI)
List of Figures
- Figure 1: Global Negative Pressure Wound Therapy Revenue Breakdown (million, %) by Region 2024 & 2032
- Figure 2: Global Negative Pressure Wound Therapy Volume Breakdown (K, %) by Region 2024 & 2032
- Figure 3: North America Negative Pressure Wound Therapy Revenue (million), by Application 2024 & 2032
- Figure 4: North America Negative Pressure Wound Therapy Volume (K), by Application 2024 & 2032
- Figure 5: North America Negative Pressure Wound Therapy Revenue Share (%), by Application 2024 & 2032
- Figure 6: North America Negative Pressure Wound Therapy Volume Share (%), by Application 2024 & 2032
- Figure 7: North America Negative Pressure Wound Therapy Revenue (million), by Types 2024 & 2032
- Figure 8: North America Negative Pressure Wound Therapy Volume (K), by Types 2024 & 2032
- Figure 9: North America Negative Pressure Wound Therapy Revenue Share (%), by Types 2024 & 2032
- Figure 10: North America Negative Pressure Wound Therapy Volume Share (%), by Types 2024 & 2032
- Figure 11: North America Negative Pressure Wound Therapy Revenue (million), by Country 2024 & 2032
- Figure 12: North America Negative Pressure Wound Therapy Volume (K), by Country 2024 & 2032
- Figure 13: North America Negative Pressure Wound Therapy Revenue Share (%), by Country 2024 & 2032
- Figure 14: North America Negative Pressure Wound Therapy Volume Share (%), by Country 2024 & 2032
- Figure 15: South America Negative Pressure Wound Therapy Revenue (million), by Application 2024 & 2032
- Figure 16: South America Negative Pressure Wound Therapy Volume (K), by Application 2024 & 2032
- Figure 17: South America Negative Pressure Wound Therapy Revenue Share (%), by Application 2024 & 2032
- Figure 18: South America Negative Pressure Wound Therapy Volume Share (%), by Application 2024 & 2032
- Figure 19: South America Negative Pressure Wound Therapy Revenue (million), by Types 2024 & 2032
- Figure 20: South America Negative Pressure Wound Therapy Volume (K), by Types 2024 & 2032
- Figure 21: South America Negative Pressure Wound Therapy Revenue Share (%), by Types 2024 & 2032
- Figure 22: South America Negative Pressure Wound Therapy Volume Share (%), by Types 2024 & 2032
- Figure 23: South America Negative Pressure Wound Therapy Revenue (million), by Country 2024 & 2032
- Figure 24: South America Negative Pressure Wound Therapy Volume (K), by Country 2024 & 2032
- Figure 25: South America Negative Pressure Wound Therapy Revenue Share (%), by Country 2024 & 2032
- Figure 26: South America Negative Pressure Wound Therapy Volume Share (%), by Country 2024 & 2032
- Figure 27: Europe Negative Pressure Wound Therapy Revenue (million), by Application 2024 & 2032
- Figure 28: Europe Negative Pressure Wound Therapy Volume (K), by Application 2024 & 2032
- Figure 29: Europe Negative Pressure Wound Therapy Revenue Share (%), by Application 2024 & 2032
- Figure 30: Europe Negative Pressure Wound Therapy Volume Share (%), by Application 2024 & 2032
- Figure 31: Europe Negative Pressure Wound Therapy Revenue (million), by Types 2024 & 2032
- Figure 32: Europe Negative Pressure Wound Therapy Volume (K), by Types 2024 & 2032
- Figure 33: Europe Negative Pressure Wound Therapy Revenue Share (%), by Types 2024 & 2032
- Figure 34: Europe Negative Pressure Wound Therapy Volume Share (%), by Types 2024 & 2032
- Figure 35: Europe Negative Pressure Wound Therapy Revenue (million), by Country 2024 & 2032
- Figure 36: Europe Negative Pressure Wound Therapy Volume (K), by Country 2024 & 2032
- Figure 37: Europe Negative Pressure Wound Therapy Revenue Share (%), by Country 2024 & 2032
- Figure 38: Europe Negative Pressure Wound Therapy Volume Share (%), by Country 2024 & 2032
- Figure 39: Middle East & Africa Negative Pressure Wound Therapy Revenue (million), by Application 2024 & 2032
- Figure 40: Middle East & Africa Negative Pressure Wound Therapy Volume (K), by Application 2024 & 2032
- Figure 41: Middle East & Africa Negative Pressure Wound Therapy Revenue Share (%), by Application 2024 & 2032
- Figure 42: Middle East & Africa Negative Pressure Wound Therapy Volume Share (%), by Application 2024 & 2032
- Figure 43: Middle East & Africa Negative Pressure Wound Therapy Revenue (million), by Types 2024 & 2032
- Figure 44: Middle East & Africa Negative Pressure Wound Therapy Volume (K), by Types 2024 & 2032
- Figure 45: Middle East & Africa Negative Pressure Wound Therapy Revenue Share (%), by Types 2024 & 2032
- Figure 46: Middle East & Africa Negative Pressure Wound Therapy Volume Share (%), by Types 2024 & 2032
- Figure 47: Middle East & Africa Negative Pressure Wound Therapy Revenue (million), by Country 2024 & 2032
- Figure 48: Middle East & Africa Negative Pressure Wound Therapy Volume (K), by Country 2024 & 2032
- Figure 49: Middle East & Africa Negative Pressure Wound Therapy Revenue Share (%), by Country 2024 & 2032
- Figure 50: Middle East & Africa Negative Pressure Wound Therapy Volume Share (%), by Country 2024 & 2032
- Figure 51: Asia Pacific Negative Pressure Wound Therapy Revenue (million), by Application 2024 & 2032
- Figure 52: Asia Pacific Negative Pressure Wound Therapy Volume (K), by Application 2024 & 2032
- Figure 53: Asia Pacific Negative Pressure Wound Therapy Revenue Share (%), by Application 2024 & 2032
- Figure 54: Asia Pacific Negative Pressure Wound Therapy Volume Share (%), by Application 2024 & 2032
- Figure 55: Asia Pacific Negative Pressure Wound Therapy Revenue (million), by Types 2024 & 2032
- Figure 56: Asia Pacific Negative Pressure Wound Therapy Volume (K), by Types 2024 & 2032
- Figure 57: Asia Pacific Negative Pressure Wound Therapy Revenue Share (%), by Types 2024 & 2032
- Figure 58: Asia Pacific Negative Pressure Wound Therapy Volume Share (%), by Types 2024 & 2032
- Figure 59: Asia Pacific Negative Pressure Wound Therapy Revenue (million), by Country 2024 & 2032
- Figure 60: Asia Pacific Negative Pressure Wound Therapy Volume (K), by Country 2024 & 2032
- Figure 61: Asia Pacific Negative Pressure Wound Therapy Revenue Share (%), by Country 2024 & 2032
- Figure 62: Asia Pacific Negative Pressure Wound Therapy Volume Share (%), by Country 2024 & 2032
List of Tables
- Table 1: Global Negative Pressure Wound Therapy Revenue million Forecast, by Region 2019 & 2032
- Table 2: Global Negative Pressure Wound Therapy Volume K Forecast, by Region 2019 & 2032
- Table 3: Global Negative Pressure Wound Therapy Revenue million Forecast, by Application 2019 & 2032
- Table 4: Global Negative Pressure Wound Therapy Volume K Forecast, by Application 2019 & 2032
- Table 5: Global Negative Pressure Wound Therapy Revenue million Forecast, by Types 2019 & 2032
- Table 6: Global Negative Pressure Wound Therapy Volume K Forecast, by Types 2019 & 2032
- Table 7: Global Negative Pressure Wound Therapy Revenue million Forecast, by Region 2019 & 2032
- Table 8: Global Negative Pressure Wound Therapy Volume K Forecast, by Region 2019 & 2032
- Table 9: Global Negative Pressure Wound Therapy Revenue million Forecast, by Application 2019 & 2032
- Table 10: Global Negative Pressure Wound Therapy Volume K Forecast, by Application 2019 & 2032
- Table 11: Global Negative Pressure Wound Therapy Revenue million Forecast, by Types 2019 & 2032
- Table 12: Global Negative Pressure Wound Therapy Volume K Forecast, by Types 2019 & 2032
- Table 13: Global Negative Pressure Wound Therapy Revenue million Forecast, by Country 2019 & 2032
- Table 14: Global Negative Pressure Wound Therapy Volume K Forecast, by Country 2019 & 2032
- Table 15: United States Negative Pressure Wound Therapy Revenue (million) Forecast, by Application 2019 & 2032
- Table 16: United States Negative Pressure Wound Therapy Volume (K) Forecast, by Application 2019 & 2032
- Table 17: Canada Negative Pressure Wound Therapy Revenue (million) Forecast, by Application 2019 & 2032
- Table 18: Canada Negative Pressure Wound Therapy Volume (K) Forecast, by Application 2019 & 2032
- Table 19: Mexico Negative Pressure Wound Therapy Revenue (million) Forecast, by Application 2019 & 2032
- Table 20: Mexico Negative Pressure Wound Therapy Volume (K) Forecast, by Application 2019 & 2032
- Table 21: Global Negative Pressure Wound Therapy Revenue million Forecast, by Application 2019 & 2032
- Table 22: Global Negative Pressure Wound Therapy Volume K Forecast, by Application 2019 & 2032
- Table 23: Global Negative Pressure Wound Therapy Revenue million Forecast, by Types 2019 & 2032
- Table 24: Global Negative Pressure Wound Therapy Volume K Forecast, by Types 2019 & 2032
- Table 25: Global Negative Pressure Wound Therapy Revenue million Forecast, by Country 2019 & 2032
- Table 26: Global Negative Pressure Wound Therapy Volume K Forecast, by Country 2019 & 2032
- Table 27: Brazil Negative Pressure Wound Therapy Revenue (million) Forecast, by Application 2019 & 2032
- Table 28: Brazil Negative Pressure Wound Therapy Volume (K) Forecast, by Application 2019 & 2032
- Table 29: Argentina Negative Pressure Wound Therapy Revenue (million) Forecast, by Application 2019 & 2032
- Table 30: Argentina Negative Pressure Wound Therapy Volume (K) Forecast, by Application 2019 & 2032
- Table 31: Rest of South America Negative Pressure Wound Therapy Revenue (million) Forecast, by Application 2019 & 2032
- Table 32: Rest of South America Negative Pressure Wound Therapy Volume (K) Forecast, by Application 2019 & 2032
- Table 33: Global Negative Pressure Wound Therapy Revenue million Forecast, by Application 2019 & 2032
- Table 34: Global Negative Pressure Wound Therapy Volume K Forecast, by Application 2019 & 2032
- Table 35: Global Negative Pressure Wound Therapy Revenue million Forecast, by Types 2019 & 2032
- Table 36: Global Negative Pressure Wound Therapy Volume K Forecast, by Types 2019 & 2032
- Table 37: Global Negative Pressure Wound Therapy Revenue million Forecast, by Country 2019 & 2032
- Table 38: Global Negative Pressure Wound Therapy Volume K Forecast, by Country 2019 & 2032
- Table 39: United Kingdom Negative Pressure Wound Therapy Revenue (million) Forecast, by Application 2019 & 2032
- Table 40: United Kingdom Negative Pressure Wound Therapy Volume (K) Forecast, by Application 2019 & 2032
- Table 41: Germany Negative Pressure Wound Therapy Revenue (million) Forecast, by Application 2019 & 2032
- Table 42: Germany Negative Pressure Wound Therapy Volume (K) Forecast, by Application 2019 & 2032
- Table 43: France Negative Pressure Wound Therapy Revenue (million) Forecast, by Application 2019 & 2032
- Table 44: France Negative Pressure Wound Therapy Volume (K) Forecast, by Application 2019 & 2032
- Table 45: Italy Negative Pressure Wound Therapy Revenue (million) Forecast, by Application 2019 & 2032
- Table 46: Italy Negative Pressure Wound Therapy Volume (K) Forecast, by Application 2019 & 2032
- Table 47: Spain Negative Pressure Wound Therapy Revenue (million) Forecast, by Application 2019 & 2032
- Table 48: Spain Negative Pressure Wound Therapy Volume (K) Forecast, by Application 2019 & 2032
- Table 49: Russia Negative Pressure Wound Therapy Revenue (million) Forecast, by Application 2019 & 2032
- Table 50: Russia Negative Pressure Wound Therapy Volume (K) Forecast, by Application 2019 & 2032
- Table 51: Benelux Negative Pressure Wound Therapy Revenue (million) Forecast, by Application 2019 & 2032
- Table 52: Benelux Negative Pressure Wound Therapy Volume (K) Forecast, by Application 2019 & 2032
- Table 53: Nordics Negative Pressure Wound Therapy Revenue (million) Forecast, by Application 2019 & 2032
- Table 54: Nordics Negative Pressure Wound Therapy Volume (K) Forecast, by Application 2019 & 2032
- Table 55: Rest of Europe Negative Pressure Wound Therapy Revenue (million) Forecast, by Application 2019 & 2032
- Table 56: Rest of Europe Negative Pressure Wound Therapy Volume (K) Forecast, by Application 2019 & 2032
- Table 57: Global Negative Pressure Wound Therapy Revenue million Forecast, by Application 2019 & 2032
- Table 58: Global Negative Pressure Wound Therapy Volume K Forecast, by Application 2019 & 2032
- Table 59: Global Negative Pressure Wound Therapy Revenue million Forecast, by Types 2019 & 2032
- Table 60: Global Negative Pressure Wound Therapy Volume K Forecast, by Types 2019 & 2032
- Table 61: Global Negative Pressure Wound Therapy Revenue million Forecast, by Country 2019 & 2032
- Table 62: Global Negative Pressure Wound Therapy Volume K Forecast, by Country 2019 & 2032
- Table 63: Turkey Negative Pressure Wound Therapy Revenue (million) Forecast, by Application 2019 & 2032
- Table 64: Turkey Negative Pressure Wound Therapy Volume (K) Forecast, by Application 2019 & 2032
- Table 65: Israel Negative Pressure Wound Therapy Revenue (million) Forecast, by Application 2019 & 2032
- Table 66: Israel Negative Pressure Wound Therapy Volume (K) Forecast, by Application 2019 & 2032
- Table 67: GCC Negative Pressure Wound Therapy Revenue (million) Forecast, by Application 2019 & 2032
- Table 68: GCC Negative Pressure Wound Therapy Volume (K) Forecast, by Application 2019 & 2032
- Table 69: North Africa Negative Pressure Wound Therapy Revenue (million) Forecast, by Application 2019 & 2032
- Table 70: North Africa Negative Pressure Wound Therapy Volume (K) Forecast, by Application 2019 & 2032
- Table 71: South Africa Negative Pressure Wound Therapy Revenue (million) Forecast, by Application 2019 & 2032
- Table 72: South Africa Negative Pressure Wound Therapy Volume (K) Forecast, by Application 2019 & 2032
- Table 73: Rest of Middle East & Africa Negative Pressure Wound Therapy Revenue (million) Forecast, by Application 2019 & 2032
- Table 74: Rest of Middle East & Africa Negative Pressure Wound Therapy Volume (K) Forecast, by Application 2019 & 2032
- Table 75: Global Negative Pressure Wound Therapy Revenue million Forecast, by Application 2019 & 2032
- Table 76: Global Negative Pressure Wound Therapy Volume K Forecast, by Application 2019 & 2032
- Table 77: Global Negative Pressure Wound Therapy Revenue million Forecast, by Types 2019 & 2032
- Table 78: Global Negative Pressure Wound Therapy Volume K Forecast, by Types 2019 & 2032
- Table 79: Global Negative Pressure Wound Therapy Revenue million Forecast, by Country 2019 & 2032
- Table 80: Global Negative Pressure Wound Therapy Volume K Forecast, by Country 2019 & 2032
- Table 81: China Negative Pressure Wound Therapy Revenue (million) Forecast, by Application 2019 & 2032
- Table 82: China Negative Pressure Wound Therapy Volume (K) Forecast, by Application 2019 & 2032
- Table 83: India Negative Pressure Wound Therapy Revenue (million) Forecast, by Application 2019 & 2032
- Table 84: India Negative Pressure Wound Therapy Volume (K) Forecast, by Application 2019 & 2032
- Table 85: Japan Negative Pressure Wound Therapy Revenue (million) Forecast, by Application 2019 & 2032
- Table 86: Japan Negative Pressure Wound Therapy Volume (K) Forecast, by Application 2019 & 2032
- Table 87: South Korea Negative Pressure Wound Therapy Revenue (million) Forecast, by Application 2019 & 2032
- Table 88: South Korea Negative Pressure Wound Therapy Volume (K) Forecast, by Application 2019 & 2032
- Table 89: ASEAN Negative Pressure Wound Therapy Revenue (million) Forecast, by Application 2019 & 2032
- Table 90: ASEAN Negative Pressure Wound Therapy Volume (K) Forecast, by Application 2019 & 2032
- Table 91: Oceania Negative Pressure Wound Therapy Revenue (million) Forecast, by Application 2019 & 2032
- Table 92: Oceania Negative Pressure Wound Therapy Volume (K) Forecast, by Application 2019 & 2032
- Table 93: Rest of Asia Pacific Negative Pressure Wound Therapy Revenue (million) Forecast, by Application 2019 & 2032
- Table 94: Rest of Asia Pacific Negative Pressure Wound Therapy Volume (K) Forecast, by Application 2019 & 2032
Frequently Asked Questions
1. What is the projected Compound Annual Growth Rate (CAGR) of the Negative Pressure Wound Therapy?
The projected CAGR is approximately XX%.
2. Which companies are prominent players in the Negative Pressure Wound Therapy?
Key companies in the market include Acelity (KCI), Smith & Nephew, Cardinal Health, Devon, Medela, Triage Meditech, WuHan VSD, Talley Group.
3. What are the main segments of the Negative Pressure Wound Therapy?
The market segments include Application, Types.
4. Can you provide details about the market size?
The market size is estimated to be USD XXX million as of 2022.
5. What are some drivers contributing to market growth?
N/A
6. What are the notable trends driving market growth?
N/A
7. Are there any restraints impacting market growth?
N/A
8. Can you provide examples of recent developments in the market?
N/A
9. What pricing options are available for accessing the report?
Pricing options include single-user, multi-user, and enterprise licenses priced at USD 3350.00, USD 5025.00, and USD 6700.00 respectively.
10. Is the market size provided in terms of value or volume?
The market size is provided in terms of value, measured in million and volume, measured in K.
11. Are there any specific market keywords associated with the report?
Yes, the market keyword associated with the report is "Negative Pressure Wound Therapy," which aids in identifying and referencing the specific market segment covered.
12. How do I determine which pricing option suits my needs best?
The pricing options vary based on user requirements and access needs. Individual users may opt for single-user licenses, while businesses requiring broader access may choose multi-user or enterprise licenses for cost-effective access to the report.
13. Are there any additional resources or data provided in the Negative Pressure Wound Therapy report?
While the report offers comprehensive insights, it's advisable to review the specific contents or supplementary materials provided to ascertain if additional resources or data are available.
14. How can I stay updated on further developments or reports in the Negative Pressure Wound Therapy?
To stay informed about further developments, trends, and reports in the Negative Pressure Wound Therapy, consider subscribing to industry newsletters, following relevant companies and organizations, or regularly checking reputable industry news sources and publications.
Methodology
Step 1 - Identification of Relevant Samples Size from Population Database


Step 2 - Approaches for Defining Global Market Size (Value, Volume* & Price*)

Note*: In applicable scenarios
Step 3 - Data Sources
Primary Research
- Web Analytics
- Survey Reports
- Research Institute
- Latest Research Reports
- Opinion Leaders
Secondary Research
- Annual Reports
- White Paper
- Latest Press Release
- Industry Association
- Paid Database
- Investor Presentations

Step 4 - Data Triangulation
Involves using different sources of information in order to increase the validity of a study
These sources are likely to be stakeholders in a program - participants, other researchers, program staff, other community members, and so on.
Then we put all data in single framework & apply various statistical tools to find out the dynamic on the market.
During the analysis stage, feedback from the stakeholder groups would be compared to determine areas of agreement as well as areas of divergence


