
Key Insights
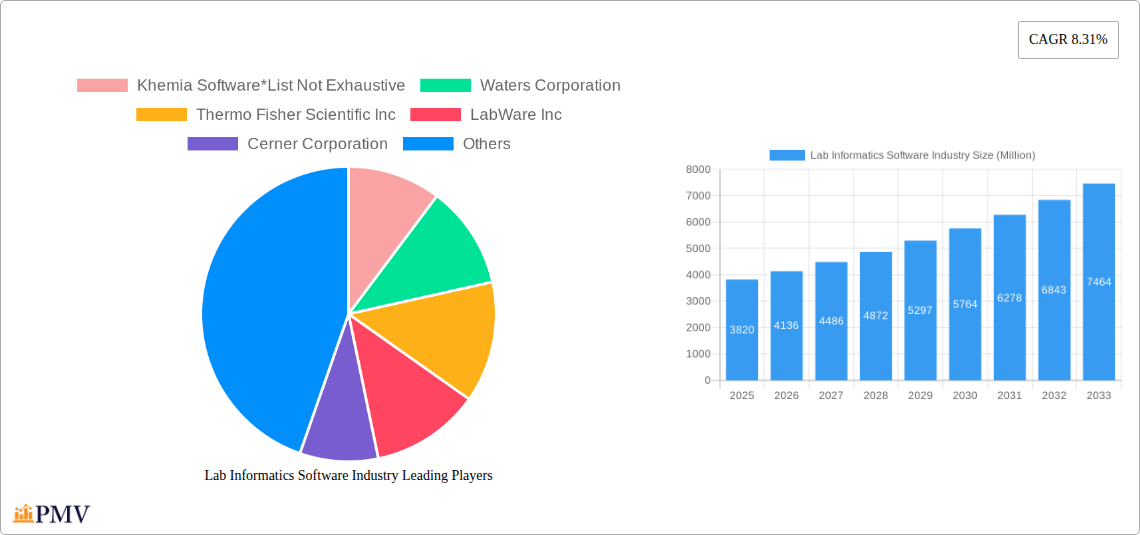
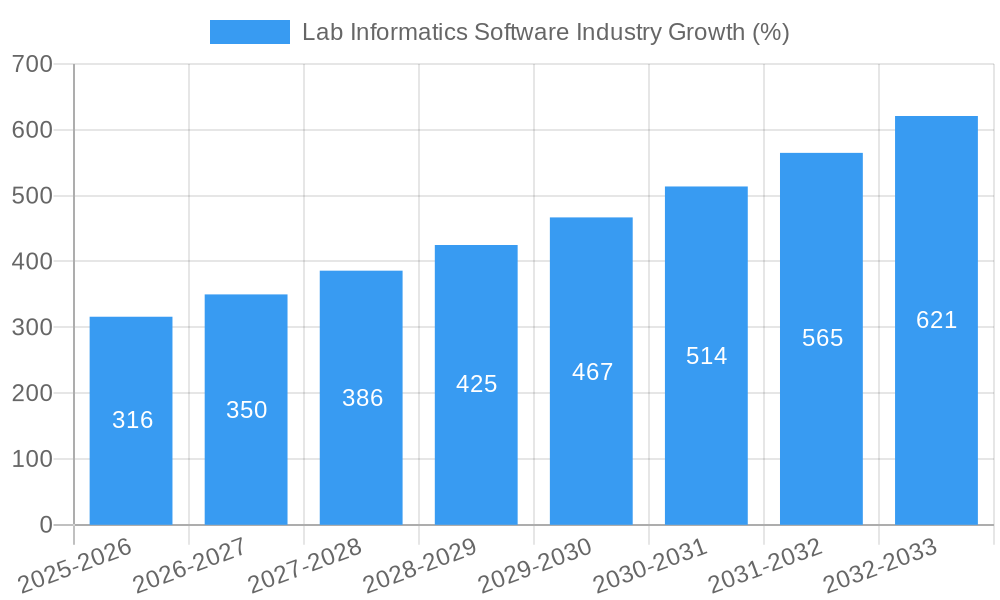
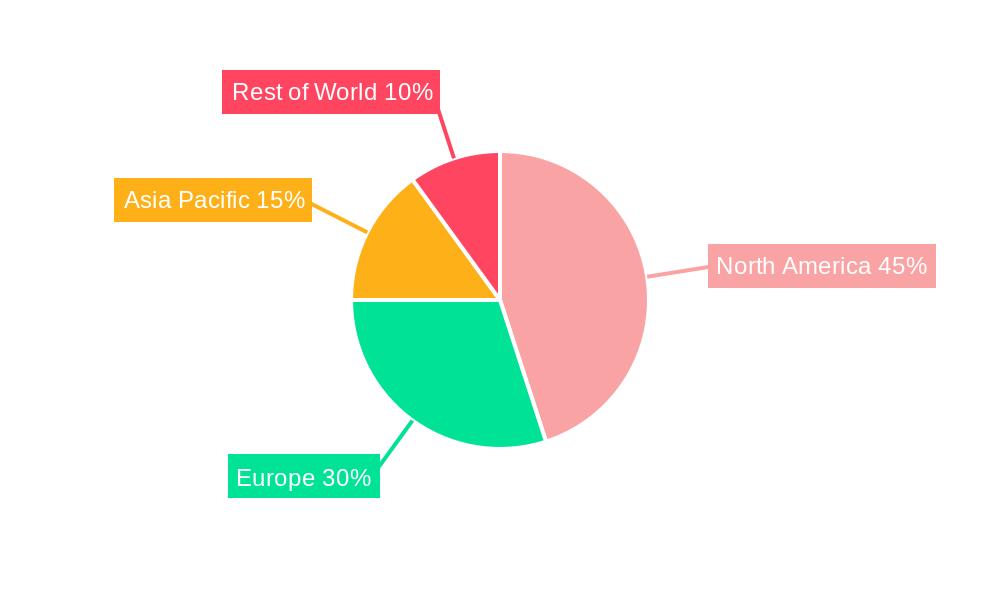
The Lab Informatics Software market, valued at $3.82 billion in 2025, is experiencing robust growth, projected to expand at a compound annual growth rate (CAGR) of 8.31% from 2025 to 2033. This expansion is fueled by several key factors. The increasing demand for efficient data management and analysis within research and development (R&D) laboratories across various industries, including pharmaceuticals, biotechnology, and healthcare, is a primary driver. Furthermore, the growing adoption of cloud-based solutions offers scalability, accessibility, and cost-effectiveness, accelerating market penetration. Stringent regulatory compliance requirements and the need to enhance data integrity are also significant contributing factors. Segmentation reveals a diverse landscape, with LIMS, ELN, and SDMS holding substantial market shares due to their critical role in streamlining laboratory workflows. The services segment, encompassing implementation, training, and maintenance, contributes significantly to the overall market revenue. Geographical distribution shows North America and Europe as currently dominant regions, although the Asia-Pacific market is anticipated to witness significant growth driven by expanding R&D activities and increasing government investments in healthcare infrastructure.
The competitive landscape is characterized by established players like Thermo Fisher Scientific, Waters Corporation, and Agilent Technologies, alongside specialized software providers like LabWare and LabVantage Solutions. These companies are actively engaged in strategic partnerships, acquisitions, and product innovation to maintain a competitive edge. While challenges exist, such as the high initial investment costs associated with some solutions and the need for specialized expertise in implementation, the overall market outlook remains optimistic, driven by ongoing technological advancements, increased automation within laboratories, and a heightened focus on data-driven decision-making in diverse scientific fields. The market's growth trajectory is likely to be influenced by the adoption rates of advanced analytics capabilities integrated within lab informatics platforms, as well as the emergence of innovative solutions tailored to specific industry needs.
Lab Informatics Software Market Report: 2019-2033
This comprehensive report provides a detailed analysis of the Lab Informatics Software market, projecting a market size of $XX Million by 2033. The study period covers 2019-2033, with 2025 as the base and estimated year. The report offers actionable insights into market structure, competitive dynamics, dominant segments, and future growth potential, enabling informed strategic decision-making for businesses operating within this dynamic sector.
Lab Informatics Software Industry Market Structure & Competitive Dynamics
The Lab Informatics Software market is characterized by a moderately concentrated structure, with several major players holding significant market share. Key players such as Waters Corporation, Thermo Fisher Scientific Inc, and LabWare Inc. dominate the landscape, commanding a combined market share of approximately xx%. However, smaller specialized firms like Khemia Software and LabLynx Inc. also play a crucial role, catering to niche segments and fostering innovation.
The market's competitive dynamics are shaped by factors such as technological advancements, regulatory changes, and strategic acquisitions (M&A). Innovation ecosystems, driven by research institutions and startups, contribute to the development of new functionalities and capabilities within LIMS, ELN, and other software segments. Regulatory frameworks, particularly within the healthcare and pharmaceutical sectors, influence product development and market access.
Product substitution is limited; however, competition primarily centers on superior functionalities, integration capabilities, and the overall user experience. End-user trends demonstrate a clear preference towards cloud-based solutions due to scalability and cost-effectiveness.
M&A activity has been relatively moderate in recent years, with deal values averaging $xx Million. Key examples include partnerships, such as the one between CTI Clinical Trial and Consulting Services and LabWare Inc. in 2021. This collaborative approach signifies an emerging trend in expanding market reach and service offerings.
Lab Informatics Software Industry Industry Trends & Insights
The Lab Informatics Software market exhibits robust growth, driven by increasing automation in laboratories, stringent regulatory compliance needs, and the growing demand for data-driven insights across diverse industries. The market is expected to register a Compound Annual Growth Rate (CAGR) of xx% during the forecast period (2025-2033). This growth is fueled by several factors:
- Technological Disruptions: The integration of AI, machine learning, and big data analytics into lab informatics software is revolutionizing data management and analysis, resulting in improved efficiency and enhanced decision-making.
- Consumer Preferences: The shift towards cloud-based and web-hosted solutions reflects a preference for flexible, scalable, and cost-effective solutions. The demand for user-friendly interfaces and seamless integration with existing laboratory instruments is also significant.
- Market Penetration: The market penetration of lab informatics software continues to increase across diverse sectors, including pharmaceuticals, biotechnology, healthcare, and environmental testing. The expanding adoption of these technologies in emerging economies further contributes to market expansion.
- Competitive Dynamics: The competitive landscape remains highly dynamic, with players continuously striving to innovate and improve their offerings. Strategic partnerships and acquisitions are contributing to market consolidation.
Dominant Markets & Segments in Lab Informatics Software Industry
The North American region currently holds the dominant position in the Lab Informatics Software market, driven by strong R&D investments, a large pharmaceutical and biotechnology industry, and a high adoption rate of advanced technologies.
By Product:
- Laboratory Information Management System (LIMS): This segment constitutes the largest portion of the market due to its widespread application across various laboratories. Key drivers include the need for enhanced sample management, data tracking, and workflow optimization.
- Electronic Lab Notebooks (ELN): The ELN segment shows robust growth due to its ability to enhance data integrity and collaborative research.
- Other segments (ECM, LES, CDS, SDMS, EDC, CDMS) also showcase significant growth potential.
By Component:
- Software: This segment holds the largest market share owing to the core functionality it provides.
- Services: The services component (installation, training, support) complements the software, contributing to overall market value.
By Delivery Mode:
- Cloud-based: This segment is experiencing the fastest growth, surpassing on-premise and web-hosted solutions, owing to its scalability, cost-effectiveness, and accessibility. Key drivers include reduced infrastructure costs and improved data security.
Lab Informatics Software Industry Product Innovations
Recent product innovations in the Lab Informatics Software market are focused on enhancing data analysis capabilities, improving interoperability, and integrating advanced technologies like AI and machine learning. New features such as automated data interpretation, predictive modeling, and real-time data visualization are enhancing the value proposition of these solutions. The emphasis on user-friendliness and intuitive interfaces is also driving product development, improving adoption and user satisfaction. This focus on improved functionality and enhanced user experience provides a significant competitive advantage.
Report Segmentation & Scope
This report segments the Lab Informatics Software market by Product (LIMS, ELN, ECM, LES, CDS, SDMS, EDC, CDMS), Component (Software, Services), and Delivery Mode (On-premise, Web-hosted, Cloud-based). Each segment includes a detailed analysis of market size, growth projections, competitive dynamics, and key drivers. The cloud-based segment is projected to experience the fastest growth, while LIMS remains the largest product segment by market value. The service component supports software sales and implementation, complementing the growth trajectory of the software segment.
Key Drivers of Lab Informatics Software Industry Growth
Several factors are driving the growth of the Lab Informatics Software market:
- Increasing demand for enhanced data management and analysis: The need for efficient data management and sophisticated analytical capabilities drives adoption across diverse sectors.
- Stringent regulatory compliance requirements: Strict regulatory compliance within healthcare and pharmaceutical industries necessitate the adoption of validated and auditable software solutions.
- Advancements in technology: The integration of AI, machine learning, and cloud computing enhances the capabilities of lab informatics software, enabling improved efficiency and decision-making.
Challenges in the Lab Informatics Software Industry Sector
The Lab Informatics Software industry faces several challenges:
- High initial investment costs: The implementation of lab informatics software can require significant upfront investment, potentially deterring smaller laboratories.
- Integration complexities: Integrating lab informatics software with existing laboratory instruments and systems can pose significant technical challenges.
- Data security concerns: Ensuring data security and compliance with privacy regulations is crucial, requiring robust security measures.
Leading Players in the Lab Informatics Software Industry Market
- Khemia Software
- Waters Corporation
- Thermo Fisher Scientific Inc
- LabWare Inc
- Cerner Corporation
- Abbott Laboratories (Abbott Informatics Corporation)
- PerkinElmer Inc
- LabVantage Solutions Inc
- McKesson Corporation
- Agilent Technologies
- LabLynx Inc
Key Developments in Lab Informatics Software Industry Sector
- August 2021: CTI Clinical Trial and Consulting Services (CTI) partnered with LabWare, Inc., expanding laboratory services for rare disease and cell & gene therapy research.
- March 2021: LabVantage Solutions, Inc. launched LabVantage Analytics, a self-service advanced analytics solution for LIMS data visualization.
Strategic Lab Informatics Software Industry Market Outlook
The Lab Informatics Software market is poised for continued expansion, driven by technological advancements, increasing demand for data-driven insights, and stringent regulatory requirements. Strategic opportunities lie in developing innovative solutions that integrate advanced technologies such as AI and machine learning, offering enhanced data analysis capabilities and improving interoperability. Focusing on user-friendly interfaces and seamless integration with existing laboratory instruments will be crucial for continued market penetration and growth. The cloud-based segment is expected to lead this growth, offering scalability and cost-effectiveness to a wider range of users.
Lab Informatics Software Industry Segmentation
-
1. Product
- 1.1. Laboratory Information Management System (LIMS)
- 1.2. Electronic Lab Notebooks (ELN)
- 1.3. Enterprise Content Management (ECM)
- 1.4. Laboratory Execution System (LES)
- 1.5. Chromatography Data System (CDS)
- 1.6. Scientific Data Management System (SDMS)
- 1.7. Electron
-
2. Component
- 2.1. Services
- 2.2. Software
-
3. Delivery Mode
- 3.1. On-premise
- 3.2. Web-hosted
- 3.3. Cloud-based
Lab Informatics Software Industry Segmentation By Geography
-
1. North America
- 1.1. United States
- 1.2. Canada
- 1.3. Mexico
-
2. Europe
- 2.1. Germany
- 2.2. United Kingdom
- 2.3. France
- 2.4. Italy
- 2.5. Spain
- 2.6. Rest of Europe
-
3. Asia Pacific
- 3.1. China
- 3.2. Japan
- 3.3. India
- 3.4. Australia
- 3.5. South Korea
- 3.6. Rest of Asia Pacific
-
4. Middle East and Africa
- 4.1. GCC
- 4.2. South Africa
- 4.3. Rest of Middle East and Africa
-
5. South America
- 5.1. Brazil
- 5.2. Argentina
- 5.3. Rest of South America
Lab Informatics Software Industry REPORT HIGHLIGHTS
| Aspects | Details |
|---|---|
| Study Period | 2019-2033 |
| Base Year | 2024 |
| Estimated Year | 2025 |
| Forecast Period | 2025-2033 |
| Historical Period | 2019-2024 |
| Growth Rate | CAGR of 8.31% from 2019-2033 |
| Segmentation |
|
Table of Contents
- 1. Introduction
- 1.1. Research Scope
- 1.2. Market Segmentation
- 1.3. Research Methodology
- 1.4. Definitions and Assumptions
- 2. Executive Summary
- 2.1. Introduction
- 3. Market Dynamics
- 3.1. Introduction
- 3.2. Market Drivers
- 3.2.1. High Accuracy and Efficiency of Results; Increasing Applications of Lab Informatics Solutions; Increasing Number of Diagnoses
- 3.3. Market Restrains
- 3.3.1. Lack of Integration Standards for Laboratory Informatics; Lack of Skilled Professionals
- 3.4. Market Trends
- 3.4.1. Laboratory Information Management System is Expected to Hold its Highest Market Share in the Product
- 4. Market Factor Analysis
- 4.1. Porters Five Forces
- 4.2. Supply/Value Chain
- 4.3. PESTEL analysis
- 4.4. Market Entropy
- 4.5. Patent/Trademark Analysis
- 5. Global Lab Informatics Software Industry Analysis, Insights and Forecast, 2019-2031
- 5.1. Market Analysis, Insights and Forecast - by Product
- 5.1.1. Laboratory Information Management System (LIMS)
- 5.1.2. Electronic Lab Notebooks (ELN)
- 5.1.3. Enterprise Content Management (ECM)
- 5.1.4. Laboratory Execution System (LES)
- 5.1.5. Chromatography Data System (CDS)
- 5.1.6. Scientific Data Management System (SDMS)
- 5.1.7. Electron
- 5.2. Market Analysis, Insights and Forecast - by Component
- 5.2.1. Services
- 5.2.2. Software
- 5.3. Market Analysis, Insights and Forecast - by Delivery Mode
- 5.3.1. On-premise
- 5.3.2. Web-hosted
- 5.3.3. Cloud-based
- 5.4. Market Analysis, Insights and Forecast - by Region
- 5.4.1. North America
- 5.4.2. Europe
- 5.4.3. Asia Pacific
- 5.4.4. Middle East and Africa
- 5.4.5. South America
- 5.1. Market Analysis, Insights and Forecast - by Product
- 6. North America Lab Informatics Software Industry Analysis, Insights and Forecast, 2019-2031
- 6.1. Market Analysis, Insights and Forecast - by Product
- 6.1.1. Laboratory Information Management System (LIMS)
- 6.1.2. Electronic Lab Notebooks (ELN)
- 6.1.3. Enterprise Content Management (ECM)
- 6.1.4. Laboratory Execution System (LES)
- 6.1.5. Chromatography Data System (CDS)
- 6.1.6. Scientific Data Management System (SDMS)
- 6.1.7. Electron
- 6.2. Market Analysis, Insights and Forecast - by Component
- 6.2.1. Services
- 6.2.2. Software
- 6.3. Market Analysis, Insights and Forecast - by Delivery Mode
- 6.3.1. On-premise
- 6.3.2. Web-hosted
- 6.3.3. Cloud-based
- 6.1. Market Analysis, Insights and Forecast - by Product
- 7. Europe Lab Informatics Software Industry Analysis, Insights and Forecast, 2019-2031
- 7.1. Market Analysis, Insights and Forecast - by Product
- 7.1.1. Laboratory Information Management System (LIMS)
- 7.1.2. Electronic Lab Notebooks (ELN)
- 7.1.3. Enterprise Content Management (ECM)
- 7.1.4. Laboratory Execution System (LES)
- 7.1.5. Chromatography Data System (CDS)
- 7.1.6. Scientific Data Management System (SDMS)
- 7.1.7. Electron
- 7.2. Market Analysis, Insights and Forecast - by Component
- 7.2.1. Services
- 7.2.2. Software
- 7.3. Market Analysis, Insights and Forecast - by Delivery Mode
- 7.3.1. On-premise
- 7.3.2. Web-hosted
- 7.3.3. Cloud-based
- 7.1. Market Analysis, Insights and Forecast - by Product
- 8. Asia Pacific Lab Informatics Software Industry Analysis, Insights and Forecast, 2019-2031
- 8.1. Market Analysis, Insights and Forecast - by Product
- 8.1.1. Laboratory Information Management System (LIMS)
- 8.1.2. Electronic Lab Notebooks (ELN)
- 8.1.3. Enterprise Content Management (ECM)
- 8.1.4. Laboratory Execution System (LES)
- 8.1.5. Chromatography Data System (CDS)
- 8.1.6. Scientific Data Management System (SDMS)
- 8.1.7. Electron
- 8.2. Market Analysis, Insights and Forecast - by Component
- 8.2.1. Services
- 8.2.2. Software
- 8.3. Market Analysis, Insights and Forecast - by Delivery Mode
- 8.3.1. On-premise
- 8.3.2. Web-hosted
- 8.3.3. Cloud-based
- 8.1. Market Analysis, Insights and Forecast - by Product
- 9. Middle East and Africa Lab Informatics Software Industry Analysis, Insights and Forecast, 2019-2031
- 9.1. Market Analysis, Insights and Forecast - by Product
- 9.1.1. Laboratory Information Management System (LIMS)
- 9.1.2. Electronic Lab Notebooks (ELN)
- 9.1.3. Enterprise Content Management (ECM)
- 9.1.4. Laboratory Execution System (LES)
- 9.1.5. Chromatography Data System (CDS)
- 9.1.6. Scientific Data Management System (SDMS)
- 9.1.7. Electron
- 9.2. Market Analysis, Insights and Forecast - by Component
- 9.2.1. Services
- 9.2.2. Software
- 9.3. Market Analysis, Insights and Forecast - by Delivery Mode
- 9.3.1. On-premise
- 9.3.2. Web-hosted
- 9.3.3. Cloud-based
- 9.1. Market Analysis, Insights and Forecast - by Product
- 10. South America Lab Informatics Software Industry Analysis, Insights and Forecast, 2019-2031
- 10.1. Market Analysis, Insights and Forecast - by Product
- 10.1.1. Laboratory Information Management System (LIMS)
- 10.1.2. Electronic Lab Notebooks (ELN)
- 10.1.3. Enterprise Content Management (ECM)
- 10.1.4. Laboratory Execution System (LES)
- 10.1.5. Chromatography Data System (CDS)
- 10.1.6. Scientific Data Management System (SDMS)
- 10.1.7. Electron
- 10.2. Market Analysis, Insights and Forecast - by Component
- 10.2.1. Services
- 10.2.2. Software
- 10.3. Market Analysis, Insights and Forecast - by Delivery Mode
- 10.3.1. On-premise
- 10.3.2. Web-hosted
- 10.3.3. Cloud-based
- 10.1. Market Analysis, Insights and Forecast - by Product
- 11. North Americ Lab Informatics Software Industry Analysis, Insights and Forecast, 2019-2031
- 11.1. Market Analysis, Insights and Forecast - By Country/Sub-region
- 11.1.1 United States
- 11.1.2 Canada
- 11.1.3 Mexico
- 12. South America Lab Informatics Software Industry Analysis, Insights and Forecast, 2019-2031
- 12.1. Market Analysis, Insights and Forecast - By Country/Sub-region
- 12.1.1 Brazil
- 12.1.2 Mexico
- 12.1.3 Rest of South America
- 13. Europe Lab Informatics Software Industry Analysis, Insights and Forecast, 2019-2031
- 13.1. Market Analysis, Insights and Forecast - By Country/Sub-region
- 13.1.1 Germany
- 13.1.2 United Kingdom
- 13.1.3 France
- 13.1.4 Italy
- 13.1.5 Spain
- 13.1.6 Rest of Europe
- 14. Asia Pacific Lab Informatics Software Industry Analysis, Insights and Forecast, 2019-2031
- 14.1. Market Analysis, Insights and Forecast - By Country/Sub-region
- 14.1.1 China
- 14.1.2 Japan
- 14.1.3 India
- 14.1.4 South Korea
- 14.1.5 Taiwan
- 14.1.6 Australia
- 14.1.7 Rest of Asia-Pacific
- 15. MEA Lab Informatics Software Industry Analysis, Insights and Forecast, 2019-2031
- 15.1. Market Analysis, Insights and Forecast - By Country/Sub-region
- 15.1.1 Middle East
- 15.1.2 Africa
- 16. Competitive Analysis
- 16.1. Global Market Share Analysis 2024
- 16.2. Company Profiles
- 16.2.1 Khemia Software*List Not Exhaustive
- 16.2.1.1. Overview
- 16.2.1.2. Products
- 16.2.1.3. SWOT Analysis
- 16.2.1.4. Recent Developments
- 16.2.1.5. Financials (Based on Availability)
- 16.2.2 Waters Corporation
- 16.2.2.1. Overview
- 16.2.2.2. Products
- 16.2.2.3. SWOT Analysis
- 16.2.2.4. Recent Developments
- 16.2.2.5. Financials (Based on Availability)
- 16.2.3 Thermo Fisher Scientific Inc
- 16.2.3.1. Overview
- 16.2.3.2. Products
- 16.2.3.3. SWOT Analysis
- 16.2.3.4. Recent Developments
- 16.2.3.5. Financials (Based on Availability)
- 16.2.4 LabWare Inc
- 16.2.4.1. Overview
- 16.2.4.2. Products
- 16.2.4.3. SWOT Analysis
- 16.2.4.4. Recent Developments
- 16.2.4.5. Financials (Based on Availability)
- 16.2.5 Cerner Corporation
- 16.2.5.1. Overview
- 16.2.5.2. Products
- 16.2.5.3. SWOT Analysis
- 16.2.5.4. Recent Developments
- 16.2.5.5. Financials (Based on Availability)
- 16.2.6 Abbott Laboratories (Abbott Informatics Corporation)
- 16.2.6.1. Overview
- 16.2.6.2. Products
- 16.2.6.3. SWOT Analysis
- 16.2.6.4. Recent Developments
- 16.2.6.5. Financials (Based on Availability)
- 16.2.7 PerkinElmer Inc
- 16.2.7.1. Overview
- 16.2.7.2. Products
- 16.2.7.3. SWOT Analysis
- 16.2.7.4. Recent Developments
- 16.2.7.5. Financials (Based on Availability)
- 16.2.8 LabVantage Solutions Inc
- 16.2.8.1. Overview
- 16.2.8.2. Products
- 16.2.8.3. SWOT Analysis
- 16.2.8.4. Recent Developments
- 16.2.8.5. Financials (Based on Availability)
- 16.2.9 McKesson Corporation
- 16.2.9.1. Overview
- 16.2.9.2. Products
- 16.2.9.3. SWOT Analysis
- 16.2.9.4. Recent Developments
- 16.2.9.5. Financials (Based on Availability)
- 16.2.10 Agilent Technologies
- 16.2.10.1. Overview
- 16.2.10.2. Products
- 16.2.10.3. SWOT Analysis
- 16.2.10.4. Recent Developments
- 16.2.10.5. Financials (Based on Availability)
- 16.2.11 LabLynx Inc
- 16.2.11.1. Overview
- 16.2.11.2. Products
- 16.2.11.3. SWOT Analysis
- 16.2.11.4. Recent Developments
- 16.2.11.5. Financials (Based on Availability)
- 16.2.1 Khemia Software*List Not Exhaustive
List of Figures
- Figure 1: Global Lab Informatics Software Industry Revenue Breakdown (Million, %) by Region 2024 & 2032
- Figure 2: North Americ Lab Informatics Software Industry Revenue (Million), by Country 2024 & 2032
- Figure 3: North Americ Lab Informatics Software Industry Revenue Share (%), by Country 2024 & 2032
- Figure 4: South America Lab Informatics Software Industry Revenue (Million), by Country 2024 & 2032
- Figure 5: South America Lab Informatics Software Industry Revenue Share (%), by Country 2024 & 2032
- Figure 6: Europe Lab Informatics Software Industry Revenue (Million), by Country 2024 & 2032
- Figure 7: Europe Lab Informatics Software Industry Revenue Share (%), by Country 2024 & 2032
- Figure 8: Asia Pacific Lab Informatics Software Industry Revenue (Million), by Country 2024 & 2032
- Figure 9: Asia Pacific Lab Informatics Software Industry Revenue Share (%), by Country 2024 & 2032
- Figure 10: MEA Lab Informatics Software Industry Revenue (Million), by Country 2024 & 2032
- Figure 11: MEA Lab Informatics Software Industry Revenue Share (%), by Country 2024 & 2032
- Figure 12: North America Lab Informatics Software Industry Revenue (Million), by Product 2024 & 2032
- Figure 13: North America Lab Informatics Software Industry Revenue Share (%), by Product 2024 & 2032
- Figure 14: North America Lab Informatics Software Industry Revenue (Million), by Component 2024 & 2032
- Figure 15: North America Lab Informatics Software Industry Revenue Share (%), by Component 2024 & 2032
- Figure 16: North America Lab Informatics Software Industry Revenue (Million), by Delivery Mode 2024 & 2032
- Figure 17: North America Lab Informatics Software Industry Revenue Share (%), by Delivery Mode 2024 & 2032
- Figure 18: North America Lab Informatics Software Industry Revenue (Million), by Country 2024 & 2032
- Figure 19: North America Lab Informatics Software Industry Revenue Share (%), by Country 2024 & 2032
- Figure 20: Europe Lab Informatics Software Industry Revenue (Million), by Product 2024 & 2032
- Figure 21: Europe Lab Informatics Software Industry Revenue Share (%), by Product 2024 & 2032
- Figure 22: Europe Lab Informatics Software Industry Revenue (Million), by Component 2024 & 2032
- Figure 23: Europe Lab Informatics Software Industry Revenue Share (%), by Component 2024 & 2032
- Figure 24: Europe Lab Informatics Software Industry Revenue (Million), by Delivery Mode 2024 & 2032
- Figure 25: Europe Lab Informatics Software Industry Revenue Share (%), by Delivery Mode 2024 & 2032
- Figure 26: Europe Lab Informatics Software Industry Revenue (Million), by Country 2024 & 2032
- Figure 27: Europe Lab Informatics Software Industry Revenue Share (%), by Country 2024 & 2032
- Figure 28: Asia Pacific Lab Informatics Software Industry Revenue (Million), by Product 2024 & 2032
- Figure 29: Asia Pacific Lab Informatics Software Industry Revenue Share (%), by Product 2024 & 2032
- Figure 30: Asia Pacific Lab Informatics Software Industry Revenue (Million), by Component 2024 & 2032
- Figure 31: Asia Pacific Lab Informatics Software Industry Revenue Share (%), by Component 2024 & 2032
- Figure 32: Asia Pacific Lab Informatics Software Industry Revenue (Million), by Delivery Mode 2024 & 2032
- Figure 33: Asia Pacific Lab Informatics Software Industry Revenue Share (%), by Delivery Mode 2024 & 2032
- Figure 34: Asia Pacific Lab Informatics Software Industry Revenue (Million), by Country 2024 & 2032
- Figure 35: Asia Pacific Lab Informatics Software Industry Revenue Share (%), by Country 2024 & 2032
- Figure 36: Middle East and Africa Lab Informatics Software Industry Revenue (Million), by Product 2024 & 2032
- Figure 37: Middle East and Africa Lab Informatics Software Industry Revenue Share (%), by Product 2024 & 2032
- Figure 38: Middle East and Africa Lab Informatics Software Industry Revenue (Million), by Component 2024 & 2032
- Figure 39: Middle East and Africa Lab Informatics Software Industry Revenue Share (%), by Component 2024 & 2032
- Figure 40: Middle East and Africa Lab Informatics Software Industry Revenue (Million), by Delivery Mode 2024 & 2032
- Figure 41: Middle East and Africa Lab Informatics Software Industry Revenue Share (%), by Delivery Mode 2024 & 2032
- Figure 42: Middle East and Africa Lab Informatics Software Industry Revenue (Million), by Country 2024 & 2032
- Figure 43: Middle East and Africa Lab Informatics Software Industry Revenue Share (%), by Country 2024 & 2032
- Figure 44: South America Lab Informatics Software Industry Revenue (Million), by Product 2024 & 2032
- Figure 45: South America Lab Informatics Software Industry Revenue Share (%), by Product 2024 & 2032
- Figure 46: South America Lab Informatics Software Industry Revenue (Million), by Component 2024 & 2032
- Figure 47: South America Lab Informatics Software Industry Revenue Share (%), by Component 2024 & 2032
- Figure 48: South America Lab Informatics Software Industry Revenue (Million), by Delivery Mode 2024 & 2032
- Figure 49: South America Lab Informatics Software Industry Revenue Share (%), by Delivery Mode 2024 & 2032
- Figure 50: South America Lab Informatics Software Industry Revenue (Million), by Country 2024 & 2032
- Figure 51: South America Lab Informatics Software Industry Revenue Share (%), by Country 2024 & 2032
List of Tables
- Table 1: Global Lab Informatics Software Industry Revenue Million Forecast, by Region 2019 & 2032
- Table 2: Global Lab Informatics Software Industry Revenue Million Forecast, by Product 2019 & 2032
- Table 3: Global Lab Informatics Software Industry Revenue Million Forecast, by Component 2019 & 2032
- Table 4: Global Lab Informatics Software Industry Revenue Million Forecast, by Delivery Mode 2019 & 2032
- Table 5: Global Lab Informatics Software Industry Revenue Million Forecast, by Region 2019 & 2032
- Table 6: Global Lab Informatics Software Industry Revenue Million Forecast, by Country 2019 & 2032
- Table 7: United States Lab Informatics Software Industry Revenue (Million) Forecast, by Application 2019 & 2032
- Table 8: Canada Lab Informatics Software Industry Revenue (Million) Forecast, by Application 2019 & 2032
- Table 9: Mexico Lab Informatics Software Industry Revenue (Million) Forecast, by Application 2019 & 2032
- Table 10: Global Lab Informatics Software Industry Revenue Million Forecast, by Country 2019 & 2032
- Table 11: Brazil Lab Informatics Software Industry Revenue (Million) Forecast, by Application 2019 & 2032
- Table 12: Mexico Lab Informatics Software Industry Revenue (Million) Forecast, by Application 2019 & 2032
- Table 13: Rest of South America Lab Informatics Software Industry Revenue (Million) Forecast, by Application 2019 & 2032
- Table 14: Global Lab Informatics Software Industry Revenue Million Forecast, by Country 2019 & 2032
- Table 15: Germany Lab Informatics Software Industry Revenue (Million) Forecast, by Application 2019 & 2032
- Table 16: United Kingdom Lab Informatics Software Industry Revenue (Million) Forecast, by Application 2019 & 2032
- Table 17: France Lab Informatics Software Industry Revenue (Million) Forecast, by Application 2019 & 2032
- Table 18: Italy Lab Informatics Software Industry Revenue (Million) Forecast, by Application 2019 & 2032
- Table 19: Spain Lab Informatics Software Industry Revenue (Million) Forecast, by Application 2019 & 2032
- Table 20: Rest of Europe Lab Informatics Software Industry Revenue (Million) Forecast, by Application 2019 & 2032
- Table 21: Global Lab Informatics Software Industry Revenue Million Forecast, by Country 2019 & 2032
- Table 22: China Lab Informatics Software Industry Revenue (Million) Forecast, by Application 2019 & 2032
- Table 23: Japan Lab Informatics Software Industry Revenue (Million) Forecast, by Application 2019 & 2032
- Table 24: India Lab Informatics Software Industry Revenue (Million) Forecast, by Application 2019 & 2032
- Table 25: South Korea Lab Informatics Software Industry Revenue (Million) Forecast, by Application 2019 & 2032
- Table 26: Taiwan Lab Informatics Software Industry Revenue (Million) Forecast, by Application 2019 & 2032
- Table 27: Australia Lab Informatics Software Industry Revenue (Million) Forecast, by Application 2019 & 2032
- Table 28: Rest of Asia-Pacific Lab Informatics Software Industry Revenue (Million) Forecast, by Application 2019 & 2032
- Table 29: Global Lab Informatics Software Industry Revenue Million Forecast, by Country 2019 & 2032
- Table 30: Middle East Lab Informatics Software Industry Revenue (Million) Forecast, by Application 2019 & 2032
- Table 31: Africa Lab Informatics Software Industry Revenue (Million) Forecast, by Application 2019 & 2032
- Table 32: Global Lab Informatics Software Industry Revenue Million Forecast, by Product 2019 & 2032
- Table 33: Global Lab Informatics Software Industry Revenue Million Forecast, by Component 2019 & 2032
- Table 34: Global Lab Informatics Software Industry Revenue Million Forecast, by Delivery Mode 2019 & 2032
- Table 35: Global Lab Informatics Software Industry Revenue Million Forecast, by Country 2019 & 2032
- Table 36: United States Lab Informatics Software Industry Revenue (Million) Forecast, by Application 2019 & 2032
- Table 37: Canada Lab Informatics Software Industry Revenue (Million) Forecast, by Application 2019 & 2032
- Table 38: Mexico Lab Informatics Software Industry Revenue (Million) Forecast, by Application 2019 & 2032
- Table 39: Global Lab Informatics Software Industry Revenue Million Forecast, by Product 2019 & 2032
- Table 40: Global Lab Informatics Software Industry Revenue Million Forecast, by Component 2019 & 2032
- Table 41: Global Lab Informatics Software Industry Revenue Million Forecast, by Delivery Mode 2019 & 2032
- Table 42: Global Lab Informatics Software Industry Revenue Million Forecast, by Country 2019 & 2032
- Table 43: Germany Lab Informatics Software Industry Revenue (Million) Forecast, by Application 2019 & 2032
- Table 44: United Kingdom Lab Informatics Software Industry Revenue (Million) Forecast, by Application 2019 & 2032
- Table 45: France Lab Informatics Software Industry Revenue (Million) Forecast, by Application 2019 & 2032
- Table 46: Italy Lab Informatics Software Industry Revenue (Million) Forecast, by Application 2019 & 2032
- Table 47: Spain Lab Informatics Software Industry Revenue (Million) Forecast, by Application 2019 & 2032
- Table 48: Rest of Europe Lab Informatics Software Industry Revenue (Million) Forecast, by Application 2019 & 2032
- Table 49: Global Lab Informatics Software Industry Revenue Million Forecast, by Product 2019 & 2032
- Table 50: Global Lab Informatics Software Industry Revenue Million Forecast, by Component 2019 & 2032
- Table 51: Global Lab Informatics Software Industry Revenue Million Forecast, by Delivery Mode 2019 & 2032
- Table 52: Global Lab Informatics Software Industry Revenue Million Forecast, by Country 2019 & 2032
- Table 53: China Lab Informatics Software Industry Revenue (Million) Forecast, by Application 2019 & 2032
- Table 54: Japan Lab Informatics Software Industry Revenue (Million) Forecast, by Application 2019 & 2032
- Table 55: India Lab Informatics Software Industry Revenue (Million) Forecast, by Application 2019 & 2032
- Table 56: Australia Lab Informatics Software Industry Revenue (Million) Forecast, by Application 2019 & 2032
- Table 57: South Korea Lab Informatics Software Industry Revenue (Million) Forecast, by Application 2019 & 2032
- Table 58: Rest of Asia Pacific Lab Informatics Software Industry Revenue (Million) Forecast, by Application 2019 & 2032
- Table 59: Global Lab Informatics Software Industry Revenue Million Forecast, by Product 2019 & 2032
- Table 60: Global Lab Informatics Software Industry Revenue Million Forecast, by Component 2019 & 2032
- Table 61: Global Lab Informatics Software Industry Revenue Million Forecast, by Delivery Mode 2019 & 2032
- Table 62: Global Lab Informatics Software Industry Revenue Million Forecast, by Country 2019 & 2032
- Table 63: GCC Lab Informatics Software Industry Revenue (Million) Forecast, by Application 2019 & 2032
- Table 64: South Africa Lab Informatics Software Industry Revenue (Million) Forecast, by Application 2019 & 2032
- Table 65: Rest of Middle East and Africa Lab Informatics Software Industry Revenue (Million) Forecast, by Application 2019 & 2032
- Table 66: Global Lab Informatics Software Industry Revenue Million Forecast, by Product 2019 & 2032
- Table 67: Global Lab Informatics Software Industry Revenue Million Forecast, by Component 2019 & 2032
- Table 68: Global Lab Informatics Software Industry Revenue Million Forecast, by Delivery Mode 2019 & 2032
- Table 69: Global Lab Informatics Software Industry Revenue Million Forecast, by Country 2019 & 2032
- Table 70: Brazil Lab Informatics Software Industry Revenue (Million) Forecast, by Application 2019 & 2032
- Table 71: Argentina Lab Informatics Software Industry Revenue (Million) Forecast, by Application 2019 & 2032
- Table 72: Rest of South America Lab Informatics Software Industry Revenue (Million) Forecast, by Application 2019 & 2032
Frequently Asked Questions
1. What is the projected Compound Annual Growth Rate (CAGR) of the Lab Informatics Software Industry?
The projected CAGR is approximately 8.31%.
2. Which companies are prominent players in the Lab Informatics Software Industry?
Key companies in the market include Khemia Software*List Not Exhaustive, Waters Corporation, Thermo Fisher Scientific Inc, LabWare Inc, Cerner Corporation, Abbott Laboratories (Abbott Informatics Corporation), PerkinElmer Inc, LabVantage Solutions Inc, McKesson Corporation, Agilent Technologies, LabLynx Inc.
3. What are the main segments of the Lab Informatics Software Industry?
The market segments include Product, Component, Delivery Mode.
4. Can you provide details about the market size?
The market size is estimated to be USD 3.82 Million as of 2022.
5. What are some drivers contributing to market growth?
High Accuracy and Efficiency of Results; Increasing Applications of Lab Informatics Solutions; Increasing Number of Diagnoses.
6. What are the notable trends driving market growth?
Laboratory Information Management System is Expected to Hold its Highest Market Share in the Product.
7. Are there any restraints impacting market growth?
Lack of Integration Standards for Laboratory Informatics; Lack of Skilled Professionals.
8. Can you provide examples of recent developments in the market?
In August 2021, CTI Clinical Trial and Consulting Services (CTI) entered into a partnership with LabWare, Inc. to expand laboratory services to support rare disease and cell & gene therapy research across all regions of the world.
9. What pricing options are available for accessing the report?
Pricing options include single-user, multi-user, and enterprise licenses priced at USD 4750, USD 5250, and USD 8750 respectively.
10. Is the market size provided in terms of value or volume?
The market size is provided in terms of value, measured in Million.
11. Are there any specific market keywords associated with the report?
Yes, the market keyword associated with the report is "Lab Informatics Software Industry," which aids in identifying and referencing the specific market segment covered.
12. How do I determine which pricing option suits my needs best?
The pricing options vary based on user requirements and access needs. Individual users may opt for single-user licenses, while businesses requiring broader access may choose multi-user or enterprise licenses for cost-effective access to the report.
13. Are there any additional resources or data provided in the Lab Informatics Software Industry report?
While the report offers comprehensive insights, it's advisable to review the specific contents or supplementary materials provided to ascertain if additional resources or data are available.
14. How can I stay updated on further developments or reports in the Lab Informatics Software Industry?
To stay informed about further developments, trends, and reports in the Lab Informatics Software Industry, consider subscribing to industry newsletters, following relevant companies and organizations, or regularly checking reputable industry news sources and publications.
Methodology
Step 1 - Identification of Relevant Samples Size from Population Database


Step 2 - Approaches for Defining Global Market Size (Value, Volume* & Price*)

Note*: In applicable scenarios
Step 3 - Data Sources
Primary Research
- Web Analytics
- Survey Reports
- Research Institute
- Latest Research Reports
- Opinion Leaders
Secondary Research
- Annual Reports
- White Paper
- Latest Press Release
- Industry Association
- Paid Database
- Investor Presentations

Step 4 - Data Triangulation
Involves using different sources of information in order to increase the validity of a study
These sources are likely to be stakeholders in a program - participants, other researchers, program staff, other community members, and so on.
Then we put all data in single framework & apply various statistical tools to find out the dynamic on the market.
During the analysis stage, feedback from the stakeholder groups would be compared to determine areas of agreement as well as areas of divergence


