
Key Insights
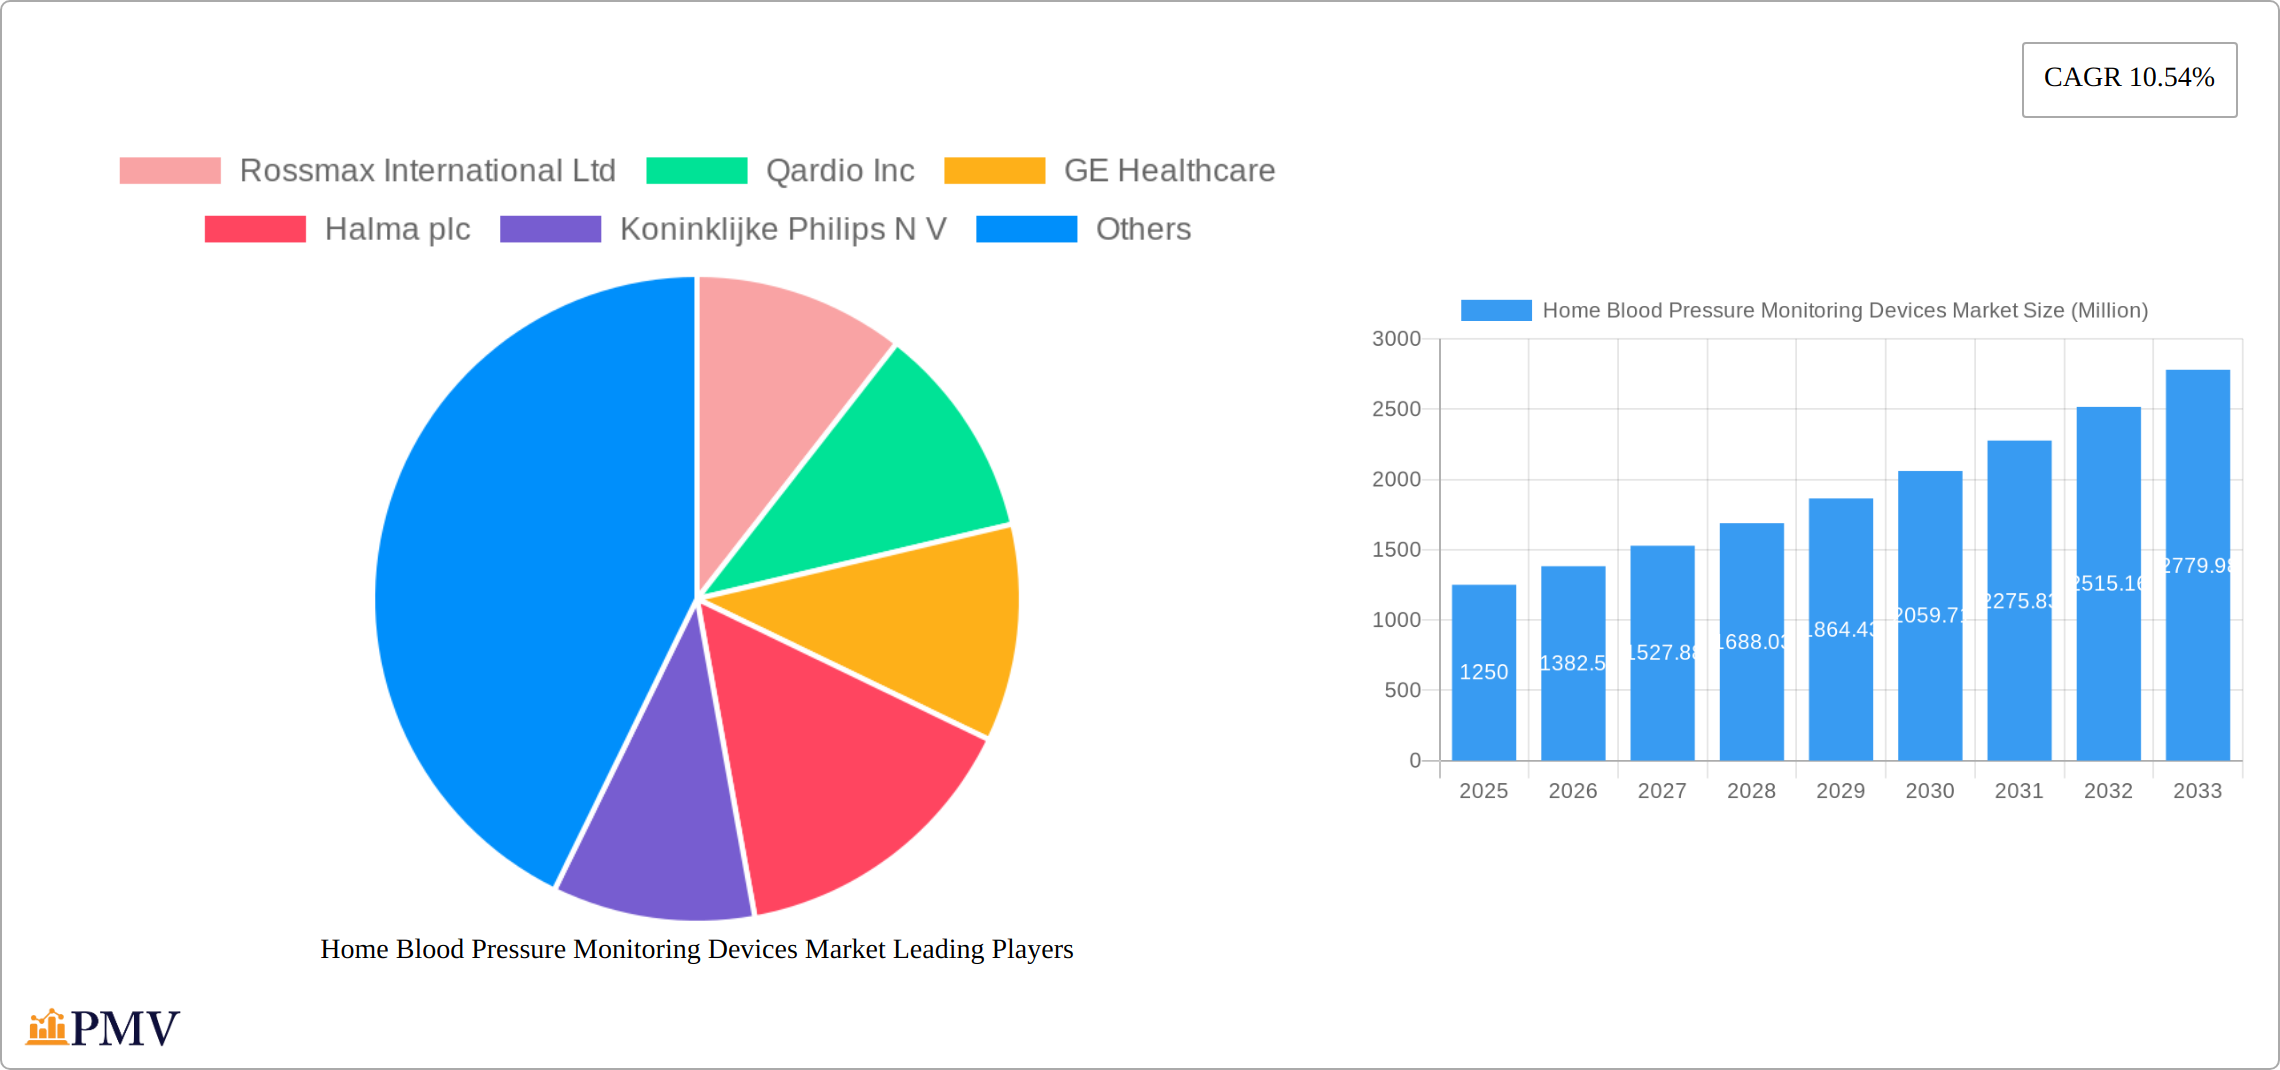
The global Home Blood Pressure Monitoring Devices market is experiencing robust growth, projected to reach a market size of $1.25 billion in 2025 and maintain a Compound Annual Growth Rate (CAGR) of 10.54% from 2025 to 2033. This expansion is driven by several key factors. The rising prevalence of hypertension and cardiovascular diseases globally necessitates increased self-monitoring and early detection. Technological advancements are also contributing significantly, with the introduction of more accurate, user-friendly, and connected devices. The growing adoption of telehealth and remote patient monitoring further fuels market growth, enabling better patient management and reducing healthcare costs. Consumer preference for convenient, at-home monitoring solutions, rather than frequent clinic visits, is also a significant driver. The market segmentation reveals strong demand across various product types, including upper arm monitors (likely the dominant segment due to established accuracy), wrist monitors (gaining popularity for convenience), and associated accessories like carrying cases and cuff replacements. Distribution channels are diverse, encompassing hospital pharmacies, online pharmacies, and other retailers, reflecting the accessibility and growing online presence of these devices. Leading companies, including Rossmax International Ltd, Omron Healthcare Inc., and Philips, are actively shaping the market through innovation and expansion strategies.
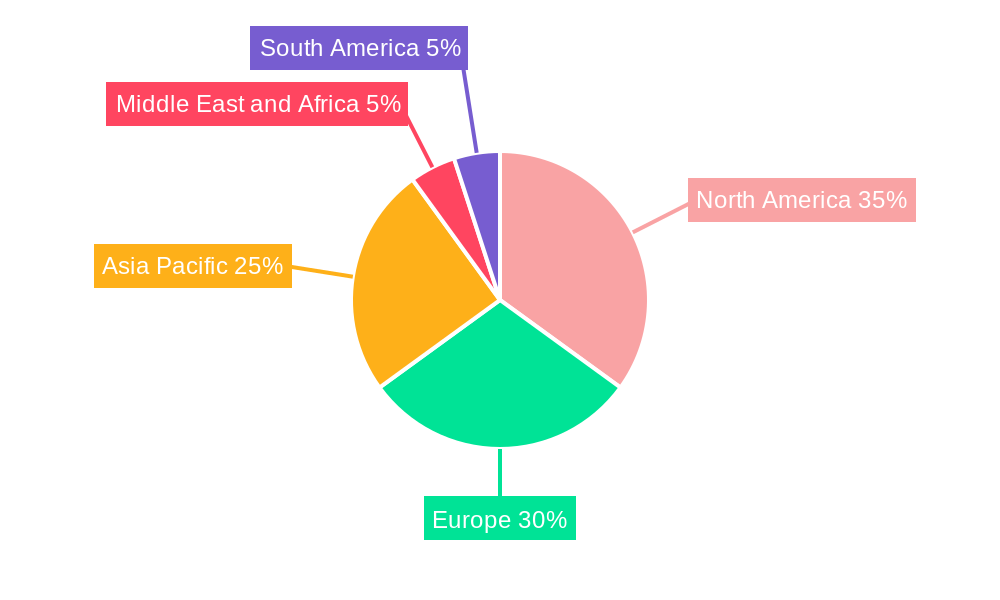
The market's geographical distribution indicates substantial opportunities across various regions. North America and Europe are expected to hold significant market shares due to established healthcare infrastructure and higher adoption rates of advanced healthcare technologies. However, the Asia-Pacific region, particularly China and India, presents a high-growth potential given the expanding population base and increasing awareness of preventive healthcare. While challenges such as inaccurate readings from certain devices and the high initial investment cost for advanced features may pose some restraints, the overall market outlook remains positive, fueled by ongoing technological improvements, increased healthcare awareness, and rising demand for accessible, affordable home healthcare solutions. The forecast suggests substantial market expansion through 2033, with significant opportunities for market players to capitalize on the increasing demand for convenient and effective blood pressure monitoring devices.
Home Blood Pressure Monitoring Devices Market: A Comprehensive Market Research Report (2019-2033)
This comprehensive report provides a detailed analysis of the global Home Blood Pressure Monitoring Devices Market, offering invaluable insights for stakeholders across the healthcare industry. Covering the period from 2019 to 2033, with a base year of 2025 and a forecast period of 2025-2033, this report offers a meticulous examination of market dynamics, competitive landscapes, and future growth prospects. The market is valued at xx Million in 2025 and is projected to reach xx Million by 2033, exhibiting a CAGR of xx%.
Home Blood Pressure Monitoring Devices Market Market Structure & Competitive Dynamics
The Home Blood Pressure Monitoring Devices market exhibits a moderately concentrated structure, with key players holding significant market share. The market is characterized by intense competition driven by innovation in device technology, pricing strategies, and distribution networks. Regulatory frameworks, particularly concerning medical device approvals and data privacy, play a significant role in shaping market dynamics. Product substitutes, such as telehealth services and wearable health trackers with blood pressure monitoring capabilities, are emerging and impacting market growth. End-user trends, such as increasing adoption of self-monitoring and remote patient management, fuel market expansion. Mergers and acquisitions (M&A) activities are relatively frequent, with deal values varying significantly depending on the size and strategic importance of the acquired entity. For instance, a recent M&A deal valued at xx Million involved the acquisition of Company X by Company Y, aimed at expanding the product portfolio and market reach. Market share data for key players is shown below:
- Omron Healthcare Inc: xx%
- Philips: xx%
- A&D Medical: xx%
- Rossmax International Ltd: xx%
- Others: xx%
Home Blood Pressure Monitoring Devices Market Industry Trends & Insights
The global Home Blood Pressure Monitoring Devices market is experiencing robust expansion, propelled by the escalating prevalence of hypertension and cardiovascular diseases worldwide. This growth is further amplified by significant technological advancements, including the integration of smart features like Bluetooth connectivity, AI-powered data analytics, and seamless smartphone app integration. These innovations are not only enhancing the user experience but also driving widespread product adoption. Consumers are increasingly seeking convenient, intuitive devices that deliver precise and dependable readings. The growing emphasis on remote patient monitoring solutions and the accelerated adoption of telehealth services are acting as key catalysts for market growth. The competitive landscape is characterized by relentless innovation, strategic collaborations, and a consistent drive towards product diversification. The market is poised for substantial growth in the foreseeable future, fueled by increased public awareness of hypertension and the undeniable convenience of self-monitoring at home. While developed economies exhibit high market penetration, with an estimated XX% of households possessing at least one home blood pressure monitor, developing economies present significant untapped growth opportunities. These opportunities stem from rising healthcare consciousness and increasing disposable incomes, contributing to an anticipated Compound Annual Growth Rate (CAGR) of XX%.
Dominant Markets & Segments in Home Blood Pressure Monitoring Devices Market
North America currently commands the largest market share in the home blood pressure monitoring devices sector. This dominance is attributed to a confluence of factors, including the high incidence of cardiovascular ailments, a sophisticated healthcare infrastructure, and elevated levels of disposable income. Within the product segment, upper arm monitors continue to lead due to their inherent accuracy and well-established clinical validation. However, wrist monitors are steadily gaining traction, driven by their enhanced portability and user-friendliness. The online pharmacy distribution channel is witnessing exponential growth, primarily due to its unparalleled accessibility and ease of purchase. Key drivers underpinning regional dominance and segment preferences include:
- North America: Characterized by a high prevalence of hypertension, a robust and advanced healthcare system, substantial disposable incomes, and a strong consumer inclination towards adopting cutting-edge technology.
- Europe: Influenced by an aging demographic, increasing healthcare expenditure, and a growing awareness surrounding proactive hypertension management.
- Asia Pacific: Exhibiting a rapidly expanding healthcare sector, a rising burden of cardiovascular diseases, and increasing disposable incomes in its burgeoning emerging economies.
- Product Segment:
- Upper Arm Monitors: This segment remains the market leader, primarily owing to its superior accuracy and established clinical reliability, making it the preferred choice for healthcare professionals and patients alike.
- Wrist Monitors: This segment is demonstrating robust growth potential, driven by increasing consumer demand for compact, portable, and convenient monitoring solutions for on-the-go use.
- Accessories: This segment is experiencing steady growth, with demand fueled by essential add-ons such as carrying cases, replacement cuffs, and other supplementary items that enhance the user experience.
- Distribution Channel:
- Hospital Pharmacies: This channel retains its significance due to its extensive established networks and close ties with healthcare providers, ensuring trust and accessibility.
- Online Pharmacies: This channel is emerging as the fastest-growing avenue, propelled by its exceptional convenience, broad product availability, and direct-to-consumer accessibility.
- Other Distribution Channels: This encompasses a range of outlets including retail pharmacies, direct-to-consumer sales, and potentially specialized medical supply stores.
Home Blood Pressure Monitoring Devices Market Product Innovations
Recent innovations in home blood pressure monitoring devices focus on improved accuracy, enhanced user experience, and seamless integration with telehealth platforms. Manufacturers are incorporating advanced technologies like artificial intelligence (AI) and machine learning (ML) to analyze data, provide personalized insights, and facilitate early detection of cardiovascular risks. Wireless connectivity and smartphone integration are becoming standard features, enabling remote monitoring and data sharing with healthcare providers. Cuff-less blood pressure monitoring technology, as demonstrated by LiveMetric’s LiveOne, represents a significant leap forward, offering convenience and improved patient adherence.
Report Segmentation & Scope
This comprehensive report meticulously segments the Home Blood Pressure Monitoring Devices market based on key parameters: product type (Upper Arm Monitors, Wrist Monitors, and Accessories) and distribution channel (Hospital Pharmacies, Online Pharmacies, and Other Distribution Channels). Each segment is thoroughly analyzed to provide insights into its market size, projected growth trajectories, and the competitive dynamics at play. The Upper Arm Monitors segment is anticipated to sustain its market leadership, largely due to its well-documented high accuracy and extensive clinical validation. Conversely, the Wrist Monitors segment is poised for the most rapid expansion, driven by their growing popularity for portability and user-centric convenience. The online pharmacy distribution channel is projected to witness significant growth, owing to its inherent convenience and extensive reach. The "Other Distribution Channels" category encompasses retail pharmacies and direct-to-consumer sales, offering diverse avenues for market access. The competitive intensity within each segment varies, with key players often specializing in particular product categories or distribution strategies.
Key Drivers of Home Blood Pressure Monitoring Devices Market Growth
Several factors contribute to the significant growth of the home blood pressure monitoring devices market. These include:
- Rising prevalence of hypertension and cardiovascular diseases: The global burden of these diseases is increasing, driving demand for effective monitoring tools.
- Technological advancements: Innovations such as wireless connectivity, smartphone integration, and AI-powered analytics are enhancing device functionality and user experience.
- Increasing healthcare awareness and self-management: Consumers are increasingly proactive in managing their health, leading to greater adoption of home monitoring devices.
- Favorable regulatory environment: Approvals and certifications for medical devices are facilitating market entry and growth.
Challenges in the Home Blood Pressure Monitoring Devices Market Sector
The market faces several challenges, including:
- Stringent regulatory requirements: Meeting regulatory standards for medical devices can be costly and time-consuming.
- Accuracy and reliability concerns: Maintaining high accuracy and reliability across various device types and user populations is crucial.
- Competition from established and emerging players: The market is highly competitive, requiring companies to continuously innovate and differentiate their products.
- Supply chain disruptions: Global supply chain vulnerabilities can impact device production and availability.
Leading Players in the Home Blood Pressure Monitoring Devices Market Market
- Rossmax International Ltd
- Qardio Inc
- GE Healthcare
- Halma plc
- Koninklijke Philips N V
- Spengler SAS
- A&D Medical
- Contec Medical
- Omron Healthcare Inc
- Welch Allyn Inc
- Beurer GmbH
- American Diagnostic Corporation
Key Developments in Home Blood Pressure Monitoring Devices Market Sector
-
July 2022: LiveMetric revolutionized hypertension management with the launch of LiveOne, a groundbreaking cuff-less wrist-worn blood pressure monitor. This innovative device leverages advanced nano-sensor technology to enable continuous, real-time monitoring, offering unparalleled convenience and immediate data capture for users managing their blood pressure.
-
February 2022: InBody introduced the InBody BP 170, an automatic at-home blood pressure monitor designed for enhanced user experience. Featuring a large, exceptionally readable display, this device aims to improve the clarity of readings, potentially leading to greater accuracy and user confidence in self-monitoring.
Strategic Home Blood Pressure Monitoring Devices Market Market Outlook
The future of the home blood pressure monitoring devices market appears promising, driven by continued technological advancements, increasing prevalence of cardiovascular diseases, and the growing adoption of remote patient monitoring. Strategic opportunities lie in developing innovative, user-friendly devices with advanced features, expanding into emerging markets, and forging strategic partnerships with telehealth providers and healthcare organizations. The integration of AI and ML will play a key role in enhancing data analysis, personalized insights, and proactive risk management. The market's expansion will be shaped by companies that effectively adapt to evolving consumer preferences and regulatory landscapes.
Home Blood Pressure Monitoring Devices Market Segmentation
-
1. Product
- 1.1. Upper Arm Monitors
- 1.2. Wrist Monitors
- 1.3. Accessories
-
2. Distribution Channel
- 2.1. Hospital Pharmacies
- 2.2. Online Pharmacies
- 2.3. Other Distribution Channels
Home Blood Pressure Monitoring Devices Market Segmentation By Geography
-
1. North America
- 1.1. United States
- 1.2. Canada
- 1.3. Mexico
-
2. Europe
- 2.1. Germany
- 2.2. United Kingdom
- 2.3. France
- 2.4. Italy
- 2.5. Spain
- 2.6. Rest of Europe
-
3. Asia Pacific
- 3.1. China
- 3.2. Japan
- 3.3. India
- 3.4. Australia
- 3.5. South Korea
- 3.6. Rest of Asia Pacific
-
4. Middle East and Africa
- 4.1. GCC
- 4.2. South Africa
- 4.3. Rest of Middle East and Africa
-
5. South America
- 5.1. Brazil
- 5.2. Argentina
- 5.3. Rest of South America
Home Blood Pressure Monitoring Devices Market REPORT HIGHLIGHTS
| Aspects | Details |
|---|---|
| Study Period | 2019-2033 |
| Base Year | 2024 |
| Estimated Year | 2025 |
| Forecast Period | 2025-2033 |
| Historical Period | 2019-2024 |
| Growth Rate | CAGR of 10.54% from 2019-2033 |
| Segmentation |
|
Table of Contents
- 1. Introduction
- 1.1. Research Scope
- 1.2. Market Segmentation
- 1.3. Research Methodology
- 1.4. Definitions and Assumptions
- 2. Executive Summary
- 2.1. Introduction
- 3. Market Dynamics
- 3.1. Introduction
- 3.2. Market Drivers
- 3.2.1. Growing Burden of Blood Pressure-Related Diseases; Rise in the Use of Home Blood Pressure Monitors and Active Promotions; Advancements in the Devices
- 3.3. Market Restrains
- 3.3.1. High Cost and Accuracy of Devices
- 3.4. Market Trends
- 3.4.1. Wrist Monitors Segment is Dominating the Home Blood Pressure Monitoring Devices Market
- 4. Market Factor Analysis
- 4.1. Porters Five Forces
- 4.2. Supply/Value Chain
- 4.3. PESTEL analysis
- 4.4. Market Entropy
- 4.5. Patent/Trademark Analysis
- 5. Global Home Blood Pressure Monitoring Devices Market Analysis, Insights and Forecast, 2019-2031
- 5.1. Market Analysis, Insights and Forecast - by Product
- 5.1.1. Upper Arm Monitors
- 5.1.2. Wrist Monitors
- 5.1.3. Accessories
- 5.2. Market Analysis, Insights and Forecast - by Distribution Channel
- 5.2.1. Hospital Pharmacies
- 5.2.2. Online Pharmacies
- 5.2.3. Other Distribution Channels
- 5.3. Market Analysis, Insights and Forecast - by Region
- 5.3.1. North America
- 5.3.2. Europe
- 5.3.3. Asia Pacific
- 5.3.4. Middle East and Africa
- 5.3.5. South America
- 5.1. Market Analysis, Insights and Forecast - by Product
- 6. North America Home Blood Pressure Monitoring Devices Market Analysis, Insights and Forecast, 2019-2031
- 6.1. Market Analysis, Insights and Forecast - by Product
- 6.1.1. Upper Arm Monitors
- 6.1.2. Wrist Monitors
- 6.1.3. Accessories
- 6.2. Market Analysis, Insights and Forecast - by Distribution Channel
- 6.2.1. Hospital Pharmacies
- 6.2.2. Online Pharmacies
- 6.2.3. Other Distribution Channels
- 6.1. Market Analysis, Insights and Forecast - by Product
- 7. Europe Home Blood Pressure Monitoring Devices Market Analysis, Insights and Forecast, 2019-2031
- 7.1. Market Analysis, Insights and Forecast - by Product
- 7.1.1. Upper Arm Monitors
- 7.1.2. Wrist Monitors
- 7.1.3. Accessories
- 7.2. Market Analysis, Insights and Forecast - by Distribution Channel
- 7.2.1. Hospital Pharmacies
- 7.2.2. Online Pharmacies
- 7.2.3. Other Distribution Channels
- 7.1. Market Analysis, Insights and Forecast - by Product
- 8. Asia Pacific Home Blood Pressure Monitoring Devices Market Analysis, Insights and Forecast, 2019-2031
- 8.1. Market Analysis, Insights and Forecast - by Product
- 8.1.1. Upper Arm Monitors
- 8.1.2. Wrist Monitors
- 8.1.3. Accessories
- 8.2. Market Analysis, Insights and Forecast - by Distribution Channel
- 8.2.1. Hospital Pharmacies
- 8.2.2. Online Pharmacies
- 8.2.3. Other Distribution Channels
- 8.1. Market Analysis, Insights and Forecast - by Product
- 9. Middle East and Africa Home Blood Pressure Monitoring Devices Market Analysis, Insights and Forecast, 2019-2031
- 9.1. Market Analysis, Insights and Forecast - by Product
- 9.1.1. Upper Arm Monitors
- 9.1.2. Wrist Monitors
- 9.1.3. Accessories
- 9.2. Market Analysis, Insights and Forecast - by Distribution Channel
- 9.2.1. Hospital Pharmacies
- 9.2.2. Online Pharmacies
- 9.2.3. Other Distribution Channels
- 9.1. Market Analysis, Insights and Forecast - by Product
- 10. South America Home Blood Pressure Monitoring Devices Market Analysis, Insights and Forecast, 2019-2031
- 10.1. Market Analysis, Insights and Forecast - by Product
- 10.1.1. Upper Arm Monitors
- 10.1.2. Wrist Monitors
- 10.1.3. Accessories
- 10.2. Market Analysis, Insights and Forecast - by Distribution Channel
- 10.2.1. Hospital Pharmacies
- 10.2.2. Online Pharmacies
- 10.2.3. Other Distribution Channels
- 10.1. Market Analysis, Insights and Forecast - by Product
- 11. North America Home Blood Pressure Monitoring Devices Market Analysis, Insights and Forecast, 2019-2031
- 11.1. Market Analysis, Insights and Forecast - By Country/Sub-region
- 11.1.1 United States
- 11.1.2 Canada
- 11.1.3 Mexico
- 12. Europe Home Blood Pressure Monitoring Devices Market Analysis, Insights and Forecast, 2019-2031
- 12.1. Market Analysis, Insights and Forecast - By Country/Sub-region
- 12.1.1 Germany
- 12.1.2 United Kingdom
- 12.1.3 France
- 12.1.4 Italy
- 12.1.5 Spain
- 12.1.6 Rest of Europe
- 13. Asia Pacific Home Blood Pressure Monitoring Devices Market Analysis, Insights and Forecast, 2019-2031
- 13.1. Market Analysis, Insights and Forecast - By Country/Sub-region
- 13.1.1 China
- 13.1.2 Japan
- 13.1.3 India
- 13.1.4 Australia
- 13.1.5 South Korea
- 13.1.6 Rest of Asia Pacific
- 14. Middle East and Africa Home Blood Pressure Monitoring Devices Market Analysis, Insights and Forecast, 2019-2031
- 14.1. Market Analysis, Insights and Forecast - By Country/Sub-region
- 14.1.1 GCC
- 14.1.2 South Africa
- 14.1.3 Rest of Middle East and Africa
- 15. South America Home Blood Pressure Monitoring Devices Market Analysis, Insights and Forecast, 2019-2031
- 15.1. Market Analysis, Insights and Forecast - By Country/Sub-region
- 15.1.1 Brazil
- 15.1.2 Argentina
- 15.1.3 Rest of South America
- 16. Competitive Analysis
- 16.1. Global Market Share Analysis 2024
- 16.2. Company Profiles
- 16.2.1 Rossmax International Ltd
- 16.2.1.1. Overview
- 16.2.1.2. Products
- 16.2.1.3. SWOT Analysis
- 16.2.1.4. Recent Developments
- 16.2.1.5. Financials (Based on Availability)
- 16.2.2 Qardio Inc
- 16.2.2.1. Overview
- 16.2.2.2. Products
- 16.2.2.3. SWOT Analysis
- 16.2.2.4. Recent Developments
- 16.2.2.5. Financials (Based on Availability)
- 16.2.3 GE Healthcare
- 16.2.3.1. Overview
- 16.2.3.2. Products
- 16.2.3.3. SWOT Analysis
- 16.2.3.4. Recent Developments
- 16.2.3.5. Financials (Based on Availability)
- 16.2.4 Halma plc
- 16.2.4.1. Overview
- 16.2.4.2. Products
- 16.2.4.3. SWOT Analysis
- 16.2.4.4. Recent Developments
- 16.2.4.5. Financials (Based on Availability)
- 16.2.5 Koninklijke Philips N V
- 16.2.5.1. Overview
- 16.2.5.2. Products
- 16.2.5.3. SWOT Analysis
- 16.2.5.4. Recent Developments
- 16.2.5.5. Financials (Based on Availability)
- 16.2.6 Spengler SAS
- 16.2.6.1. Overview
- 16.2.6.2. Products
- 16.2.6.3. SWOT Analysis
- 16.2.6.4. Recent Developments
- 16.2.6.5. Financials (Based on Availability)
- 16.2.7 A&D Medical
- 16.2.7.1. Overview
- 16.2.7.2. Products
- 16.2.7.3. SWOT Analysis
- 16.2.7.4. Recent Developments
- 16.2.7.5. Financials (Based on Availability)
- 16.2.8 Contec Medical
- 16.2.8.1. Overview
- 16.2.8.2. Products
- 16.2.8.3. SWOT Analysis
- 16.2.8.4. Recent Developments
- 16.2.8.5. Financials (Based on Availability)
- 16.2.9 Omron Healthcare Inc
- 16.2.9.1. Overview
- 16.2.9.2. Products
- 16.2.9.3. SWOT Analysis
- 16.2.9.4. Recent Developments
- 16.2.9.5. Financials (Based on Availability)
- 16.2.10 Welch Allyn Inc
- 16.2.10.1. Overview
- 16.2.10.2. Products
- 16.2.10.3. SWOT Analysis
- 16.2.10.4. Recent Developments
- 16.2.10.5. Financials (Based on Availability)
- 16.2.11 Beurer GmbH
- 16.2.11.1. Overview
- 16.2.11.2. Products
- 16.2.11.3. SWOT Analysis
- 16.2.11.4. Recent Developments
- 16.2.11.5. Financials (Based on Availability)
- 16.2.12 American Diagnostic Corporation
- 16.2.12.1. Overview
- 16.2.12.2. Products
- 16.2.12.3. SWOT Analysis
- 16.2.12.4. Recent Developments
- 16.2.12.5. Financials (Based on Availability)
- 16.2.1 Rossmax International Ltd
List of Figures
- Figure 1: Global Home Blood Pressure Monitoring Devices Market Revenue Breakdown (Million, %) by Region 2024 & 2032
- Figure 2: Global Home Blood Pressure Monitoring Devices Market Volume Breakdown (K Unit, %) by Region 2024 & 2032
- Figure 3: North America Home Blood Pressure Monitoring Devices Market Revenue (Million), by Country 2024 & 2032
- Figure 4: North America Home Blood Pressure Monitoring Devices Market Volume (K Unit), by Country 2024 & 2032
- Figure 5: North America Home Blood Pressure Monitoring Devices Market Revenue Share (%), by Country 2024 & 2032
- Figure 6: North America Home Blood Pressure Monitoring Devices Market Volume Share (%), by Country 2024 & 2032
- Figure 7: Europe Home Blood Pressure Monitoring Devices Market Revenue (Million), by Country 2024 & 2032
- Figure 8: Europe Home Blood Pressure Monitoring Devices Market Volume (K Unit), by Country 2024 & 2032
- Figure 9: Europe Home Blood Pressure Monitoring Devices Market Revenue Share (%), by Country 2024 & 2032
- Figure 10: Europe Home Blood Pressure Monitoring Devices Market Volume Share (%), by Country 2024 & 2032
- Figure 11: Asia Pacific Home Blood Pressure Monitoring Devices Market Revenue (Million), by Country 2024 & 2032
- Figure 12: Asia Pacific Home Blood Pressure Monitoring Devices Market Volume (K Unit), by Country 2024 & 2032
- Figure 13: Asia Pacific Home Blood Pressure Monitoring Devices Market Revenue Share (%), by Country 2024 & 2032
- Figure 14: Asia Pacific Home Blood Pressure Monitoring Devices Market Volume Share (%), by Country 2024 & 2032
- Figure 15: Middle East and Africa Home Blood Pressure Monitoring Devices Market Revenue (Million), by Country 2024 & 2032
- Figure 16: Middle East and Africa Home Blood Pressure Monitoring Devices Market Volume (K Unit), by Country 2024 & 2032
- Figure 17: Middle East and Africa Home Blood Pressure Monitoring Devices Market Revenue Share (%), by Country 2024 & 2032
- Figure 18: Middle East and Africa Home Blood Pressure Monitoring Devices Market Volume Share (%), by Country 2024 & 2032
- Figure 19: South America Home Blood Pressure Monitoring Devices Market Revenue (Million), by Country 2024 & 2032
- Figure 20: South America Home Blood Pressure Monitoring Devices Market Volume (K Unit), by Country 2024 & 2032
- Figure 21: South America Home Blood Pressure Monitoring Devices Market Revenue Share (%), by Country 2024 & 2032
- Figure 22: South America Home Blood Pressure Monitoring Devices Market Volume Share (%), by Country 2024 & 2032
- Figure 23: North America Home Blood Pressure Monitoring Devices Market Revenue (Million), by Product 2024 & 2032
- Figure 24: North America Home Blood Pressure Monitoring Devices Market Volume (K Unit), by Product 2024 & 2032
- Figure 25: North America Home Blood Pressure Monitoring Devices Market Revenue Share (%), by Product 2024 & 2032
- Figure 26: North America Home Blood Pressure Monitoring Devices Market Volume Share (%), by Product 2024 & 2032
- Figure 27: North America Home Blood Pressure Monitoring Devices Market Revenue (Million), by Distribution Channel 2024 & 2032
- Figure 28: North America Home Blood Pressure Monitoring Devices Market Volume (K Unit), by Distribution Channel 2024 & 2032
- Figure 29: North America Home Blood Pressure Monitoring Devices Market Revenue Share (%), by Distribution Channel 2024 & 2032
- Figure 30: North America Home Blood Pressure Monitoring Devices Market Volume Share (%), by Distribution Channel 2024 & 2032
- Figure 31: North America Home Blood Pressure Monitoring Devices Market Revenue (Million), by Country 2024 & 2032
- Figure 32: North America Home Blood Pressure Monitoring Devices Market Volume (K Unit), by Country 2024 & 2032
- Figure 33: North America Home Blood Pressure Monitoring Devices Market Revenue Share (%), by Country 2024 & 2032
- Figure 34: North America Home Blood Pressure Monitoring Devices Market Volume Share (%), by Country 2024 & 2032
- Figure 35: Europe Home Blood Pressure Monitoring Devices Market Revenue (Million), by Product 2024 & 2032
- Figure 36: Europe Home Blood Pressure Monitoring Devices Market Volume (K Unit), by Product 2024 & 2032
- Figure 37: Europe Home Blood Pressure Monitoring Devices Market Revenue Share (%), by Product 2024 & 2032
- Figure 38: Europe Home Blood Pressure Monitoring Devices Market Volume Share (%), by Product 2024 & 2032
- Figure 39: Europe Home Blood Pressure Monitoring Devices Market Revenue (Million), by Distribution Channel 2024 & 2032
- Figure 40: Europe Home Blood Pressure Monitoring Devices Market Volume (K Unit), by Distribution Channel 2024 & 2032
- Figure 41: Europe Home Blood Pressure Monitoring Devices Market Revenue Share (%), by Distribution Channel 2024 & 2032
- Figure 42: Europe Home Blood Pressure Monitoring Devices Market Volume Share (%), by Distribution Channel 2024 & 2032
- Figure 43: Europe Home Blood Pressure Monitoring Devices Market Revenue (Million), by Country 2024 & 2032
- Figure 44: Europe Home Blood Pressure Monitoring Devices Market Volume (K Unit), by Country 2024 & 2032
- Figure 45: Europe Home Blood Pressure Monitoring Devices Market Revenue Share (%), by Country 2024 & 2032
- Figure 46: Europe Home Blood Pressure Monitoring Devices Market Volume Share (%), by Country 2024 & 2032
- Figure 47: Asia Pacific Home Blood Pressure Monitoring Devices Market Revenue (Million), by Product 2024 & 2032
- Figure 48: Asia Pacific Home Blood Pressure Monitoring Devices Market Volume (K Unit), by Product 2024 & 2032
- Figure 49: Asia Pacific Home Blood Pressure Monitoring Devices Market Revenue Share (%), by Product 2024 & 2032
- Figure 50: Asia Pacific Home Blood Pressure Monitoring Devices Market Volume Share (%), by Product 2024 & 2032
- Figure 51: Asia Pacific Home Blood Pressure Monitoring Devices Market Revenue (Million), by Distribution Channel 2024 & 2032
- Figure 52: Asia Pacific Home Blood Pressure Monitoring Devices Market Volume (K Unit), by Distribution Channel 2024 & 2032
- Figure 53: Asia Pacific Home Blood Pressure Monitoring Devices Market Revenue Share (%), by Distribution Channel 2024 & 2032
- Figure 54: Asia Pacific Home Blood Pressure Monitoring Devices Market Volume Share (%), by Distribution Channel 2024 & 2032
- Figure 55: Asia Pacific Home Blood Pressure Monitoring Devices Market Revenue (Million), by Country 2024 & 2032
- Figure 56: Asia Pacific Home Blood Pressure Monitoring Devices Market Volume (K Unit), by Country 2024 & 2032
- Figure 57: Asia Pacific Home Blood Pressure Monitoring Devices Market Revenue Share (%), by Country 2024 & 2032
- Figure 58: Asia Pacific Home Blood Pressure Monitoring Devices Market Volume Share (%), by Country 2024 & 2032
- Figure 59: Middle East and Africa Home Blood Pressure Monitoring Devices Market Revenue (Million), by Product 2024 & 2032
- Figure 60: Middle East and Africa Home Blood Pressure Monitoring Devices Market Volume (K Unit), by Product 2024 & 2032
- Figure 61: Middle East and Africa Home Blood Pressure Monitoring Devices Market Revenue Share (%), by Product 2024 & 2032
- Figure 62: Middle East and Africa Home Blood Pressure Monitoring Devices Market Volume Share (%), by Product 2024 & 2032
- Figure 63: Middle East and Africa Home Blood Pressure Monitoring Devices Market Revenue (Million), by Distribution Channel 2024 & 2032
- Figure 64: Middle East and Africa Home Blood Pressure Monitoring Devices Market Volume (K Unit), by Distribution Channel 2024 & 2032
- Figure 65: Middle East and Africa Home Blood Pressure Monitoring Devices Market Revenue Share (%), by Distribution Channel 2024 & 2032
- Figure 66: Middle East and Africa Home Blood Pressure Monitoring Devices Market Volume Share (%), by Distribution Channel 2024 & 2032
- Figure 67: Middle East and Africa Home Blood Pressure Monitoring Devices Market Revenue (Million), by Country 2024 & 2032
- Figure 68: Middle East and Africa Home Blood Pressure Monitoring Devices Market Volume (K Unit), by Country 2024 & 2032
- Figure 69: Middle East and Africa Home Blood Pressure Monitoring Devices Market Revenue Share (%), by Country 2024 & 2032
- Figure 70: Middle East and Africa Home Blood Pressure Monitoring Devices Market Volume Share (%), by Country 2024 & 2032
- Figure 71: South America Home Blood Pressure Monitoring Devices Market Revenue (Million), by Product 2024 & 2032
- Figure 72: South America Home Blood Pressure Monitoring Devices Market Volume (K Unit), by Product 2024 & 2032
- Figure 73: South America Home Blood Pressure Monitoring Devices Market Revenue Share (%), by Product 2024 & 2032
- Figure 74: South America Home Blood Pressure Monitoring Devices Market Volume Share (%), by Product 2024 & 2032
- Figure 75: South America Home Blood Pressure Monitoring Devices Market Revenue (Million), by Distribution Channel 2024 & 2032
- Figure 76: South America Home Blood Pressure Monitoring Devices Market Volume (K Unit), by Distribution Channel 2024 & 2032
- Figure 77: South America Home Blood Pressure Monitoring Devices Market Revenue Share (%), by Distribution Channel 2024 & 2032
- Figure 78: South America Home Blood Pressure Monitoring Devices Market Volume Share (%), by Distribution Channel 2024 & 2032
- Figure 79: South America Home Blood Pressure Monitoring Devices Market Revenue (Million), by Country 2024 & 2032
- Figure 80: South America Home Blood Pressure Monitoring Devices Market Volume (K Unit), by Country 2024 & 2032
- Figure 81: South America Home Blood Pressure Monitoring Devices Market Revenue Share (%), by Country 2024 & 2032
- Figure 82: South America Home Blood Pressure Monitoring Devices Market Volume Share (%), by Country 2024 & 2032
List of Tables
- Table 1: Global Home Blood Pressure Monitoring Devices Market Revenue Million Forecast, by Region 2019 & 2032
- Table 2: Global Home Blood Pressure Monitoring Devices Market Volume K Unit Forecast, by Region 2019 & 2032
- Table 3: Global Home Blood Pressure Monitoring Devices Market Revenue Million Forecast, by Product 2019 & 2032
- Table 4: Global Home Blood Pressure Monitoring Devices Market Volume K Unit Forecast, by Product 2019 & 2032
- Table 5: Global Home Blood Pressure Monitoring Devices Market Revenue Million Forecast, by Distribution Channel 2019 & 2032
- Table 6: Global Home Blood Pressure Monitoring Devices Market Volume K Unit Forecast, by Distribution Channel 2019 & 2032
- Table 7: Global Home Blood Pressure Monitoring Devices Market Revenue Million Forecast, by Region 2019 & 2032
- Table 8: Global Home Blood Pressure Monitoring Devices Market Volume K Unit Forecast, by Region 2019 & 2032
- Table 9: Global Home Blood Pressure Monitoring Devices Market Revenue Million Forecast, by Country 2019 & 2032
- Table 10: Global Home Blood Pressure Monitoring Devices Market Volume K Unit Forecast, by Country 2019 & 2032
- Table 11: United States Home Blood Pressure Monitoring Devices Market Revenue (Million) Forecast, by Application 2019 & 2032
- Table 12: United States Home Blood Pressure Monitoring Devices Market Volume (K Unit) Forecast, by Application 2019 & 2032
- Table 13: Canada Home Blood Pressure Monitoring Devices Market Revenue (Million) Forecast, by Application 2019 & 2032
- Table 14: Canada Home Blood Pressure Monitoring Devices Market Volume (K Unit) Forecast, by Application 2019 & 2032
- Table 15: Mexico Home Blood Pressure Monitoring Devices Market Revenue (Million) Forecast, by Application 2019 & 2032
- Table 16: Mexico Home Blood Pressure Monitoring Devices Market Volume (K Unit) Forecast, by Application 2019 & 2032
- Table 17: Global Home Blood Pressure Monitoring Devices Market Revenue Million Forecast, by Country 2019 & 2032
- Table 18: Global Home Blood Pressure Monitoring Devices Market Volume K Unit Forecast, by Country 2019 & 2032
- Table 19: Germany Home Blood Pressure Monitoring Devices Market Revenue (Million) Forecast, by Application 2019 & 2032
- Table 20: Germany Home Blood Pressure Monitoring Devices Market Volume (K Unit) Forecast, by Application 2019 & 2032
- Table 21: United Kingdom Home Blood Pressure Monitoring Devices Market Revenue (Million) Forecast, by Application 2019 & 2032
- Table 22: United Kingdom Home Blood Pressure Monitoring Devices Market Volume (K Unit) Forecast, by Application 2019 & 2032
- Table 23: France Home Blood Pressure Monitoring Devices Market Revenue (Million) Forecast, by Application 2019 & 2032
- Table 24: France Home Blood Pressure Monitoring Devices Market Volume (K Unit) Forecast, by Application 2019 & 2032
- Table 25: Italy Home Blood Pressure Monitoring Devices Market Revenue (Million) Forecast, by Application 2019 & 2032
- Table 26: Italy Home Blood Pressure Monitoring Devices Market Volume (K Unit) Forecast, by Application 2019 & 2032
- Table 27: Spain Home Blood Pressure Monitoring Devices Market Revenue (Million) Forecast, by Application 2019 & 2032
- Table 28: Spain Home Blood Pressure Monitoring Devices Market Volume (K Unit) Forecast, by Application 2019 & 2032
- Table 29: Rest of Europe Home Blood Pressure Monitoring Devices Market Revenue (Million) Forecast, by Application 2019 & 2032
- Table 30: Rest of Europe Home Blood Pressure Monitoring Devices Market Volume (K Unit) Forecast, by Application 2019 & 2032
- Table 31: Global Home Blood Pressure Monitoring Devices Market Revenue Million Forecast, by Country 2019 & 2032
- Table 32: Global Home Blood Pressure Monitoring Devices Market Volume K Unit Forecast, by Country 2019 & 2032
- Table 33: China Home Blood Pressure Monitoring Devices Market Revenue (Million) Forecast, by Application 2019 & 2032
- Table 34: China Home Blood Pressure Monitoring Devices Market Volume (K Unit) Forecast, by Application 2019 & 2032
- Table 35: Japan Home Blood Pressure Monitoring Devices Market Revenue (Million) Forecast, by Application 2019 & 2032
- Table 36: Japan Home Blood Pressure Monitoring Devices Market Volume (K Unit) Forecast, by Application 2019 & 2032
- Table 37: India Home Blood Pressure Monitoring Devices Market Revenue (Million) Forecast, by Application 2019 & 2032
- Table 38: India Home Blood Pressure Monitoring Devices Market Volume (K Unit) Forecast, by Application 2019 & 2032
- Table 39: Australia Home Blood Pressure Monitoring Devices Market Revenue (Million) Forecast, by Application 2019 & 2032
- Table 40: Australia Home Blood Pressure Monitoring Devices Market Volume (K Unit) Forecast, by Application 2019 & 2032
- Table 41: South Korea Home Blood Pressure Monitoring Devices Market Revenue (Million) Forecast, by Application 2019 & 2032
- Table 42: South Korea Home Blood Pressure Monitoring Devices Market Volume (K Unit) Forecast, by Application 2019 & 2032
- Table 43: Rest of Asia Pacific Home Blood Pressure Monitoring Devices Market Revenue (Million) Forecast, by Application 2019 & 2032
- Table 44: Rest of Asia Pacific Home Blood Pressure Monitoring Devices Market Volume (K Unit) Forecast, by Application 2019 & 2032
- Table 45: Global Home Blood Pressure Monitoring Devices Market Revenue Million Forecast, by Country 2019 & 2032
- Table 46: Global Home Blood Pressure Monitoring Devices Market Volume K Unit Forecast, by Country 2019 & 2032
- Table 47: GCC Home Blood Pressure Monitoring Devices Market Revenue (Million) Forecast, by Application 2019 & 2032
- Table 48: GCC Home Blood Pressure Monitoring Devices Market Volume (K Unit) Forecast, by Application 2019 & 2032
- Table 49: South Africa Home Blood Pressure Monitoring Devices Market Revenue (Million) Forecast, by Application 2019 & 2032
- Table 50: South Africa Home Blood Pressure Monitoring Devices Market Volume (K Unit) Forecast, by Application 2019 & 2032
- Table 51: Rest of Middle East and Africa Home Blood Pressure Monitoring Devices Market Revenue (Million) Forecast, by Application 2019 & 2032
- Table 52: Rest of Middle East and Africa Home Blood Pressure Monitoring Devices Market Volume (K Unit) Forecast, by Application 2019 & 2032
- Table 53: Global Home Blood Pressure Monitoring Devices Market Revenue Million Forecast, by Country 2019 & 2032
- Table 54: Global Home Blood Pressure Monitoring Devices Market Volume K Unit Forecast, by Country 2019 & 2032
- Table 55: Brazil Home Blood Pressure Monitoring Devices Market Revenue (Million) Forecast, by Application 2019 & 2032
- Table 56: Brazil Home Blood Pressure Monitoring Devices Market Volume (K Unit) Forecast, by Application 2019 & 2032
- Table 57: Argentina Home Blood Pressure Monitoring Devices Market Revenue (Million) Forecast, by Application 2019 & 2032
- Table 58: Argentina Home Blood Pressure Monitoring Devices Market Volume (K Unit) Forecast, by Application 2019 & 2032
- Table 59: Rest of South America Home Blood Pressure Monitoring Devices Market Revenue (Million) Forecast, by Application 2019 & 2032
- Table 60: Rest of South America Home Blood Pressure Monitoring Devices Market Volume (K Unit) Forecast, by Application 2019 & 2032
- Table 61: Global Home Blood Pressure Monitoring Devices Market Revenue Million Forecast, by Product 2019 & 2032
- Table 62: Global Home Blood Pressure Monitoring Devices Market Volume K Unit Forecast, by Product 2019 & 2032
- Table 63: Global Home Blood Pressure Monitoring Devices Market Revenue Million Forecast, by Distribution Channel 2019 & 2032
- Table 64: Global Home Blood Pressure Monitoring Devices Market Volume K Unit Forecast, by Distribution Channel 2019 & 2032
- Table 65: Global Home Blood Pressure Monitoring Devices Market Revenue Million Forecast, by Country 2019 & 2032
- Table 66: Global Home Blood Pressure Monitoring Devices Market Volume K Unit Forecast, by Country 2019 & 2032
- Table 67: United States Home Blood Pressure Monitoring Devices Market Revenue (Million) Forecast, by Application 2019 & 2032
- Table 68: United States Home Blood Pressure Monitoring Devices Market Volume (K Unit) Forecast, by Application 2019 & 2032
- Table 69: Canada Home Blood Pressure Monitoring Devices Market Revenue (Million) Forecast, by Application 2019 & 2032
- Table 70: Canada Home Blood Pressure Monitoring Devices Market Volume (K Unit) Forecast, by Application 2019 & 2032
- Table 71: Mexico Home Blood Pressure Monitoring Devices Market Revenue (Million) Forecast, by Application 2019 & 2032
- Table 72: Mexico Home Blood Pressure Monitoring Devices Market Volume (K Unit) Forecast, by Application 2019 & 2032
- Table 73: Global Home Blood Pressure Monitoring Devices Market Revenue Million Forecast, by Product 2019 & 2032
- Table 74: Global Home Blood Pressure Monitoring Devices Market Volume K Unit Forecast, by Product 2019 & 2032
- Table 75: Global Home Blood Pressure Monitoring Devices Market Revenue Million Forecast, by Distribution Channel 2019 & 2032
- Table 76: Global Home Blood Pressure Monitoring Devices Market Volume K Unit Forecast, by Distribution Channel 2019 & 2032
- Table 77: Global Home Blood Pressure Monitoring Devices Market Revenue Million Forecast, by Country 2019 & 2032
- Table 78: Global Home Blood Pressure Monitoring Devices Market Volume K Unit Forecast, by Country 2019 & 2032
- Table 79: Germany Home Blood Pressure Monitoring Devices Market Revenue (Million) Forecast, by Application 2019 & 2032
- Table 80: Germany Home Blood Pressure Monitoring Devices Market Volume (K Unit) Forecast, by Application 2019 & 2032
- Table 81: United Kingdom Home Blood Pressure Monitoring Devices Market Revenue (Million) Forecast, by Application 2019 & 2032
- Table 82: United Kingdom Home Blood Pressure Monitoring Devices Market Volume (K Unit) Forecast, by Application 2019 & 2032
- Table 83: France Home Blood Pressure Monitoring Devices Market Revenue (Million) Forecast, by Application 2019 & 2032
- Table 84: France Home Blood Pressure Monitoring Devices Market Volume (K Unit) Forecast, by Application 2019 & 2032
- Table 85: Italy Home Blood Pressure Monitoring Devices Market Revenue (Million) Forecast, by Application 2019 & 2032
- Table 86: Italy Home Blood Pressure Monitoring Devices Market Volume (K Unit) Forecast, by Application 2019 & 2032
- Table 87: Spain Home Blood Pressure Monitoring Devices Market Revenue (Million) Forecast, by Application 2019 & 2032
- Table 88: Spain Home Blood Pressure Monitoring Devices Market Volume (K Unit) Forecast, by Application 2019 & 2032
- Table 89: Rest of Europe Home Blood Pressure Monitoring Devices Market Revenue (Million) Forecast, by Application 2019 & 2032
- Table 90: Rest of Europe Home Blood Pressure Monitoring Devices Market Volume (K Unit) Forecast, by Application 2019 & 2032
- Table 91: Global Home Blood Pressure Monitoring Devices Market Revenue Million Forecast, by Product 2019 & 2032
- Table 92: Global Home Blood Pressure Monitoring Devices Market Volume K Unit Forecast, by Product 2019 & 2032
- Table 93: Global Home Blood Pressure Monitoring Devices Market Revenue Million Forecast, by Distribution Channel 2019 & 2032
- Table 94: Global Home Blood Pressure Monitoring Devices Market Volume K Unit Forecast, by Distribution Channel 2019 & 2032
- Table 95: Global Home Blood Pressure Monitoring Devices Market Revenue Million Forecast, by Country 2019 & 2032
- Table 96: Global Home Blood Pressure Monitoring Devices Market Volume K Unit Forecast, by Country 2019 & 2032
- Table 97: China Home Blood Pressure Monitoring Devices Market Revenue (Million) Forecast, by Application 2019 & 2032
- Table 98: China Home Blood Pressure Monitoring Devices Market Volume (K Unit) Forecast, by Application 2019 & 2032
- Table 99: Japan Home Blood Pressure Monitoring Devices Market Revenue (Million) Forecast, by Application 2019 & 2032
- Table 100: Japan Home Blood Pressure Monitoring Devices Market Volume (K Unit) Forecast, by Application 2019 & 2032
- Table 101: India Home Blood Pressure Monitoring Devices Market Revenue (Million) Forecast, by Application 2019 & 2032
- Table 102: India Home Blood Pressure Monitoring Devices Market Volume (K Unit) Forecast, by Application 2019 & 2032
- Table 103: Australia Home Blood Pressure Monitoring Devices Market Revenue (Million) Forecast, by Application 2019 & 2032
- Table 104: Australia Home Blood Pressure Monitoring Devices Market Volume (K Unit) Forecast, by Application 2019 & 2032
- Table 105: South Korea Home Blood Pressure Monitoring Devices Market Revenue (Million) Forecast, by Application 2019 & 2032
- Table 106: South Korea Home Blood Pressure Monitoring Devices Market Volume (K Unit) Forecast, by Application 2019 & 2032
- Table 107: Rest of Asia Pacific Home Blood Pressure Monitoring Devices Market Revenue (Million) Forecast, by Application 2019 & 2032
- Table 108: Rest of Asia Pacific Home Blood Pressure Monitoring Devices Market Volume (K Unit) Forecast, by Application 2019 & 2032
- Table 109: Global Home Blood Pressure Monitoring Devices Market Revenue Million Forecast, by Product 2019 & 2032
- Table 110: Global Home Blood Pressure Monitoring Devices Market Volume K Unit Forecast, by Product 2019 & 2032
- Table 111: Global Home Blood Pressure Monitoring Devices Market Revenue Million Forecast, by Distribution Channel 2019 & 2032
- Table 112: Global Home Blood Pressure Monitoring Devices Market Volume K Unit Forecast, by Distribution Channel 2019 & 2032
- Table 113: Global Home Blood Pressure Monitoring Devices Market Revenue Million Forecast, by Country 2019 & 2032
- Table 114: Global Home Blood Pressure Monitoring Devices Market Volume K Unit Forecast, by Country 2019 & 2032
- Table 115: GCC Home Blood Pressure Monitoring Devices Market Revenue (Million) Forecast, by Application 2019 & 2032
- Table 116: GCC Home Blood Pressure Monitoring Devices Market Volume (K Unit) Forecast, by Application 2019 & 2032
- Table 117: South Africa Home Blood Pressure Monitoring Devices Market Revenue (Million) Forecast, by Application 2019 & 2032
- Table 118: South Africa Home Blood Pressure Monitoring Devices Market Volume (K Unit) Forecast, by Application 2019 & 2032
- Table 119: Rest of Middle East and Africa Home Blood Pressure Monitoring Devices Market Revenue (Million) Forecast, by Application 2019 & 2032
- Table 120: Rest of Middle East and Africa Home Blood Pressure Monitoring Devices Market Volume (K Unit) Forecast, by Application 2019 & 2032
- Table 121: Global Home Blood Pressure Monitoring Devices Market Revenue Million Forecast, by Product 2019 & 2032
- Table 122: Global Home Blood Pressure Monitoring Devices Market Volume K Unit Forecast, by Product 2019 & 2032
- Table 123: Global Home Blood Pressure Monitoring Devices Market Revenue Million Forecast, by Distribution Channel 2019 & 2032
- Table 124: Global Home Blood Pressure Monitoring Devices Market Volume K Unit Forecast, by Distribution Channel 2019 & 2032
- Table 125: Global Home Blood Pressure Monitoring Devices Market Revenue Million Forecast, by Country 2019 & 2032
- Table 126: Global Home Blood Pressure Monitoring Devices Market Volume K Unit Forecast, by Country 2019 & 2032
- Table 127: Brazil Home Blood Pressure Monitoring Devices Market Revenue (Million) Forecast, by Application 2019 & 2032
- Table 128: Brazil Home Blood Pressure Monitoring Devices Market Volume (K Unit) Forecast, by Application 2019 & 2032
- Table 129: Argentina Home Blood Pressure Monitoring Devices Market Revenue (Million) Forecast, by Application 2019 & 2032
- Table 130: Argentina Home Blood Pressure Monitoring Devices Market Volume (K Unit) Forecast, by Application 2019 & 2032
- Table 131: Rest of South America Home Blood Pressure Monitoring Devices Market Revenue (Million) Forecast, by Application 2019 & 2032
- Table 132: Rest of South America Home Blood Pressure Monitoring Devices Market Volume (K Unit) Forecast, by Application 2019 & 2032
Frequently Asked Questions
1. What is the projected Compound Annual Growth Rate (CAGR) of the Home Blood Pressure Monitoring Devices Market?
The projected CAGR is approximately 10.54%.
2. Which companies are prominent players in the Home Blood Pressure Monitoring Devices Market?
Key companies in the market include Rossmax International Ltd, Qardio Inc, GE Healthcare, Halma plc, Koninklijke Philips N V, Spengler SAS, A&D Medical, Contec Medical, Omron Healthcare Inc, Welch Allyn Inc, Beurer GmbH, American Diagnostic Corporation.
3. What are the main segments of the Home Blood Pressure Monitoring Devices Market?
The market segments include Product, Distribution Channel.
4. Can you provide details about the market size?
The market size is estimated to be USD 1.25 Million as of 2022.
5. What are some drivers contributing to market growth?
Growing Burden of Blood Pressure-Related Diseases; Rise in the Use of Home Blood Pressure Monitors and Active Promotions; Advancements in the Devices.
6. What are the notable trends driving market growth?
Wrist Monitors Segment is Dominating the Home Blood Pressure Monitoring Devices Market.
7. Are there any restraints impacting market growth?
High Cost and Accuracy of Devices.
8. Can you provide examples of recent developments in the market?
July 2022: LiveMetric launched LiveOne, a nano-sensor technology for monitoring blood pressure every 10 seconds. LiveOne is a wrist-worn, cuff-free solution that gives real-time measurements for better care and management of people with hypertension and cardiovascular disorders.
9. What pricing options are available for accessing the report?
Pricing options include single-user, multi-user, and enterprise licenses priced at USD 4750, USD 5250, and USD 8750 respectively.
10. Is the market size provided in terms of value or volume?
The market size is provided in terms of value, measured in Million and volume, measured in K Unit.
11. Are there any specific market keywords associated with the report?
Yes, the market keyword associated with the report is "Home Blood Pressure Monitoring Devices Market," which aids in identifying and referencing the specific market segment covered.
12. How do I determine which pricing option suits my needs best?
The pricing options vary based on user requirements and access needs. Individual users may opt for single-user licenses, while businesses requiring broader access may choose multi-user or enterprise licenses for cost-effective access to the report.
13. Are there any additional resources or data provided in the Home Blood Pressure Monitoring Devices Market report?
While the report offers comprehensive insights, it's advisable to review the specific contents or supplementary materials provided to ascertain if additional resources or data are available.
14. How can I stay updated on further developments or reports in the Home Blood Pressure Monitoring Devices Market?
To stay informed about further developments, trends, and reports in the Home Blood Pressure Monitoring Devices Market, consider subscribing to industry newsletters, following relevant companies and organizations, or regularly checking reputable industry news sources and publications.
Methodology
Step 1 - Identification of Relevant Samples Size from Population Database


Step 2 - Approaches for Defining Global Market Size (Value, Volume* & Price*)

Note*: In applicable scenarios
Step 3 - Data Sources
Primary Research
- Web Analytics
- Survey Reports
- Research Institute
- Latest Research Reports
- Opinion Leaders
Secondary Research
- Annual Reports
- White Paper
- Latest Press Release
- Industry Association
- Paid Database
- Investor Presentations

Step 4 - Data Triangulation
Involves using different sources of information in order to increase the validity of a study
These sources are likely to be stakeholders in a program - participants, other researchers, program staff, other community members, and so on.
Then we put all data in single framework & apply various statistical tools to find out the dynamic on the market.
During the analysis stage, feedback from the stakeholder groups would be compared to determine areas of agreement as well as areas of divergence


