
Key Insights
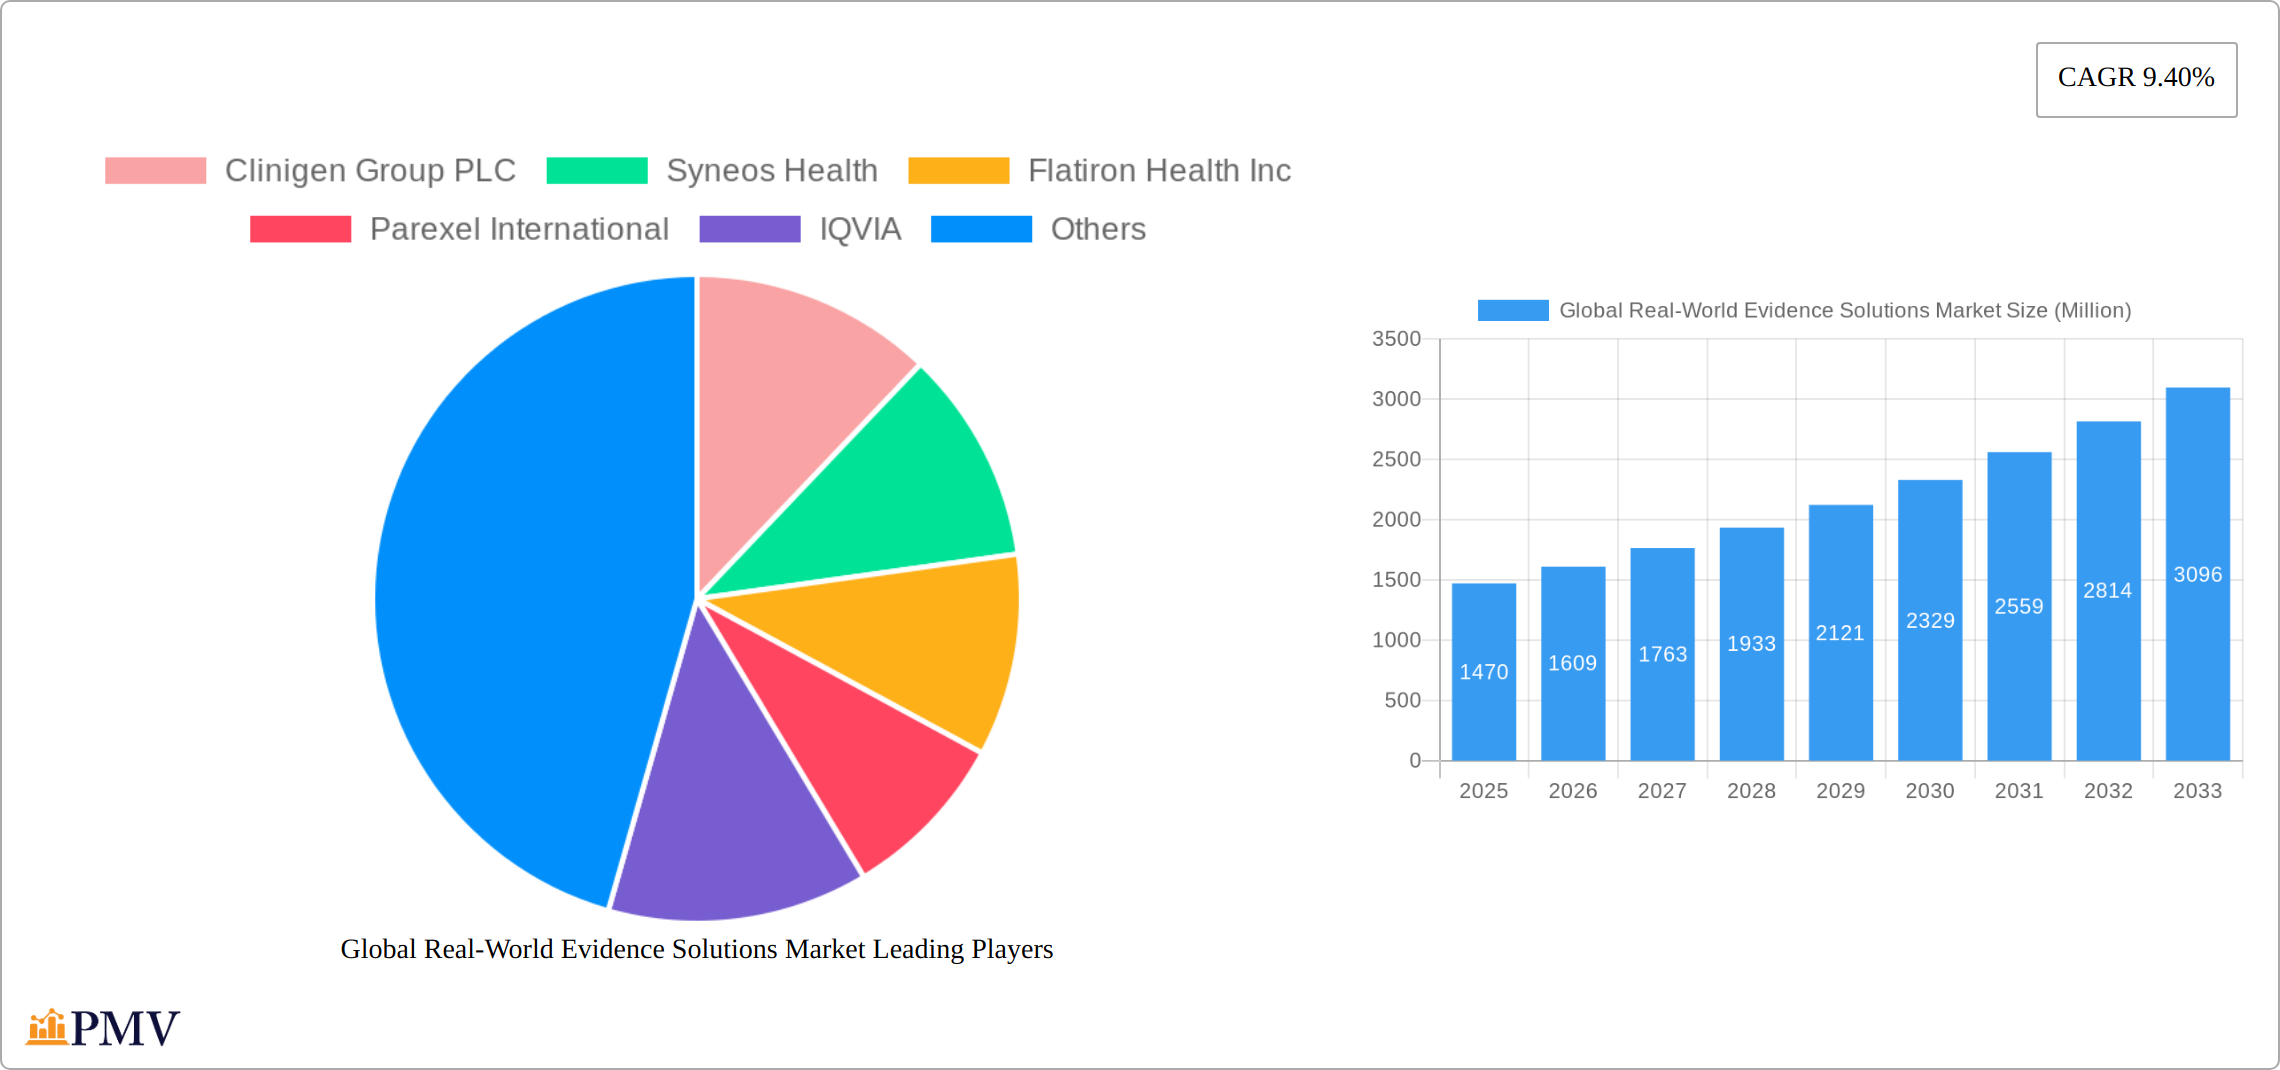
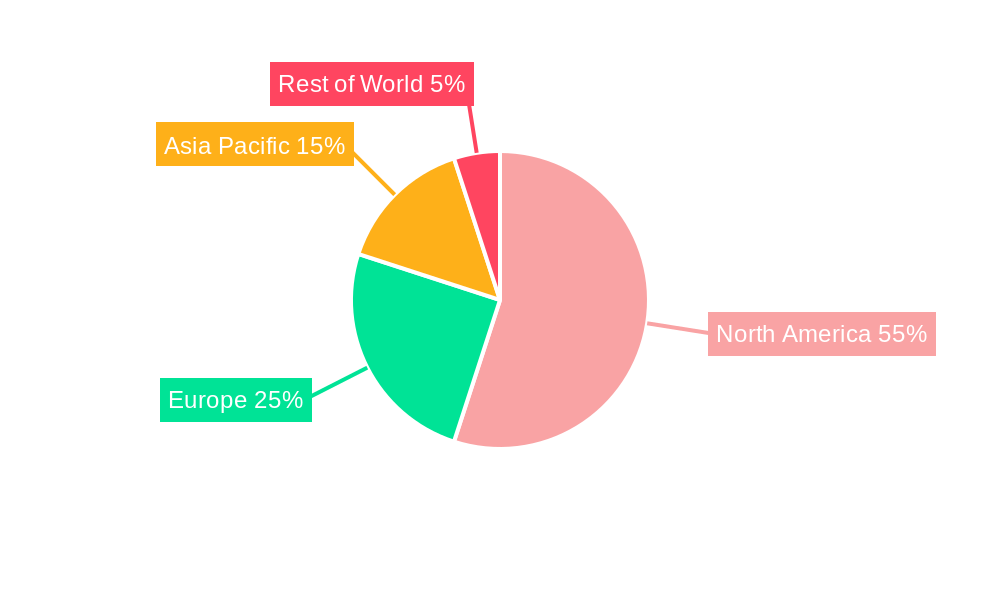
The Global Real-World Evidence (RWE) Solutions market is experiencing robust growth, projected to reach $1.47 billion in 2025 and maintain a Compound Annual Growth Rate (CAGR) of 9.40% from 2025 to 2033. This expansion is fueled by several key drivers. The increasing adoption of RWE by regulatory bodies for drug approvals and post-market surveillance is significantly boosting market demand. Furthermore, the rising prevalence of chronic diseases, coupled with the need for more cost-effective healthcare solutions, is driving the utilization of RWE to optimize treatment strategies and improve patient outcomes. Technological advancements, such as the development of sophisticated data analytics tools and improved data integration capabilities, are further accelerating market growth. The market is segmented by component (Claims Data, Clinical Settings Data, Patient-Powered Data, Pharmacy Data, and Other Components), therapeutic area (Oncology, Immunology, Neurology, Cardiovascular Disease, and Other Therapeutic Areas), and end-user (Healthcare Payers, Healthcare Providers, and Pharmaceutical & Medical Device Companies). North America currently holds a dominant market share due to advanced healthcare infrastructure and early adoption of RWE solutions. However, significant growth opportunities exist in the Asia Pacific region, driven by increasing healthcare expenditure and expanding digitalization initiatives.
The competitive landscape is characterized by a mix of established players and emerging technology companies. Major players like IQVIA, IBM, and Syneos Health are leveraging their established networks and expertise to capture significant market share. However, smaller companies focusing on niche technologies within the RWE ecosystem are also contributing to innovation and market expansion. Future growth will be influenced by factors such as data privacy regulations, interoperability challenges, and the continued development of advanced analytical capabilities to extract meaningful insights from increasingly complex datasets. The successful navigation of these challenges will determine the long-term trajectory of the RWE solutions market, promising substantial returns for those able to effectively leverage the power of real-world data.
This comprehensive report provides a detailed analysis of the Global Real-World Evidence (RWE) Solutions Market, offering invaluable insights for stakeholders across the healthcare ecosystem. Covering the period 2019-2033, with a focus on 2025, this report meticulously examines market dynamics, key players, technological advancements, and future growth prospects. The study incorporates extensive data analysis and expert insights to deliver actionable intelligence for strategic decision-making.
Global Real-World Evidence Solutions Market Market Structure & Competitive Dynamics
The global Real-World Evidence (RWE) solutions market presents a moderately consolidated structure, dominated by a few key players commanding substantial market share. This dynamic competitive landscape is characterized by relentless innovation, strategic mergers and acquisitions (M&A), and the ever-evolving regulatory environment. Leading companies are heavily investing in research and development (R&D) to refine their offerings and broaden their service portfolios. Competition is fierce, especially among established giants like IQVIA and Syneos Health. However, smaller, specialized firms focusing on particular data types or therapeutic areas also make significant contributions. The market concentration ratio (CR4) is projected to be approximately [Insert Updated CR4 Percentage]% in 2025, indicating a moderately concentrated market. M&A activity has been robust, with deal values exceeding [Insert Updated Deal Value] in the last five years. These transactions often involve collaborations focused on integrating data and enhancing analytical capabilities. End-user demands increasingly favor integrated solutions that seamlessly combine multiple data sources and advanced analytics to generate actionable insights, driving innovation in this space.
- Market Concentration: Moderately consolidated, with a projected CR4 of approximately [Insert Updated CR4 Percentage]%.
- Innovation Ecosystems: Robust, fueled by advancements in data analytics, artificial intelligence (AI), machine learning (ML), and cloud computing.
- Regulatory Frameworks: Continuously evolving, with a growing emphasis on data privacy and security significantly influencing data accessibility and analytical approaches.
- Product Substitutes: While limited direct substitutes exist, competition arises from alternative data sources and analytical methodologies.
- M&A Activity: High levels of M&A activity, with deal values exceeding [Insert Updated Deal Value] in recent years, showcasing strategic expansion and consolidation efforts within the market.
Global Real-World Evidence Solutions Market Industry Trends & Insights
The global RWE solutions market is experiencing robust growth, driven by several key factors. The increasing reliance on RWE in drug development and regulatory decision-making is a primary catalyst. Technological advancements, particularly in AI and ML, empower more sophisticated data analysis and the extraction of valuable insights from intricate datasets. The rising prevalence of chronic diseases and the demand for more cost-effective healthcare solutions are further stimulating market expansion. Consumer preferences for personalized medicine and patient-centric approaches are also significantly driving demand for RWE-based solutions. The market is projected to experience a Compound Annual Growth Rate (CAGR) of [Insert Updated CAGR]% during the forecast period (2025-2033), with market penetration expected to reach [Insert Updated Market Penetration]% by 2033. Competitive dynamics are shaped by continuous innovation, strategic partnerships, and the ongoing consolidation of the market. This growth trajectory is expected to continue, fueled by the increasing value placed on real-world data for improving healthcare outcomes and driving efficiencies across the healthcare ecosystem.
Dominant Markets & Segments in Global Real-World Evidence Solutions Market
The North American region currently holds the largest market share in the Global Real-World Evidence Solutions Market, driven by factors such as high healthcare spending, advanced healthcare infrastructure, and a strong regulatory framework supportive of RWE adoption. Within the segments, Claims Data holds the largest market share, driven by its widespread availability and relatively lower cost compared to other data sources. Oncology remains the dominant therapeutic area, due to the high cost of treatment and the need for evidence-based decision-making. Pharmaceutical & Medical Device Companies constitute the largest end-user segment, due to their significant investment in R&D and their reliance on RWE for drug development and commercialization.
- Leading Region: North America
- Dominant Component: Claims Data
- Leading Therapeutic Area: Oncology
- Largest End User: Pharmaceutical & Medical Device Companies
Key Drivers by Segment:
- Claims Data: Wide availability, relatively low cost, established infrastructure for data collection and analysis.
- Clinical Settings Data: Rich clinical information, increasing adoption of electronic health records (EHRs).
- Patient-Powered Data: Growing patient engagement, rise of digital health tools and platforms.
- Pharmacy Data: Detailed prescription data, insights into medication adherence and treatment effectiveness.
- Oncology: High treatment costs, need for evidence-based decision-making, growing prevalence of cancer.
- Immunology: Increasing prevalence of autoimmune diseases, need for personalized treatments.
- Neurology: High prevalence of neurological disorders, complex treatment pathways.
- Cardiovascular Disease: High prevalence, significant healthcare burden, need for cost-effective solutions.
- Pharmaceutical & Medical Device Companies: High investment in R&D, need for evidence-based decision-making.
- Healthcare Payers: Need for cost-effective healthcare solutions, evidence-based reimbursement decisions.
Global Real-World Evidence Solutions Market Product Innovations
Recent product innovations within the RWE solutions market are focused on enhancing data integration capabilities, incorporating sophisticated analytics techniques such as AI and ML, and developing user-friendly platforms for accessing and analyzing RWE data. These advancements streamline RWE generation, improve data quality and reliability, and enhance usability for various stakeholders. The widespread adoption of cloud-based solutions contributes to improved scalability and accessibility. These innovations are improving market fit by addressing the challenges of data integration, analysis, and interpretation, making RWE more accessible and actionable for a wider range of users, ultimately leading to more effective healthcare decision-making.
Report Segmentation & Scope
This report segments the Global Real-World Evidence Solutions Market by Component (Claims Data, Clinical Settings Data, Patient-Powered Data, Pharmacy Data, Other Components), Therapeutic Area (Oncology, Immunology, Neurology, Cardiovascular Disease, Other Therapeutic Areas), and End User (Healthcare Payers, Healthcare Providers, Pharmaceutical & Medical Device Companies, Other End Users). Each segment's market size, growth projections, and competitive landscape are analyzed. The report also provides a detailed analysis of market trends, growth drivers, challenges, and key players within each segment. Growth projections are based on a variety of factors, including technological advancements, regulatory changes, and economic trends. Competitive dynamics are influenced by factors such as pricing strategies, innovation, and market share.
Key Drivers of Global Real-World Evidence Solutions Market Growth
The market's substantial growth is fueled by several key factors, including the increasing adoption of RWE in healthcare decision-making driven by the need for cost-effective and evidence-based solutions. Technological advancements, particularly AI and ML, enable more sophisticated data analysis and improved insights. Supportive regulatory environments in various regions, promoting the use of RWE in drug development and approvals, further contribute to market expansion. Finally, the rising prevalence of chronic diseases and the growing demand for personalized medicine significantly propel the market's growth. The convergence of these factors creates a robust and expanding market for RWE solutions.
Challenges in the Global Real-World Evidence Solutions Market Sector
The Global Real-World Evidence Solutions Market faces several challenges. Data privacy and security concerns are paramount, requiring robust data protection measures. Data heterogeneity and inconsistencies across different data sources pose significant challenges to data integration and analysis. The high cost of acquiring and analyzing RWE can be a barrier for smaller players. Furthermore, the evolving regulatory landscape and lack of standardization across different regions create uncertainties. These factors can hinder market growth if not adequately addressed. The estimated impact of these challenges on market growth is xx% annually.
Leading Players in the Global Real-World Evidence Solutions Market Market
- Clinigen Group PLC
- Syneos Health
- Flatiron Health Inc
- Parexel International
- IQVIA
- SAS Institute
- Pharmaceutical Product Development (PPD Inc)
- Oracle Corporation
- PerkinElmer Inc
- IBM
- Icon PLC
Key Developments in Global Real-World Evidence Solutions Market Sector
- December 2021: EVERSANA partnered with Janssen Research & Development LLC to advance evidence-based development of Janssen therapies. This collaboration exemplifies the increasing reliance on RWE for drug development and commercialization.
- October 2021: The Real-World Evidence Transparency Initiative launched the Real-World Evidence Registry, promoting transparency and standardization in RWE analysis and reporting. This initiative represents a significant step towards enhancing the credibility and reliability of RWE.
- [Add more recent key developments with dates and brief descriptions]
Strategic Global Real-World Evidence Solutions Market Market Outlook
The Global Real-World Evidence Solutions Market presents significant growth opportunities in the coming years. Continued technological advancements, particularly in AI and ML, will enhance data analysis capabilities and unlock new insights from RWE. Increasing regulatory support for RWE adoption and the growing demand for personalized medicine will further drive market expansion. Strategic partnerships and collaborations among players will be crucial for leveraging diverse expertise and resources. Focusing on data security and addressing data privacy concerns will be critical for sustaining long-term growth and building trust. The market is poised for substantial growth, with significant potential for innovation and expansion across various therapeutic areas and end-user segments.
Global Real-World Evidence Solutions Market Segmentation
-
1. Component
- 1.1. Claims Data
- 1.2. Clinical Settings Data
- 1.3. Patient-Powered Data
- 1.4. Pharmacy Data
- 1.5. Other Components
-
2. Therapeutic Area
- 2.1. Oncology
- 2.2. Immunology
- 2.3. Neurology
- 2.4. Cardiovascular Disease
- 2.5. Other Therapeutic Areas
-
3. End User
- 3.1. Healthcare Payers
- 3.2. Healthcare Providers
- 3.3. Pharmaceutical & Medical Device Companies
- 3.4. Other End Users
Global Real-World Evidence Solutions Market Segmentation By Geography
-
1. North America
- 1.1. United States
- 1.2. Canada
- 1.3. Mexico
-
2. Europe
- 2.1. Germany
- 2.2. United Kingdom
- 2.3. France
- 2.4. Italy
- 2.5. Spain
- 2.6. Rest of Europe
-
3. Asia Pacific
- 3.1. China
- 3.2. Japan
- 3.3. India
- 3.4. Australia
- 3.5. South Korea
- 3.6. Rest of Asia Pacific
- 4. Middle East
-
5. GCC
- 5.1. South Africa
- 5.2. Rest of Middle East
-
6. South America
- 6.1. Brazil
- 6.2. Argentina
- 6.3. Rest of South America
Global Real-World Evidence Solutions Market REPORT HIGHLIGHTS
| Aspects | Details |
|---|---|
| Study Period | 2019-2033 |
| Base Year | 2024 |
| Estimated Year | 2025 |
| Forecast Period | 2025-2033 |
| Historical Period | 2019-2024 |
| Growth Rate | CAGR of 9.40% from 2019-2033 |
| Segmentation |
|
Table of Contents
- 1. Introduction
- 1.1. Research Scope
- 1.2. Market Segmentation
- 1.3. Research Methodology
- 1.4. Definitions and Assumptions
- 2. Executive Summary
- 2.1. Introduction
- 3. Market Dynamics
- 3.1. Introduction
- 3.2. Market Drivers
- 3.2.1. Shift From Volume- to Value-based Care; Increasing Aging Population and Prevalence of Chronic Diseases
- 3.3. Market Restrains
- 3.3.1. Unwillingness to Rely on Real-world Studies; Lack of Standards
- 3.4. Market Trends
- 3.4.1. Oncology is Anticipated to be the Dominant Segment During the Forecast Period
- 4. Market Factor Analysis
- 4.1. Porters Five Forces
- 4.2. Supply/Value Chain
- 4.3. PESTEL analysis
- 4.4. Market Entropy
- 4.5. Patent/Trademark Analysis
- 5. Global Real-World Evidence Solutions Market Analysis, Insights and Forecast, 2019-2031
- 5.1. Market Analysis, Insights and Forecast - by Component
- 5.1.1. Claims Data
- 5.1.2. Clinical Settings Data
- 5.1.3. Patient-Powered Data
- 5.1.4. Pharmacy Data
- 5.1.5. Other Components
- 5.2. Market Analysis, Insights and Forecast - by Therapeutic Area
- 5.2.1. Oncology
- 5.2.2. Immunology
- 5.2.3. Neurology
- 5.2.4. Cardiovascular Disease
- 5.2.5. Other Therapeutic Areas
- 5.3. Market Analysis, Insights and Forecast - by End User
- 5.3.1. Healthcare Payers
- 5.3.2. Healthcare Providers
- 5.3.3. Pharmaceutical & Medical Device Companies
- 5.3.4. Other End Users
- 5.4. Market Analysis, Insights and Forecast - by Region
- 5.4.1. North America
- 5.4.2. Europe
- 5.4.3. Asia Pacific
- 5.4.4. Middle East
- 5.4.5. GCC
- 5.4.6. South America
- 5.1. Market Analysis, Insights and Forecast - by Component
- 6. North America Global Real-World Evidence Solutions Market Analysis, Insights and Forecast, 2019-2031
- 6.1. Market Analysis, Insights and Forecast - by Component
- 6.1.1. Claims Data
- 6.1.2. Clinical Settings Data
- 6.1.3. Patient-Powered Data
- 6.1.4. Pharmacy Data
- 6.1.5. Other Components
- 6.2. Market Analysis, Insights and Forecast - by Therapeutic Area
- 6.2.1. Oncology
- 6.2.2. Immunology
- 6.2.3. Neurology
- 6.2.4. Cardiovascular Disease
- 6.2.5. Other Therapeutic Areas
- 6.3. Market Analysis, Insights and Forecast - by End User
- 6.3.1. Healthcare Payers
- 6.3.2. Healthcare Providers
- 6.3.3. Pharmaceutical & Medical Device Companies
- 6.3.4. Other End Users
- 6.1. Market Analysis, Insights and Forecast - by Component
- 7. Europe Global Real-World Evidence Solutions Market Analysis, Insights and Forecast, 2019-2031
- 7.1. Market Analysis, Insights and Forecast - by Component
- 7.1.1. Claims Data
- 7.1.2. Clinical Settings Data
- 7.1.3. Patient-Powered Data
- 7.1.4. Pharmacy Data
- 7.1.5. Other Components
- 7.2. Market Analysis, Insights and Forecast - by Therapeutic Area
- 7.2.1. Oncology
- 7.2.2. Immunology
- 7.2.3. Neurology
- 7.2.4. Cardiovascular Disease
- 7.2.5. Other Therapeutic Areas
- 7.3. Market Analysis, Insights and Forecast - by End User
- 7.3.1. Healthcare Payers
- 7.3.2. Healthcare Providers
- 7.3.3. Pharmaceutical & Medical Device Companies
- 7.3.4. Other End Users
- 7.1. Market Analysis, Insights and Forecast - by Component
- 8. Asia Pacific Global Real-World Evidence Solutions Market Analysis, Insights and Forecast, 2019-2031
- 8.1. Market Analysis, Insights and Forecast - by Component
- 8.1.1. Claims Data
- 8.1.2. Clinical Settings Data
- 8.1.3. Patient-Powered Data
- 8.1.4. Pharmacy Data
- 8.1.5. Other Components
- 8.2. Market Analysis, Insights and Forecast - by Therapeutic Area
- 8.2.1. Oncology
- 8.2.2. Immunology
- 8.2.3. Neurology
- 8.2.4. Cardiovascular Disease
- 8.2.5. Other Therapeutic Areas
- 8.3. Market Analysis, Insights and Forecast - by End User
- 8.3.1. Healthcare Payers
- 8.3.2. Healthcare Providers
- 8.3.3. Pharmaceutical & Medical Device Companies
- 8.3.4. Other End Users
- 8.1. Market Analysis, Insights and Forecast - by Component
- 9. Middle East Global Real-World Evidence Solutions Market Analysis, Insights and Forecast, 2019-2031
- 9.1. Market Analysis, Insights and Forecast - by Component
- 9.1.1. Claims Data
- 9.1.2. Clinical Settings Data
- 9.1.3. Patient-Powered Data
- 9.1.4. Pharmacy Data
- 9.1.5. Other Components
- 9.2. Market Analysis, Insights and Forecast - by Therapeutic Area
- 9.2.1. Oncology
- 9.2.2. Immunology
- 9.2.3. Neurology
- 9.2.4. Cardiovascular Disease
- 9.2.5. Other Therapeutic Areas
- 9.3. Market Analysis, Insights and Forecast - by End User
- 9.3.1. Healthcare Payers
- 9.3.2. Healthcare Providers
- 9.3.3. Pharmaceutical & Medical Device Companies
- 9.3.4. Other End Users
- 9.1. Market Analysis, Insights and Forecast - by Component
- 10. GCC Global Real-World Evidence Solutions Market Analysis, Insights and Forecast, 2019-2031
- 10.1. Market Analysis, Insights and Forecast - by Component
- 10.1.1. Claims Data
- 10.1.2. Clinical Settings Data
- 10.1.3. Patient-Powered Data
- 10.1.4. Pharmacy Data
- 10.1.5. Other Components
- 10.2. Market Analysis, Insights and Forecast - by Therapeutic Area
- 10.2.1. Oncology
- 10.2.2. Immunology
- 10.2.3. Neurology
- 10.2.4. Cardiovascular Disease
- 10.2.5. Other Therapeutic Areas
- 10.3. Market Analysis, Insights and Forecast - by End User
- 10.3.1. Healthcare Payers
- 10.3.2. Healthcare Providers
- 10.3.3. Pharmaceutical & Medical Device Companies
- 10.3.4. Other End Users
- 10.1. Market Analysis, Insights and Forecast - by Component
- 11. South America Global Real-World Evidence Solutions Market Analysis, Insights and Forecast, 2019-2031
- 11.1. Market Analysis, Insights and Forecast - by Component
- 11.1.1. Claims Data
- 11.1.2. Clinical Settings Data
- 11.1.3. Patient-Powered Data
- 11.1.4. Pharmacy Data
- 11.1.5. Other Components
- 11.2. Market Analysis, Insights and Forecast - by Therapeutic Area
- 11.2.1. Oncology
- 11.2.2. Immunology
- 11.2.3. Neurology
- 11.2.4. Cardiovascular Disease
- 11.2.5. Other Therapeutic Areas
- 11.3. Market Analysis, Insights and Forecast - by End User
- 11.3.1. Healthcare Payers
- 11.3.2. Healthcare Providers
- 11.3.3. Pharmaceutical & Medical Device Companies
- 11.3.4. Other End Users
- 11.1. Market Analysis, Insights and Forecast - by Component
- 12. North America Global Real-World Evidence Solutions Market Analysis, Insights and Forecast, 2019-2031
- 12.1. Market Analysis, Insights and Forecast - By Country/Sub-region
- 12.1.1 United States
- 12.1.2 Canada
- 12.1.3 Mexico
- 13. Europe Global Real-World Evidence Solutions Market Analysis, Insights and Forecast, 2019-2031
- 13.1. Market Analysis, Insights and Forecast - By Country/Sub-region
- 13.1.1 Germany
- 13.1.2 United Kingdom
- 13.1.3 France
- 13.1.4 Italy
- 13.1.5 Spain
- 13.1.6 Rest of Europe
- 14. Asia Pacific Global Real-World Evidence Solutions Market Analysis, Insights and Forecast, 2019-2031
- 14.1. Market Analysis, Insights and Forecast - By Country/Sub-region
- 14.1.1 China
- 14.1.2 Japan
- 14.1.3 India
- 14.1.4 Australia
- 14.1.5 South Korea
- 14.1.6 Rest of Asia Pacific
- 15. Middle East Global Real-World Evidence Solutions Market Analysis, Insights and Forecast, 2019-2031
- 15.1. Market Analysis, Insights and Forecast - By Country/Sub-region
- 15.1.1.
- 16. GCC Global Real-World Evidence Solutions Market Analysis, Insights and Forecast, 2019-2031
- 16.1. Market Analysis, Insights and Forecast - By Country/Sub-region
- 16.1.1 South Africa
- 16.1.2 Rest of Middle East
- 17. South America Global Real-World Evidence Solutions Market Analysis, Insights and Forecast, 2019-2031
- 17.1. Market Analysis, Insights and Forecast - By Country/Sub-region
- 17.1.1 Brazil
- 17.1.2 Argentina
- 17.1.3 Rest of South America
- 18. Competitive Analysis
- 18.1. Market Share Analysis 2024
- 18.2. Company Profiles
- 18.2.1 Clinigen Group PLC
- 18.2.1.1. Overview
- 18.2.1.2. Products
- 18.2.1.3. SWOT Analysis
- 18.2.1.4. Recent Developments
- 18.2.1.5. Financials (Based on Availability)
- 18.2.2 Syneos Health
- 18.2.2.1. Overview
- 18.2.2.2. Products
- 18.2.2.3. SWOT Analysis
- 18.2.2.4. Recent Developments
- 18.2.2.5. Financials (Based on Availability)
- 18.2.3 Flatiron Health Inc
- 18.2.3.1. Overview
- 18.2.3.2. Products
- 18.2.3.3. SWOT Analysis
- 18.2.3.4. Recent Developments
- 18.2.3.5. Financials (Based on Availability)
- 18.2.4 Parexel International
- 18.2.4.1. Overview
- 18.2.4.2. Products
- 18.2.4.3. SWOT Analysis
- 18.2.4.4. Recent Developments
- 18.2.4.5. Financials (Based on Availability)
- 18.2.5 IQVIA
- 18.2.5.1. Overview
- 18.2.5.2. Products
- 18.2.5.3. SWOT Analysis
- 18.2.5.4. Recent Developments
- 18.2.5.5. Financials (Based on Availability)
- 18.2.6 SAS Institute
- 18.2.6.1. Overview
- 18.2.6.2. Products
- 18.2.6.3. SWOT Analysis
- 18.2.6.4. Recent Developments
- 18.2.6.5. Financials (Based on Availability)
- 18.2.7 Pharmaceutical Product Development (PPD Inc )
- 18.2.7.1. Overview
- 18.2.7.2. Products
- 18.2.7.3. SWOT Analysis
- 18.2.7.4. Recent Developments
- 18.2.7.5. Financials (Based on Availability)
- 18.2.8 Oracle Corporation
- 18.2.8.1. Overview
- 18.2.8.2. Products
- 18.2.8.3. SWOT Analysis
- 18.2.8.4. Recent Developments
- 18.2.8.5. Financials (Based on Availability)
- 18.2.9 PerkinElmer Inc
- 18.2.9.1. Overview
- 18.2.9.2. Products
- 18.2.9.3. SWOT Analysis
- 18.2.9.4. Recent Developments
- 18.2.9.5. Financials (Based on Availability)
- 18.2.10 IBM
- 18.2.10.1. Overview
- 18.2.10.2. Products
- 18.2.10.3. SWOT Analysis
- 18.2.10.4. Recent Developments
- 18.2.10.5. Financials (Based on Availability)
- 18.2.11 Icon PLC
- 18.2.11.1. Overview
- 18.2.11.2. Products
- 18.2.11.3. SWOT Analysis
- 18.2.11.4. Recent Developments
- 18.2.11.5. Financials (Based on Availability)
- 18.2.1 Clinigen Group PLC
List of Figures
- Figure 1: Global Global Real-World Evidence Solutions Market Revenue Breakdown (Million, %) by Region 2024 & 2032
- Figure 2: North America Global Real-World Evidence Solutions Market Revenue (Million), by Country 2024 & 2032
- Figure 3: North America Global Real-World Evidence Solutions Market Revenue Share (%), by Country 2024 & 2032
- Figure 4: Europe Global Real-World Evidence Solutions Market Revenue (Million), by Country 2024 & 2032
- Figure 5: Europe Global Real-World Evidence Solutions Market Revenue Share (%), by Country 2024 & 2032
- Figure 6: Asia Pacific Global Real-World Evidence Solutions Market Revenue (Million), by Country 2024 & 2032
- Figure 7: Asia Pacific Global Real-World Evidence Solutions Market Revenue Share (%), by Country 2024 & 2032
- Figure 8: Middle East Global Real-World Evidence Solutions Market Revenue (Million), by Country 2024 & 2032
- Figure 9: Middle East Global Real-World Evidence Solutions Market Revenue Share (%), by Country 2024 & 2032
- Figure 10: GCC Global Real-World Evidence Solutions Market Revenue (Million), by Country 2024 & 2032
- Figure 11: GCC Global Real-World Evidence Solutions Market Revenue Share (%), by Country 2024 & 2032
- Figure 12: South America Global Real-World Evidence Solutions Market Revenue (Million), by Country 2024 & 2032
- Figure 13: South America Global Real-World Evidence Solutions Market Revenue Share (%), by Country 2024 & 2032
- Figure 14: North America Global Real-World Evidence Solutions Market Revenue (Million), by Component 2024 & 2032
- Figure 15: North America Global Real-World Evidence Solutions Market Revenue Share (%), by Component 2024 & 2032
- Figure 16: North America Global Real-World Evidence Solutions Market Revenue (Million), by Therapeutic Area 2024 & 2032
- Figure 17: North America Global Real-World Evidence Solutions Market Revenue Share (%), by Therapeutic Area 2024 & 2032
- Figure 18: North America Global Real-World Evidence Solutions Market Revenue (Million), by End User 2024 & 2032
- Figure 19: North America Global Real-World Evidence Solutions Market Revenue Share (%), by End User 2024 & 2032
- Figure 20: North America Global Real-World Evidence Solutions Market Revenue (Million), by Country 2024 & 2032
- Figure 21: North America Global Real-World Evidence Solutions Market Revenue Share (%), by Country 2024 & 2032
- Figure 22: Europe Global Real-World Evidence Solutions Market Revenue (Million), by Component 2024 & 2032
- Figure 23: Europe Global Real-World Evidence Solutions Market Revenue Share (%), by Component 2024 & 2032
- Figure 24: Europe Global Real-World Evidence Solutions Market Revenue (Million), by Therapeutic Area 2024 & 2032
- Figure 25: Europe Global Real-World Evidence Solutions Market Revenue Share (%), by Therapeutic Area 2024 & 2032
- Figure 26: Europe Global Real-World Evidence Solutions Market Revenue (Million), by End User 2024 & 2032
- Figure 27: Europe Global Real-World Evidence Solutions Market Revenue Share (%), by End User 2024 & 2032
- Figure 28: Europe Global Real-World Evidence Solutions Market Revenue (Million), by Country 2024 & 2032
- Figure 29: Europe Global Real-World Evidence Solutions Market Revenue Share (%), by Country 2024 & 2032
- Figure 30: Asia Pacific Global Real-World Evidence Solutions Market Revenue (Million), by Component 2024 & 2032
- Figure 31: Asia Pacific Global Real-World Evidence Solutions Market Revenue Share (%), by Component 2024 & 2032
- Figure 32: Asia Pacific Global Real-World Evidence Solutions Market Revenue (Million), by Therapeutic Area 2024 & 2032
- Figure 33: Asia Pacific Global Real-World Evidence Solutions Market Revenue Share (%), by Therapeutic Area 2024 & 2032
- Figure 34: Asia Pacific Global Real-World Evidence Solutions Market Revenue (Million), by End User 2024 & 2032
- Figure 35: Asia Pacific Global Real-World Evidence Solutions Market Revenue Share (%), by End User 2024 & 2032
- Figure 36: Asia Pacific Global Real-World Evidence Solutions Market Revenue (Million), by Country 2024 & 2032
- Figure 37: Asia Pacific Global Real-World Evidence Solutions Market Revenue Share (%), by Country 2024 & 2032
- Figure 38: Middle East Global Real-World Evidence Solutions Market Revenue (Million), by Component 2024 & 2032
- Figure 39: Middle East Global Real-World Evidence Solutions Market Revenue Share (%), by Component 2024 & 2032
- Figure 40: Middle East Global Real-World Evidence Solutions Market Revenue (Million), by Therapeutic Area 2024 & 2032
- Figure 41: Middle East Global Real-World Evidence Solutions Market Revenue Share (%), by Therapeutic Area 2024 & 2032
- Figure 42: Middle East Global Real-World Evidence Solutions Market Revenue (Million), by End User 2024 & 2032
- Figure 43: Middle East Global Real-World Evidence Solutions Market Revenue Share (%), by End User 2024 & 2032
- Figure 44: Middle East Global Real-World Evidence Solutions Market Revenue (Million), by Country 2024 & 2032
- Figure 45: Middle East Global Real-World Evidence Solutions Market Revenue Share (%), by Country 2024 & 2032
- Figure 46: GCC Global Real-World Evidence Solutions Market Revenue (Million), by Component 2024 & 2032
- Figure 47: GCC Global Real-World Evidence Solutions Market Revenue Share (%), by Component 2024 & 2032
- Figure 48: GCC Global Real-World Evidence Solutions Market Revenue (Million), by Therapeutic Area 2024 & 2032
- Figure 49: GCC Global Real-World Evidence Solutions Market Revenue Share (%), by Therapeutic Area 2024 & 2032
- Figure 50: GCC Global Real-World Evidence Solutions Market Revenue (Million), by End User 2024 & 2032
- Figure 51: GCC Global Real-World Evidence Solutions Market Revenue Share (%), by End User 2024 & 2032
- Figure 52: GCC Global Real-World Evidence Solutions Market Revenue (Million), by Country 2024 & 2032
- Figure 53: GCC Global Real-World Evidence Solutions Market Revenue Share (%), by Country 2024 & 2032
- Figure 54: South America Global Real-World Evidence Solutions Market Revenue (Million), by Component 2024 & 2032
- Figure 55: South America Global Real-World Evidence Solutions Market Revenue Share (%), by Component 2024 & 2032
- Figure 56: South America Global Real-World Evidence Solutions Market Revenue (Million), by Therapeutic Area 2024 & 2032
- Figure 57: South America Global Real-World Evidence Solutions Market Revenue Share (%), by Therapeutic Area 2024 & 2032
- Figure 58: South America Global Real-World Evidence Solutions Market Revenue (Million), by End User 2024 & 2032
- Figure 59: South America Global Real-World Evidence Solutions Market Revenue Share (%), by End User 2024 & 2032
- Figure 60: South America Global Real-World Evidence Solutions Market Revenue (Million), by Country 2024 & 2032
- Figure 61: South America Global Real-World Evidence Solutions Market Revenue Share (%), by Country 2024 & 2032
List of Tables
- Table 1: Global Real-World Evidence Solutions Market Revenue Million Forecast, by Region 2019 & 2032
- Table 2: Global Real-World Evidence Solutions Market Revenue Million Forecast, by Component 2019 & 2032
- Table 3: Global Real-World Evidence Solutions Market Revenue Million Forecast, by Therapeutic Area 2019 & 2032
- Table 4: Global Real-World Evidence Solutions Market Revenue Million Forecast, by End User 2019 & 2032
- Table 5: Global Real-World Evidence Solutions Market Revenue Million Forecast, by Region 2019 & 2032
- Table 6: Global Real-World Evidence Solutions Market Revenue Million Forecast, by Country 2019 & 2032
- Table 7: United States Global Real-World Evidence Solutions Market Revenue (Million) Forecast, by Application 2019 & 2032
- Table 8: Canada Global Real-World Evidence Solutions Market Revenue (Million) Forecast, by Application 2019 & 2032
- Table 9: Mexico Global Real-World Evidence Solutions Market Revenue (Million) Forecast, by Application 2019 & 2032
- Table 10: Global Real-World Evidence Solutions Market Revenue Million Forecast, by Country 2019 & 2032
- Table 11: Germany Global Real-World Evidence Solutions Market Revenue (Million) Forecast, by Application 2019 & 2032
- Table 12: United Kingdom Global Real-World Evidence Solutions Market Revenue (Million) Forecast, by Application 2019 & 2032
- Table 13: France Global Real-World Evidence Solutions Market Revenue (Million) Forecast, by Application 2019 & 2032
- Table 14: Italy Global Real-World Evidence Solutions Market Revenue (Million) Forecast, by Application 2019 & 2032
- Table 15: Spain Global Real-World Evidence Solutions Market Revenue (Million) Forecast, by Application 2019 & 2032
- Table 16: Rest of Europe Global Real-World Evidence Solutions Market Revenue (Million) Forecast, by Application 2019 & 2032
- Table 17: Global Real-World Evidence Solutions Market Revenue Million Forecast, by Country 2019 & 2032
- Table 18: China Global Real-World Evidence Solutions Market Revenue (Million) Forecast, by Application 2019 & 2032
- Table 19: Japan Global Real-World Evidence Solutions Market Revenue (Million) Forecast, by Application 2019 & 2032
- Table 20: India Global Real-World Evidence Solutions Market Revenue (Million) Forecast, by Application 2019 & 2032
- Table 21: Australia Global Real-World Evidence Solutions Market Revenue (Million) Forecast, by Application 2019 & 2032
- Table 22: South Korea Global Real-World Evidence Solutions Market Revenue (Million) Forecast, by Application 2019 & 2032
- Table 23: Rest of Asia Pacific Global Real-World Evidence Solutions Market Revenue (Million) Forecast, by Application 2019 & 2032
- Table 24: Global Real-World Evidence Solutions Market Revenue Million Forecast, by Country 2019 & 2032
- Table 25: Global Real-World Evidence Solutions Market Revenue (Million) Forecast, by Application 2019 & 2032
- Table 26: Global Real-World Evidence Solutions Market Revenue Million Forecast, by Country 2019 & 2032
- Table 27: South Africa Global Real-World Evidence Solutions Market Revenue (Million) Forecast, by Application 2019 & 2032
- Table 28: Rest of Middle East Global Real-World Evidence Solutions Market Revenue (Million) Forecast, by Application 2019 & 2032
- Table 29: Global Real-World Evidence Solutions Market Revenue Million Forecast, by Country 2019 & 2032
- Table 30: Brazil Global Real-World Evidence Solutions Market Revenue (Million) Forecast, by Application 2019 & 2032
- Table 31: Argentina Global Real-World Evidence Solutions Market Revenue (Million) Forecast, by Application 2019 & 2032
- Table 32: Rest of South America Global Real-World Evidence Solutions Market Revenue (Million) Forecast, by Application 2019 & 2032
- Table 33: Global Real-World Evidence Solutions Market Revenue Million Forecast, by Component 2019 & 2032
- Table 34: Global Real-World Evidence Solutions Market Revenue Million Forecast, by Therapeutic Area 2019 & 2032
- Table 35: Global Real-World Evidence Solutions Market Revenue Million Forecast, by End User 2019 & 2032
- Table 36: Global Real-World Evidence Solutions Market Revenue Million Forecast, by Country 2019 & 2032
- Table 37: United States Global Real-World Evidence Solutions Market Revenue (Million) Forecast, by Application 2019 & 2032
- Table 38: Canada Global Real-World Evidence Solutions Market Revenue (Million) Forecast, by Application 2019 & 2032
- Table 39: Mexico Global Real-World Evidence Solutions Market Revenue (Million) Forecast, by Application 2019 & 2032
- Table 40: Global Real-World Evidence Solutions Market Revenue Million Forecast, by Component 2019 & 2032
- Table 41: Global Real-World Evidence Solutions Market Revenue Million Forecast, by Therapeutic Area 2019 & 2032
- Table 42: Global Real-World Evidence Solutions Market Revenue Million Forecast, by End User 2019 & 2032
- Table 43: Global Real-World Evidence Solutions Market Revenue Million Forecast, by Country 2019 & 2032
- Table 44: Germany Global Real-World Evidence Solutions Market Revenue (Million) Forecast, by Application 2019 & 2032
- Table 45: United Kingdom Global Real-World Evidence Solutions Market Revenue (Million) Forecast, by Application 2019 & 2032
- Table 46: France Global Real-World Evidence Solutions Market Revenue (Million) Forecast, by Application 2019 & 2032
- Table 47: Italy Global Real-World Evidence Solutions Market Revenue (Million) Forecast, by Application 2019 & 2032
- Table 48: Spain Global Real-World Evidence Solutions Market Revenue (Million) Forecast, by Application 2019 & 2032
- Table 49: Rest of Europe Global Real-World Evidence Solutions Market Revenue (Million) Forecast, by Application 2019 & 2032
- Table 50: Global Real-World Evidence Solutions Market Revenue Million Forecast, by Component 2019 & 2032
- Table 51: Global Real-World Evidence Solutions Market Revenue Million Forecast, by Therapeutic Area 2019 & 2032
- Table 52: Global Real-World Evidence Solutions Market Revenue Million Forecast, by End User 2019 & 2032
- Table 53: Global Real-World Evidence Solutions Market Revenue Million Forecast, by Country 2019 & 2032
- Table 54: China Global Real-World Evidence Solutions Market Revenue (Million) Forecast, by Application 2019 & 2032
- Table 55: Japan Global Real-World Evidence Solutions Market Revenue (Million) Forecast, by Application 2019 & 2032
- Table 56: India Global Real-World Evidence Solutions Market Revenue (Million) Forecast, by Application 2019 & 2032
- Table 57: Australia Global Real-World Evidence Solutions Market Revenue (Million) Forecast, by Application 2019 & 2032
- Table 58: South Korea Global Real-World Evidence Solutions Market Revenue (Million) Forecast, by Application 2019 & 2032
- Table 59: Rest of Asia Pacific Global Real-World Evidence Solutions Market Revenue (Million) Forecast, by Application 2019 & 2032
- Table 60: Global Real-World Evidence Solutions Market Revenue Million Forecast, by Component 2019 & 2032
- Table 61: Global Real-World Evidence Solutions Market Revenue Million Forecast, by Therapeutic Area 2019 & 2032
- Table 62: Global Real-World Evidence Solutions Market Revenue Million Forecast, by End User 2019 & 2032
- Table 63: Global Real-World Evidence Solutions Market Revenue Million Forecast, by Country 2019 & 2032
- Table 64: Global Real-World Evidence Solutions Market Revenue Million Forecast, by Component 2019 & 2032
- Table 65: Global Real-World Evidence Solutions Market Revenue Million Forecast, by Therapeutic Area 2019 & 2032
- Table 66: Global Real-World Evidence Solutions Market Revenue Million Forecast, by End User 2019 & 2032
- Table 67: Global Real-World Evidence Solutions Market Revenue Million Forecast, by Country 2019 & 2032
- Table 68: South Africa Global Real-World Evidence Solutions Market Revenue (Million) Forecast, by Application 2019 & 2032
- Table 69: Rest of Middle East Global Real-World Evidence Solutions Market Revenue (Million) Forecast, by Application 2019 & 2032
- Table 70: Global Real-World Evidence Solutions Market Revenue Million Forecast, by Component 2019 & 2032
- Table 71: Global Real-World Evidence Solutions Market Revenue Million Forecast, by Therapeutic Area 2019 & 2032
- Table 72: Global Real-World Evidence Solutions Market Revenue Million Forecast, by End User 2019 & 2032
- Table 73: Global Real-World Evidence Solutions Market Revenue Million Forecast, by Country 2019 & 2032
- Table 74: Brazil Global Real-World Evidence Solutions Market Revenue (Million) Forecast, by Application 2019 & 2032
- Table 75: Argentina Global Real-World Evidence Solutions Market Revenue (Million) Forecast, by Application 2019 & 2032
- Table 76: Rest of South America Global Real-World Evidence Solutions Market Revenue (Million) Forecast, by Application 2019 & 2032
Frequently Asked Questions
1. What is the projected Compound Annual Growth Rate (CAGR) of the Global Real-World Evidence Solutions Market?
The projected CAGR is approximately 9.40%.
2. Which companies are prominent players in the Global Real-World Evidence Solutions Market?
Key companies in the market include Clinigen Group PLC, Syneos Health, Flatiron Health Inc, Parexel International, IQVIA, SAS Institute, Pharmaceutical Product Development (PPD Inc ), Oracle Corporation, PerkinElmer Inc, IBM, Icon PLC.
3. What are the main segments of the Global Real-World Evidence Solutions Market?
The market segments include Component, Therapeutic Area, End User.
4. Can you provide details about the market size?
The market size is estimated to be USD 1.47 Million as of 2022.
5. What are some drivers contributing to market growth?
Shift From Volume- to Value-based Care; Increasing Aging Population and Prevalence of Chronic Diseases.
6. What are the notable trends driving market growth?
Oncology is Anticipated to be the Dominant Segment During the Forecast Period.
7. Are there any restraints impacting market growth?
Unwillingness to Rely on Real-world Studies; Lack of Standards.
8. Can you provide examples of recent developments in the market?
In December 2021, EVERSANA signed an agreement with Janssen Research & Development LLC (Janssen) to drive evidence-based development of Janssen therapies, treatments, and patient support models.
9. What pricing options are available for accessing the report?
Pricing options include single-user, multi-user, and enterprise licenses priced at USD 4750, USD 5250, and USD 8750 respectively.
10. Is the market size provided in terms of value or volume?
The market size is provided in terms of value, measured in Million.
11. Are there any specific market keywords associated with the report?
Yes, the market keyword associated with the report is "Global Real-World Evidence Solutions Market," which aids in identifying and referencing the specific market segment covered.
12. How do I determine which pricing option suits my needs best?
The pricing options vary based on user requirements and access needs. Individual users may opt for single-user licenses, while businesses requiring broader access may choose multi-user or enterprise licenses for cost-effective access to the report.
13. Are there any additional resources or data provided in the Global Real-World Evidence Solutions Market report?
While the report offers comprehensive insights, it's advisable to review the specific contents or supplementary materials provided to ascertain if additional resources or data are available.
14. How can I stay updated on further developments or reports in the Global Real-World Evidence Solutions Market?
To stay informed about further developments, trends, and reports in the Global Real-World Evidence Solutions Market, consider subscribing to industry newsletters, following relevant companies and organizations, or regularly checking reputable industry news sources and publications.
Methodology
Step 1 - Identification of Relevant Samples Size from Population Database


Step 2 - Approaches for Defining Global Market Size (Value, Volume* & Price*)

Note*: In applicable scenarios
Step 3 - Data Sources
Primary Research
- Web Analytics
- Survey Reports
- Research Institute
- Latest Research Reports
- Opinion Leaders
Secondary Research
- Annual Reports
- White Paper
- Latest Press Release
- Industry Association
- Paid Database
- Investor Presentations

Step 4 - Data Triangulation
Involves using different sources of information in order to increase the validity of a study
These sources are likely to be stakeholders in a program - participants, other researchers, program staff, other community members, and so on.
Then we put all data in single framework & apply various statistical tools to find out the dynamic on the market.
During the analysis stage, feedback from the stakeholder groups would be compared to determine areas of agreement as well as areas of divergence


