
Key Insights
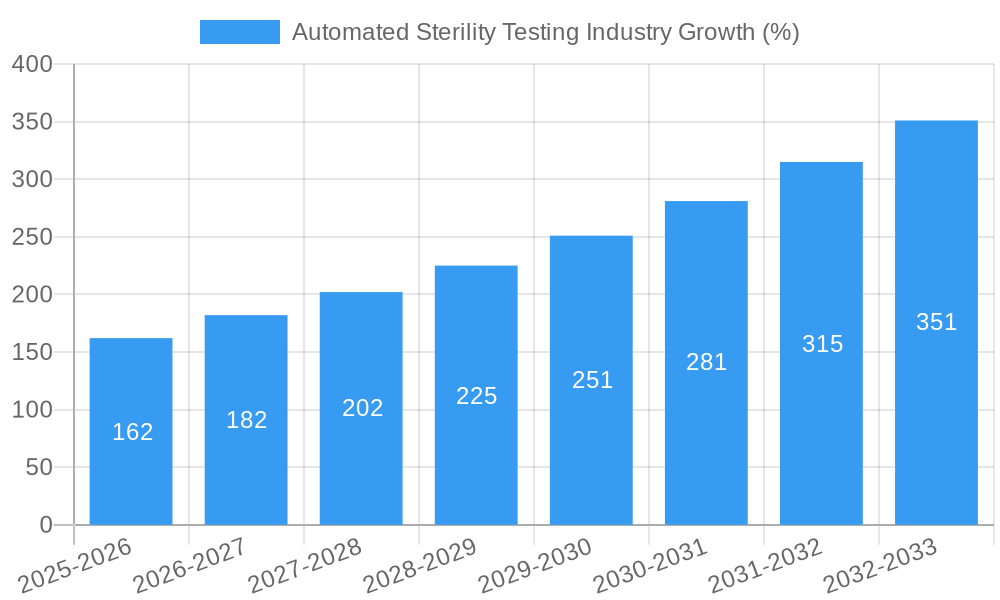
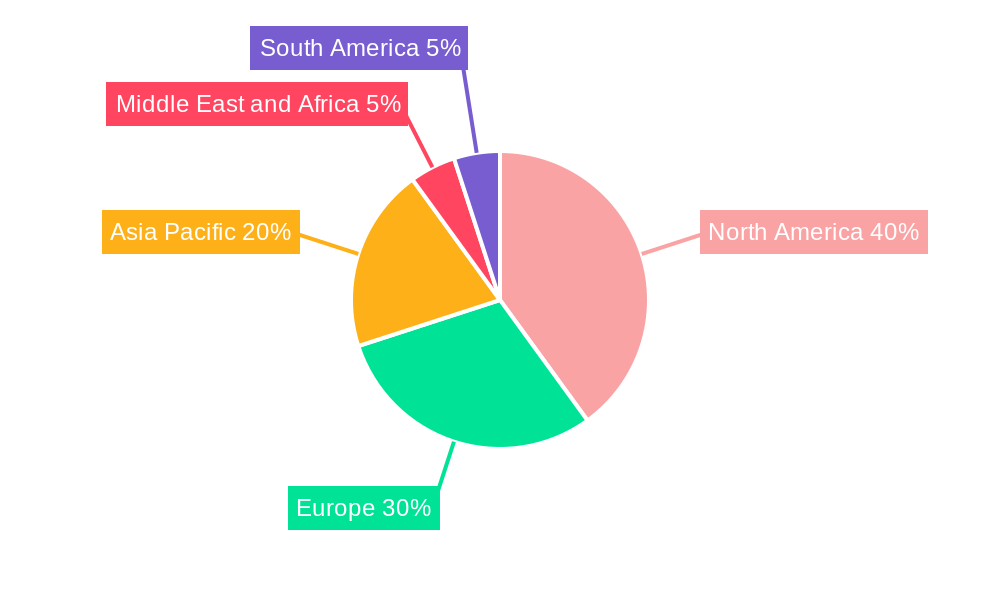
The automated sterility testing market is experiencing robust growth, driven by increasing demand for rapid and reliable sterility assurance in pharmaceutical and medical device manufacturing. The market, valued at $1.43 billion in 2025, is projected to expand at a Compound Annual Growth Rate (CAGR) of 11.10% from 2025 to 2033. This growth is fueled by several key factors. Stringent regulatory requirements for product sterility, particularly within the pharmaceutical industry, are pushing manufacturers to adopt automated solutions to improve efficiency, reduce human error, and enhance overall quality control. Furthermore, advancements in technology, such as the development of more sensitive and rapid testing methods like membrane filtration and direct inoculation, are driving market expansion. The increasing prevalence of chronic diseases and the consequent rise in demand for sterile pharmaceuticals and medical devices are additional catalysts. The market is segmented by test type (membrane filtration, direct inoculation, other), application (pharmaceutical and biological manufacturing, medical device manufacturing, other), and product type (instruments, kits and reagents, services). North America currently holds a significant market share due to the presence of established pharmaceutical and medical device companies and robust regulatory frameworks. However, the Asia-Pacific region is expected to witness the fastest growth rate due to rising healthcare expenditure and increasing manufacturing capabilities.
The competitive landscape comprises a mix of established players and emerging companies. Key players such as Charles River Laboratories, Merck KGaA, and Thermo Fisher Scientific are leveraging their strong R&D capabilities and market presence to maintain leadership. However, smaller, innovative companies are also making inroads by offering specialized solutions and advanced technologies. The market is witnessing a trend towards integrated solutions that combine automation with data analytics to provide comprehensive sterility assurance. This trend is expected to continue driving innovation and market growth in the coming years. While the market is expanding rapidly, challenges remain, including the high initial investment cost of automated systems and the need for skilled personnel to operate and maintain them. However, the long-term benefits of enhanced efficiency and reduced risk outweigh these challenges, further solidifying the market's growth trajectory.
Automated Sterility Testing Industry Market Report: 2019-2033
This comprehensive report provides an in-depth analysis of the Automated Sterility Testing industry, offering valuable insights for businesses, investors, and researchers. With a study period spanning 2019-2033, a base year of 2025, and a forecast period of 2025-2033, this report covers historical data (2019-2024) and future projections, offering a complete picture of this rapidly evolving market. The report’s market size valuation is in Millions of USD.

Automated Sterility Testing Industry Market Structure & Competitive Dynamics
The automated sterility testing market is characterized by a moderately concentrated landscape, with several major players and numerous smaller companies vying for market share. Major companies such as Charles River Laboratories, Merck KGaA, and Thermo Fisher Scientific hold significant positions, driven by their extensive product portfolios and global reach. However, the market also features a dynamic innovation ecosystem, with smaller companies introducing novel technologies and disrupting traditional methods. Stringent regulatory frameworks, particularly from agencies like the FDA and EMA, heavily influence market dynamics, demanding high levels of quality assurance and compliance. While traditional methods still exist, the market is shifting towards automation driven by increasing demands for speed, accuracy, and reduced labor costs. Product substitutes are limited, primarily focusing on variations in testing methodologies. End-user trends are towards increased outsourcing of testing to contract research organizations (CROs) due to cost and expertise considerations. M&A activity has been moderate in recent years, with deal values averaging xx Million USD, primarily focused on expanding product offerings and geographical reach. Market share data suggests a concentration at the top, with the top 5 companies accounting for approximately xx% of the global market.
Automated Sterility Testing Industry Industry Trends & Insights
The automated sterility testing market is experiencing robust growth, driven by several key factors. The increasing prevalence of infectious diseases and the rising demand for sterile pharmaceuticals and medical devices are major market drivers. Technological advancements, including the adoption of automation, rapid microbial detection techniques, and AI-powered analysis, are significantly enhancing testing efficiency and accuracy, fueling market expansion. The CAGR for the period 2025-2033 is estimated to be xx%, reflecting a substantial growth trajectory. Consumer preference is shifting towards faster, more reliable, and cost-effective testing solutions, which is further propelling market growth. Competitive dynamics are characterized by innovation, strategic partnerships, and expansion into new geographical markets. Market penetration of automated systems is increasing steadily, with xx% of the market expected to be automated by 2033. This increase is supported by a growing understanding of the benefits automation provides, coupled with improved regulatory approvals. The pharmaceutical and medical device sectors are the primary consumers, and their continued growth will significantly influence the market’s overall expansion.
Dominant Markets & Segments in Automated Sterility Testing Industry
The North American market holds a dominant position in the automated sterility testing industry, driven by robust pharmaceutical and medical device manufacturing sectors, stringent regulatory requirements, and high adoption rates of advanced technologies.
By Test Type: Membrane filtration remains the dominant test type, accounting for xx% of the market, due to its established reliability and widespread acceptance. Direct inoculation is also a significant segment, and other sterility tests are expected to show the most growth with a xx% CAGR.
By Application: Pharmaceutical and biological manufacturing is the largest application segment, accounting for xx% of market revenue, owing to stringent quality control regulations. Medical device manufacturing is another substantial segment, with its growth mirroring the expanding medical device market.
By Product Type: Instruments and kits/reagents are major revenue-generating segments, driven by increasing demand for high-throughput testing solutions. Services, including testing and consulting, are also seeing a significant growth, fueled by the outsourcing trend among pharmaceutical and medical device companies.
Key drivers in dominant regions include strong economic growth, robust healthcare infrastructure, and supportive regulatory environments. The established pharmaceutical and medical device industries in these regions, coupled with a strong focus on quality control, are pivotal in driving segment dominance.
Automated Sterility Testing Industry Product Innovations
The automated sterility testing industry is experiencing rapid innovation, driven by the need for faster, more accurate, and cost-effective solutions. Recent advancements significantly enhance the efficiency and reliability of sterility testing across pharmaceutical and medical device manufacturing. These innovations include the seamless integration of robotics for precise handling and automation of repetitive tasks, sophisticated imaging techniques for enhanced microbial detection and identification, and the application of artificial intelligence (AI) and machine learning (ML) algorithms for improved data analysis, predictive maintenance, and faster results. Miniaturization of testing systems is also gaining significant traction, enabling increased throughput and reducing overall testing times. This translates to substantial cost reductions and improved quality control, directly impacting the competitiveness of businesses within the sector. AI and ML are particularly impactful, offering capabilities such as anomaly detection, data pattern identification, and the prediction of potential issues, leading to proactive intervention and optimized resource allocation. The incorporation of these technologies is reshaping the competitive landscape, favoring companies that embrace automation and data-driven decision-making.
Report Segmentation & Scope
This report provides a comprehensive analysis of the automated sterility testing market, segmented by key parameters to offer granular insights. The market is categorized by test type (Membrane Filtration, Direct Inoculation, and Other Sterility Tests), application (Pharmaceutical and Biological Manufacturing, Medical Device Manufacturing, and Other Applications), and product type (Instruments, Kits and Reagents, and Services). Each segment is rigorously examined, detailing its market size, growth projections, and competitive dynamics. A key finding reveals a significant variation in growth projections across segments, with the "Other Sterility Tests" category anticipated to exhibit the most rapid expansion, followed by instruments within the product type segment. This underscores the evolving nature of sterility testing methods and the increasing demand for specialized solutions. The competitive landscape is analyzed across all segments, highlighting both established industry leaders and emerging players and their respective market strategies, thereby providing a holistic understanding of the market's competitive forces and future trajectory.
Key Drivers of Automated Sterility Testing Industry Growth
The growth of the automated sterility testing market is propelled by several converging factors. Stringent regulatory requirements for sterility assurance, implemented by agencies worldwide, are a primary driver, compelling manufacturers to adopt automated solutions to ensure compliance and mitigate risks associated with non-compliance. Furthermore, continuous technological advancements, such as the development and implementation of rapid microbial detection methods, significantly improve both the efficiency and accuracy of sterility testing. The increasing prevalence of infectious diseases globally, coupled with a growing demand for sterile pharmaceutical products and medical devices, further fuels the need for reliable and high-throughput sterility testing methods. Finally, the outsourcing trend within the industry, with many manufacturers opting to utilize the services of specialized Contract Research Organizations (CROs), contributes significantly to the increased demand for automated sterility testing services.
Challenges in the Automated Sterility Testing Industry Sector
High initial investment costs associated with purchasing and implementing automated sterility testing systems can be a significant barrier to adoption, particularly for smaller companies. Regulatory compliance and validation processes can be complex and time-consuming, requiring substantial resources. Supply chain disruptions can impact the availability of critical components, potentially delaying testing and impacting overall production schedules. Furthermore, intense competition from established players and new entrants creates a challenging market environment.
Leading Players in the Automated Sterility Testing Industry Market
- Charles River Laboratories
- Merck KGaA
- Rapid Micro Biosystems Inc
- Laboratory Corporation of America Holdings (TOXIKON)
- Sotera Health (Nelson Laboratories LLC)
- Sartorius AG
- SGS SA
- bioMerieux SA
- WuXi AppTec
- Pace Analytical
- Thermo Fisher Scientific
- STERIS
Key Developments in Automated Sterility Testing Industry Sector
- June 2022: STEMart's launch of comprehensive microbiology and sterility testing services for sterile, non-pyrogenic medical devices expanded the range of available services, intensifying competition and offering manufacturers broader testing options.
- June 2022: Berkshire Sterile Manufacturing's opening of a new sterility testing isolator represents a significant investment in in-house capabilities. This reduces their reliance on external testing services, potentially improving production efficiency and impacting their market competitiveness by streamlining workflows and enhancing control over testing processes. This internalization may also affect the market share of external testing providers.
Strategic Automated Sterility Testing Industry Market Outlook
The future of the automated sterility testing market is bright, with continued growth expected driven by technological innovation, increasing regulatory scrutiny, and the ongoing expansion of the pharmaceutical and medical device industries. Strategic opportunities exist in developing rapid and cost-effective testing methods, expanding into emerging markets, and focusing on specialized testing services. Companies that invest in research and development, strategic partnerships, and robust quality control systems are well-positioned to capture significant market share in the years to come. The increasing adoption of AI and machine learning presents a significant growth opportunity for market players.
Automated Sterility Testing Industry Segmentation
-
1. Product Type
- 1.1. Instruments
- 1.2. Kits and Reagents
- 1.3. Services
-
2. Test Type
- 2.1. Membrane Filtration
- 2.2. Direct Inoculation
- 2.3. Other Sterility Tests
-
3. Application
- 3.1. Pharmaceutical and Biological Manufacturing
- 3.2. Medical Device Manufacturing
- 3.3. Other Applications
Automated Sterility Testing Industry Segmentation By Geography
-
1. North America
- 1.1. United States
- 1.2. Canada
- 1.3. Mexico
-
2. Europe
- 2.1. Germany
- 2.2. United Kingdom
- 2.3. France
- 2.4. Italy
- 2.5. Spain
- 2.6. Rest of Europe
-
3. Asia Pacific
- 3.1. China
- 3.2. Japan
- 3.3. India
- 3.4. Australia
- 3.5. South Korea
- 3.6. Rest of Asia Pacific
-
4. Middle East and Africa
- 4.1. GCC
- 4.2. South Africa
- 4.3. Rest of Middle East and Africa
-
5. South America
- 5.1. Brazil
- 5.2. Argentina
- 5.3. Rest of South America
Automated Sterility Testing Industry REPORT HIGHLIGHTS
| Aspects | Details |
|---|---|
| Study Period | 2019-2033 |
| Base Year | 2024 |
| Estimated Year | 2025 |
| Forecast Period | 2025-2033 |
| Historical Period | 2019-2024 |
| Growth Rate | CAGR of 11.10% from 2019-2033 |
| Segmentation |
|
Table of Contents
- 1. Introduction
- 1.1. Research Scope
- 1.2. Market Segmentation
- 1.3. Research Methodology
- 1.4. Definitions and Assumptions
- 2. Executive Summary
- 2.1. Introduction
- 3. Market Dynamics
- 3.1. Introduction
- 3.2. Market Drivers
- 3.2.1. Increasing Research and Development in Life Sciences; Increasing Number of Drug Launches; Rise in Demand for Sterilized Products
- 3.3. Market Restrains
- 3.3.1. Stringent Regulatory Framework
- 3.4. Market Trends
- 3.4.1. Pharmaceutical and Biological Manufacturing Segment Expected to Grow Over the Forecast Period
- 4. Market Factor Analysis
- 4.1. Porters Five Forces
- 4.2. Supply/Value Chain
- 4.3. PESTEL analysis
- 4.4. Market Entropy
- 4.5. Patent/Trademark Analysis
- 5. Global Automated Sterility Testing Industry Analysis, Insights and Forecast, 2019-2031
- 5.1. Market Analysis, Insights and Forecast - by Product Type
- 5.1.1. Instruments
- 5.1.2. Kits and Reagents
- 5.1.3. Services
- 5.2. Market Analysis, Insights and Forecast - by Test Type
- 5.2.1. Membrane Filtration
- 5.2.2. Direct Inoculation
- 5.2.3. Other Sterility Tests
- 5.3. Market Analysis, Insights and Forecast - by Application
- 5.3.1. Pharmaceutical and Biological Manufacturing
- 5.3.2. Medical Device Manufacturing
- 5.3.3. Other Applications
- 5.4. Market Analysis, Insights and Forecast - by Region
- 5.4.1. North America
- 5.4.2. Europe
- 5.4.3. Asia Pacific
- 5.4.4. Middle East and Africa
- 5.4.5. South America
- 5.1. Market Analysis, Insights and Forecast - by Product Type
- 6. North America Automated Sterility Testing Industry Analysis, Insights and Forecast, 2019-2031
- 6.1. Market Analysis, Insights and Forecast - by Product Type
- 6.1.1. Instruments
- 6.1.2. Kits and Reagents
- 6.1.3. Services
- 6.2. Market Analysis, Insights and Forecast - by Test Type
- 6.2.1. Membrane Filtration
- 6.2.2. Direct Inoculation
- 6.2.3. Other Sterility Tests
- 6.3. Market Analysis, Insights and Forecast - by Application
- 6.3.1. Pharmaceutical and Biological Manufacturing
- 6.3.2. Medical Device Manufacturing
- 6.3.3. Other Applications
- 6.1. Market Analysis, Insights and Forecast - by Product Type
- 7. Europe Automated Sterility Testing Industry Analysis, Insights and Forecast, 2019-2031
- 7.1. Market Analysis, Insights and Forecast - by Product Type
- 7.1.1. Instruments
- 7.1.2. Kits and Reagents
- 7.1.3. Services
- 7.2. Market Analysis, Insights and Forecast - by Test Type
- 7.2.1. Membrane Filtration
- 7.2.2. Direct Inoculation
- 7.2.3. Other Sterility Tests
- 7.3. Market Analysis, Insights and Forecast - by Application
- 7.3.1. Pharmaceutical and Biological Manufacturing
- 7.3.2. Medical Device Manufacturing
- 7.3.3. Other Applications
- 7.1. Market Analysis, Insights and Forecast - by Product Type
- 8. Asia Pacific Automated Sterility Testing Industry Analysis, Insights and Forecast, 2019-2031
- 8.1. Market Analysis, Insights and Forecast - by Product Type
- 8.1.1. Instruments
- 8.1.2. Kits and Reagents
- 8.1.3. Services
- 8.2. Market Analysis, Insights and Forecast - by Test Type
- 8.2.1. Membrane Filtration
- 8.2.2. Direct Inoculation
- 8.2.3. Other Sterility Tests
- 8.3. Market Analysis, Insights and Forecast - by Application
- 8.3.1. Pharmaceutical and Biological Manufacturing
- 8.3.2. Medical Device Manufacturing
- 8.3.3. Other Applications
- 8.1. Market Analysis, Insights and Forecast - by Product Type
- 9. Middle East and Africa Automated Sterility Testing Industry Analysis, Insights and Forecast, 2019-2031
- 9.1. Market Analysis, Insights and Forecast - by Product Type
- 9.1.1. Instruments
- 9.1.2. Kits and Reagents
- 9.1.3. Services
- 9.2. Market Analysis, Insights and Forecast - by Test Type
- 9.2.1. Membrane Filtration
- 9.2.2. Direct Inoculation
- 9.2.3. Other Sterility Tests
- 9.3. Market Analysis, Insights and Forecast - by Application
- 9.3.1. Pharmaceutical and Biological Manufacturing
- 9.3.2. Medical Device Manufacturing
- 9.3.3. Other Applications
- 9.1. Market Analysis, Insights and Forecast - by Product Type
- 10. South America Automated Sterility Testing Industry Analysis, Insights and Forecast, 2019-2031
- 10.1. Market Analysis, Insights and Forecast - by Product Type
- 10.1.1. Instruments
- 10.1.2. Kits and Reagents
- 10.1.3. Services
- 10.2. Market Analysis, Insights and Forecast - by Test Type
- 10.2.1. Membrane Filtration
- 10.2.2. Direct Inoculation
- 10.2.3. Other Sterility Tests
- 10.3. Market Analysis, Insights and Forecast - by Application
- 10.3.1. Pharmaceutical and Biological Manufacturing
- 10.3.2. Medical Device Manufacturing
- 10.3.3. Other Applications
- 10.1. Market Analysis, Insights and Forecast - by Product Type
- 11. North America Automated Sterility Testing Industry Analysis, Insights and Forecast, 2019-2031
- 11.1. Market Analysis, Insights and Forecast - By Country/Sub-region
- 11.1.1 United States
- 11.1.2 Canada
- 11.1.3 Mexico
- 12. Europe Automated Sterility Testing Industry Analysis, Insights and Forecast, 2019-2031
- 12.1. Market Analysis, Insights and Forecast - By Country/Sub-region
- 12.1.1 Germany
- 12.1.2 United Kingdom
- 12.1.3 France
- 12.1.4 Italy
- 12.1.5 Spain
- 12.1.6 Rest of Europe
- 13. Asia Pacific Automated Sterility Testing Industry Analysis, Insights and Forecast, 2019-2031
- 13.1. Market Analysis, Insights and Forecast - By Country/Sub-region
- 13.1.1 China
- 13.1.2 Japan
- 13.1.3 India
- 13.1.4 Australia
- 13.1.5 South Korea
- 13.1.6 Rest of Asia Pacific
- 14. Middle East and Africa Automated Sterility Testing Industry Analysis, Insights and Forecast, 2019-2031
- 14.1. Market Analysis, Insights and Forecast - By Country/Sub-region
- 14.1.1 GCC
- 14.1.2 South Africa
- 14.1.3 Rest of Middle East and Africa
- 15. South America Automated Sterility Testing Industry Analysis, Insights and Forecast, 2019-2031
- 15.1. Market Analysis, Insights and Forecast - By Country/Sub-region
- 15.1.1 Brazil
- 15.1.2 Argentina
- 15.1.3 Rest of South America
- 16. Competitive Analysis
- 16.1. Global Market Share Analysis 2024
- 16.2. Company Profiles
- 16.2.1 Charles River Laboratories
- 16.2.1.1. Overview
- 16.2.1.2. Products
- 16.2.1.3. SWOT Analysis
- 16.2.1.4. Recent Developments
- 16.2.1.5. Financials (Based on Availability)
- 16.2.2 Merck KGaA
- 16.2.2.1. Overview
- 16.2.2.2. Products
- 16.2.2.3. SWOT Analysis
- 16.2.2.4. Recent Developments
- 16.2.2.5. Financials (Based on Availability)
- 16.2.3 Rapid Micro Biosystems Inc
- 16.2.3.1. Overview
- 16.2.3.2. Products
- 16.2.3.3. SWOT Analysis
- 16.2.3.4. Recent Developments
- 16.2.3.5. Financials (Based on Availability)
- 16.2.4 Laboratory Corporation of America Holdings (TOXIKON)
- 16.2.4.1. Overview
- 16.2.4.2. Products
- 16.2.4.3. SWOT Analysis
- 16.2.4.4. Recent Developments
- 16.2.4.5. Financials (Based on Availability)
- 16.2.5 Sotera Health (Nelson Laboratories LLC)
- 16.2.5.1. Overview
- 16.2.5.2. Products
- 16.2.5.3. SWOT Analysis
- 16.2.5.4. Recent Developments
- 16.2.5.5. Financials (Based on Availability)
- 16.2.6 Sartorius AG
- 16.2.6.1. Overview
- 16.2.6.2. Products
- 16.2.6.3. SWOT Analysis
- 16.2.6.4. Recent Developments
- 16.2.6.5. Financials (Based on Availability)
- 16.2.7 SGS SA
- 16.2.7.1. Overview
- 16.2.7.2. Products
- 16.2.7.3. SWOT Analysis
- 16.2.7.4. Recent Developments
- 16.2.7.5. Financials (Based on Availability)
- 16.2.8 bioMerieux SA
- 16.2.8.1. Overview
- 16.2.8.2. Products
- 16.2.8.3. SWOT Analysis
- 16.2.8.4. Recent Developments
- 16.2.8.5. Financials (Based on Availability)
- 16.2.9 WuXi AppTec
- 16.2.9.1. Overview
- 16.2.9.2. Products
- 16.2.9.3. SWOT Analysis
- 16.2.9.4. Recent Developments
- 16.2.9.5. Financials (Based on Availability)
- 16.2.10 Pace Analytical
- 16.2.10.1. Overview
- 16.2.10.2. Products
- 16.2.10.3. SWOT Analysis
- 16.2.10.4. Recent Developments
- 16.2.10.5. Financials (Based on Availability)
- 16.2.11 Thermo Fisher Scientific
- 16.2.11.1. Overview
- 16.2.11.2. Products
- 16.2.11.3. SWOT Analysis
- 16.2.11.4. Recent Developments
- 16.2.11.5. Financials (Based on Availability)
- 16.2.12 STERIS
- 16.2.12.1. Overview
- 16.2.12.2. Products
- 16.2.12.3. SWOT Analysis
- 16.2.12.4. Recent Developments
- 16.2.12.5. Financials (Based on Availability)
- 16.2.1 Charles River Laboratories
List of Figures
- Figure 1: Global Automated Sterility Testing Industry Revenue Breakdown (Million, %) by Region 2024 & 2032
- Figure 2: North America Automated Sterility Testing Industry Revenue (Million), by Country 2024 & 2032
- Figure 3: North America Automated Sterility Testing Industry Revenue Share (%), by Country 2024 & 2032
- Figure 4: Europe Automated Sterility Testing Industry Revenue (Million), by Country 2024 & 2032
- Figure 5: Europe Automated Sterility Testing Industry Revenue Share (%), by Country 2024 & 2032
- Figure 6: Asia Pacific Automated Sterility Testing Industry Revenue (Million), by Country 2024 & 2032
- Figure 7: Asia Pacific Automated Sterility Testing Industry Revenue Share (%), by Country 2024 & 2032
- Figure 8: Middle East and Africa Automated Sterility Testing Industry Revenue (Million), by Country 2024 & 2032
- Figure 9: Middle East and Africa Automated Sterility Testing Industry Revenue Share (%), by Country 2024 & 2032
- Figure 10: South America Automated Sterility Testing Industry Revenue (Million), by Country 2024 & 2032
- Figure 11: South America Automated Sterility Testing Industry Revenue Share (%), by Country 2024 & 2032
- Figure 12: North America Automated Sterility Testing Industry Revenue (Million), by Product Type 2024 & 2032
- Figure 13: North America Automated Sterility Testing Industry Revenue Share (%), by Product Type 2024 & 2032
- Figure 14: North America Automated Sterility Testing Industry Revenue (Million), by Test Type 2024 & 2032
- Figure 15: North America Automated Sterility Testing Industry Revenue Share (%), by Test Type 2024 & 2032
- Figure 16: North America Automated Sterility Testing Industry Revenue (Million), by Application 2024 & 2032
- Figure 17: North America Automated Sterility Testing Industry Revenue Share (%), by Application 2024 & 2032
- Figure 18: North America Automated Sterility Testing Industry Revenue (Million), by Country 2024 & 2032
- Figure 19: North America Automated Sterility Testing Industry Revenue Share (%), by Country 2024 & 2032
- Figure 20: Europe Automated Sterility Testing Industry Revenue (Million), by Product Type 2024 & 2032
- Figure 21: Europe Automated Sterility Testing Industry Revenue Share (%), by Product Type 2024 & 2032
- Figure 22: Europe Automated Sterility Testing Industry Revenue (Million), by Test Type 2024 & 2032
- Figure 23: Europe Automated Sterility Testing Industry Revenue Share (%), by Test Type 2024 & 2032
- Figure 24: Europe Automated Sterility Testing Industry Revenue (Million), by Application 2024 & 2032
- Figure 25: Europe Automated Sterility Testing Industry Revenue Share (%), by Application 2024 & 2032
- Figure 26: Europe Automated Sterility Testing Industry Revenue (Million), by Country 2024 & 2032
- Figure 27: Europe Automated Sterility Testing Industry Revenue Share (%), by Country 2024 & 2032
- Figure 28: Asia Pacific Automated Sterility Testing Industry Revenue (Million), by Product Type 2024 & 2032
- Figure 29: Asia Pacific Automated Sterility Testing Industry Revenue Share (%), by Product Type 2024 & 2032
- Figure 30: Asia Pacific Automated Sterility Testing Industry Revenue (Million), by Test Type 2024 & 2032
- Figure 31: Asia Pacific Automated Sterility Testing Industry Revenue Share (%), by Test Type 2024 & 2032
- Figure 32: Asia Pacific Automated Sterility Testing Industry Revenue (Million), by Application 2024 & 2032
- Figure 33: Asia Pacific Automated Sterility Testing Industry Revenue Share (%), by Application 2024 & 2032
- Figure 34: Asia Pacific Automated Sterility Testing Industry Revenue (Million), by Country 2024 & 2032
- Figure 35: Asia Pacific Automated Sterility Testing Industry Revenue Share (%), by Country 2024 & 2032
- Figure 36: Middle East and Africa Automated Sterility Testing Industry Revenue (Million), by Product Type 2024 & 2032
- Figure 37: Middle East and Africa Automated Sterility Testing Industry Revenue Share (%), by Product Type 2024 & 2032
- Figure 38: Middle East and Africa Automated Sterility Testing Industry Revenue (Million), by Test Type 2024 & 2032
- Figure 39: Middle East and Africa Automated Sterility Testing Industry Revenue Share (%), by Test Type 2024 & 2032
- Figure 40: Middle East and Africa Automated Sterility Testing Industry Revenue (Million), by Application 2024 & 2032
- Figure 41: Middle East and Africa Automated Sterility Testing Industry Revenue Share (%), by Application 2024 & 2032
- Figure 42: Middle East and Africa Automated Sterility Testing Industry Revenue (Million), by Country 2024 & 2032
- Figure 43: Middle East and Africa Automated Sterility Testing Industry Revenue Share (%), by Country 2024 & 2032
- Figure 44: South America Automated Sterility Testing Industry Revenue (Million), by Product Type 2024 & 2032
- Figure 45: South America Automated Sterility Testing Industry Revenue Share (%), by Product Type 2024 & 2032
- Figure 46: South America Automated Sterility Testing Industry Revenue (Million), by Test Type 2024 & 2032
- Figure 47: South America Automated Sterility Testing Industry Revenue Share (%), by Test Type 2024 & 2032
- Figure 48: South America Automated Sterility Testing Industry Revenue (Million), by Application 2024 & 2032
- Figure 49: South America Automated Sterility Testing Industry Revenue Share (%), by Application 2024 & 2032
- Figure 50: South America Automated Sterility Testing Industry Revenue (Million), by Country 2024 & 2032
- Figure 51: South America Automated Sterility Testing Industry Revenue Share (%), by Country 2024 & 2032
List of Tables
- Table 1: Global Automated Sterility Testing Industry Revenue Million Forecast, by Region 2019 & 2032
- Table 2: Global Automated Sterility Testing Industry Revenue Million Forecast, by Product Type 2019 & 2032
- Table 3: Global Automated Sterility Testing Industry Revenue Million Forecast, by Test Type 2019 & 2032
- Table 4: Global Automated Sterility Testing Industry Revenue Million Forecast, by Application 2019 & 2032
- Table 5: Global Automated Sterility Testing Industry Revenue Million Forecast, by Region 2019 & 2032
- Table 6: Global Automated Sterility Testing Industry Revenue Million Forecast, by Country 2019 & 2032
- Table 7: United States Automated Sterility Testing Industry Revenue (Million) Forecast, by Application 2019 & 2032
- Table 8: Canada Automated Sterility Testing Industry Revenue (Million) Forecast, by Application 2019 & 2032
- Table 9: Mexico Automated Sterility Testing Industry Revenue (Million) Forecast, by Application 2019 & 2032
- Table 10: Global Automated Sterility Testing Industry Revenue Million Forecast, by Country 2019 & 2032
- Table 11: Germany Automated Sterility Testing Industry Revenue (Million) Forecast, by Application 2019 & 2032
- Table 12: United Kingdom Automated Sterility Testing Industry Revenue (Million) Forecast, by Application 2019 & 2032
- Table 13: France Automated Sterility Testing Industry Revenue (Million) Forecast, by Application 2019 & 2032
- Table 14: Italy Automated Sterility Testing Industry Revenue (Million) Forecast, by Application 2019 & 2032
- Table 15: Spain Automated Sterility Testing Industry Revenue (Million) Forecast, by Application 2019 & 2032
- Table 16: Rest of Europe Automated Sterility Testing Industry Revenue (Million) Forecast, by Application 2019 & 2032
- Table 17: Global Automated Sterility Testing Industry Revenue Million Forecast, by Country 2019 & 2032
- Table 18: China Automated Sterility Testing Industry Revenue (Million) Forecast, by Application 2019 & 2032
- Table 19: Japan Automated Sterility Testing Industry Revenue (Million) Forecast, by Application 2019 & 2032
- Table 20: India Automated Sterility Testing Industry Revenue (Million) Forecast, by Application 2019 & 2032
- Table 21: Australia Automated Sterility Testing Industry Revenue (Million) Forecast, by Application 2019 & 2032
- Table 22: South Korea Automated Sterility Testing Industry Revenue (Million) Forecast, by Application 2019 & 2032
- Table 23: Rest of Asia Pacific Automated Sterility Testing Industry Revenue (Million) Forecast, by Application 2019 & 2032
- Table 24: Global Automated Sterility Testing Industry Revenue Million Forecast, by Country 2019 & 2032
- Table 25: GCC Automated Sterility Testing Industry Revenue (Million) Forecast, by Application 2019 & 2032
- Table 26: South Africa Automated Sterility Testing Industry Revenue (Million) Forecast, by Application 2019 & 2032
- Table 27: Rest of Middle East and Africa Automated Sterility Testing Industry Revenue (Million) Forecast, by Application 2019 & 2032
- Table 28: Global Automated Sterility Testing Industry Revenue Million Forecast, by Country 2019 & 2032
- Table 29: Brazil Automated Sterility Testing Industry Revenue (Million) Forecast, by Application 2019 & 2032
- Table 30: Argentina Automated Sterility Testing Industry Revenue (Million) Forecast, by Application 2019 & 2032
- Table 31: Rest of South America Automated Sterility Testing Industry Revenue (Million) Forecast, by Application 2019 & 2032
- Table 32: Global Automated Sterility Testing Industry Revenue Million Forecast, by Product Type 2019 & 2032
- Table 33: Global Automated Sterility Testing Industry Revenue Million Forecast, by Test Type 2019 & 2032
- Table 34: Global Automated Sterility Testing Industry Revenue Million Forecast, by Application 2019 & 2032
- Table 35: Global Automated Sterility Testing Industry Revenue Million Forecast, by Country 2019 & 2032
- Table 36: United States Automated Sterility Testing Industry Revenue (Million) Forecast, by Application 2019 & 2032
- Table 37: Canada Automated Sterility Testing Industry Revenue (Million) Forecast, by Application 2019 & 2032
- Table 38: Mexico Automated Sterility Testing Industry Revenue (Million) Forecast, by Application 2019 & 2032
- Table 39: Global Automated Sterility Testing Industry Revenue Million Forecast, by Product Type 2019 & 2032
- Table 40: Global Automated Sterility Testing Industry Revenue Million Forecast, by Test Type 2019 & 2032
- Table 41: Global Automated Sterility Testing Industry Revenue Million Forecast, by Application 2019 & 2032
- Table 42: Global Automated Sterility Testing Industry Revenue Million Forecast, by Country 2019 & 2032
- Table 43: Germany Automated Sterility Testing Industry Revenue (Million) Forecast, by Application 2019 & 2032
- Table 44: United Kingdom Automated Sterility Testing Industry Revenue (Million) Forecast, by Application 2019 & 2032
- Table 45: France Automated Sterility Testing Industry Revenue (Million) Forecast, by Application 2019 & 2032
- Table 46: Italy Automated Sterility Testing Industry Revenue (Million) Forecast, by Application 2019 & 2032
- Table 47: Spain Automated Sterility Testing Industry Revenue (Million) Forecast, by Application 2019 & 2032
- Table 48: Rest of Europe Automated Sterility Testing Industry Revenue (Million) Forecast, by Application 2019 & 2032
- Table 49: Global Automated Sterility Testing Industry Revenue Million Forecast, by Product Type 2019 & 2032
- Table 50: Global Automated Sterility Testing Industry Revenue Million Forecast, by Test Type 2019 & 2032
- Table 51: Global Automated Sterility Testing Industry Revenue Million Forecast, by Application 2019 & 2032
- Table 52: Global Automated Sterility Testing Industry Revenue Million Forecast, by Country 2019 & 2032
- Table 53: China Automated Sterility Testing Industry Revenue (Million) Forecast, by Application 2019 & 2032
- Table 54: Japan Automated Sterility Testing Industry Revenue (Million) Forecast, by Application 2019 & 2032
- Table 55: India Automated Sterility Testing Industry Revenue (Million) Forecast, by Application 2019 & 2032
- Table 56: Australia Automated Sterility Testing Industry Revenue (Million) Forecast, by Application 2019 & 2032
- Table 57: South Korea Automated Sterility Testing Industry Revenue (Million) Forecast, by Application 2019 & 2032
- Table 58: Rest of Asia Pacific Automated Sterility Testing Industry Revenue (Million) Forecast, by Application 2019 & 2032
- Table 59: Global Automated Sterility Testing Industry Revenue Million Forecast, by Product Type 2019 & 2032
- Table 60: Global Automated Sterility Testing Industry Revenue Million Forecast, by Test Type 2019 & 2032
- Table 61: Global Automated Sterility Testing Industry Revenue Million Forecast, by Application 2019 & 2032
- Table 62: Global Automated Sterility Testing Industry Revenue Million Forecast, by Country 2019 & 2032
- Table 63: GCC Automated Sterility Testing Industry Revenue (Million) Forecast, by Application 2019 & 2032
- Table 64: South Africa Automated Sterility Testing Industry Revenue (Million) Forecast, by Application 2019 & 2032
- Table 65: Rest of Middle East and Africa Automated Sterility Testing Industry Revenue (Million) Forecast, by Application 2019 & 2032
- Table 66: Global Automated Sterility Testing Industry Revenue Million Forecast, by Product Type 2019 & 2032
- Table 67: Global Automated Sterility Testing Industry Revenue Million Forecast, by Test Type 2019 & 2032
- Table 68: Global Automated Sterility Testing Industry Revenue Million Forecast, by Application 2019 & 2032
- Table 69: Global Automated Sterility Testing Industry Revenue Million Forecast, by Country 2019 & 2032
- Table 70: Brazil Automated Sterility Testing Industry Revenue (Million) Forecast, by Application 2019 & 2032
- Table 71: Argentina Automated Sterility Testing Industry Revenue (Million) Forecast, by Application 2019 & 2032
- Table 72: Rest of South America Automated Sterility Testing Industry Revenue (Million) Forecast, by Application 2019 & 2032
Frequently Asked Questions
1. What is the projected Compound Annual Growth Rate (CAGR) of the Automated Sterility Testing Industry?
The projected CAGR is approximately 11.10%.
2. Which companies are prominent players in the Automated Sterility Testing Industry?
Key companies in the market include Charles River Laboratories, Merck KGaA, Rapid Micro Biosystems Inc, Laboratory Corporation of America Holdings (TOXIKON), Sotera Health (Nelson Laboratories LLC), Sartorius AG, SGS SA, bioMerieux SA, WuXi AppTec, Pace Analytical, Thermo Fisher Scientific, STERIS.
3. What are the main segments of the Automated Sterility Testing Industry?
The market segments include Product Type, Test Type, Application.
4. Can you provide details about the market size?
The market size is estimated to be USD 1.43 Million as of 2022.
5. What are some drivers contributing to market growth?
Increasing Research and Development in Life Sciences; Increasing Number of Drug Launches; Rise in Demand for Sterilized Products.
6. What are the notable trends driving market growth?
Pharmaceutical and Biological Manufacturing Segment Expected to Grow Over the Forecast Period.
7. Are there any restraints impacting market growth?
Stringent Regulatory Framework.
8. Can you provide examples of recent developments in the market?
Jun 2022: STEMart launched comprehensive microbiology and sterility testing for sterile, non-pyrogenic medical devices.
9. What pricing options are available for accessing the report?
Pricing options include single-user, multi-user, and enterprise licenses priced at USD 4750, USD 5250, and USD 8750 respectively.
10. Is the market size provided in terms of value or volume?
The market size is provided in terms of value, measured in Million.
11. Are there any specific market keywords associated with the report?
Yes, the market keyword associated with the report is "Automated Sterility Testing Industry," which aids in identifying and referencing the specific market segment covered.
12. How do I determine which pricing option suits my needs best?
The pricing options vary based on user requirements and access needs. Individual users may opt for single-user licenses, while businesses requiring broader access may choose multi-user or enterprise licenses for cost-effective access to the report.
13. Are there any additional resources or data provided in the Automated Sterility Testing Industry report?
While the report offers comprehensive insights, it's advisable to review the specific contents or supplementary materials provided to ascertain if additional resources or data are available.
14. How can I stay updated on further developments or reports in the Automated Sterility Testing Industry?
To stay informed about further developments, trends, and reports in the Automated Sterility Testing Industry, consider subscribing to industry newsletters, following relevant companies and organizations, or regularly checking reputable industry news sources and publications.
Methodology
Step 1 - Identification of Relevant Samples Size from Population Database


Step 2 - Approaches for Defining Global Market Size (Value, Volume* & Price*)

Note*: In applicable scenarios
Step 3 - Data Sources
Primary Research
- Web Analytics
- Survey Reports
- Research Institute
- Latest Research Reports
- Opinion Leaders
Secondary Research
- Annual Reports
- White Paper
- Latest Press Release
- Industry Association
- Paid Database
- Investor Presentations

Step 4 - Data Triangulation
Involves using different sources of information in order to increase the validity of a study
These sources are likely to be stakeholders in a program - participants, other researchers, program staff, other community members, and so on.
Then we put all data in single framework & apply various statistical tools to find out the dynamic on the market.
During the analysis stage, feedback from the stakeholder groups would be compared to determine areas of agreement as well as areas of divergence


