
Key Insights
The global urology imaging equipment market is experiencing robust growth, driven by several key factors. Technological advancements, such as the development of higher-resolution imaging systems (including advanced ultrasound, fluoroscopy, and MRI systems specifically designed for urological applications), are enhancing diagnostic capabilities and leading to earlier and more accurate diagnoses of urological conditions. The rising prevalence of urological diseases, including prostate cancer, kidney stones, and bladder cancer, coupled with an aging global population, is significantly increasing the demand for these sophisticated imaging tools. Minimally invasive surgical procedures are also gaining traction, demanding more precise and detailed imaging guidance, thus boosting market growth. Furthermore, the increasing adoption of advanced imaging techniques within urology departments of hospitals and specialized clinics, facilitated by rising healthcare spending and better insurance coverage in many developed and developing nations, contributes significantly to market expansion.
However, the market faces certain challenges. High initial investment costs for sophisticated equipment, coupled with ongoing maintenance and service expenses, can pose a barrier to entry for smaller clinics and healthcare providers. Regulatory hurdles and the need for stringent quality control measures for medical devices also add complexity to market growth. Despite these challenges, the long-term outlook for the urology imaging equipment market remains positive, driven by ongoing technological innovations, increasing healthcare awareness, and the growing demand for improved patient outcomes. We project a steady and continuous market expansion throughout the forecast period (2025-2033). The competitive landscape is marked by established players such as Stryker, Olympus, and Siemens Healthineers, along with several other significant companies actively participating in this dynamic market.
Urology Imaging Equipment Market Report: 2019-2033
This comprehensive report provides a detailed analysis of the global Urology Imaging Equipment market, offering invaluable insights for stakeholders, investors, and industry professionals. Covering the period from 2019 to 2033, with a base year of 2025 and a forecast period of 2025-2033, this report meticulously examines market structure, competitive dynamics, industry trends, and future growth prospects. The market is projected to reach a value of $XX million by 2033, demonstrating substantial growth potential.
Urology Imaging Equipment Market Structure & Competitive Dynamics
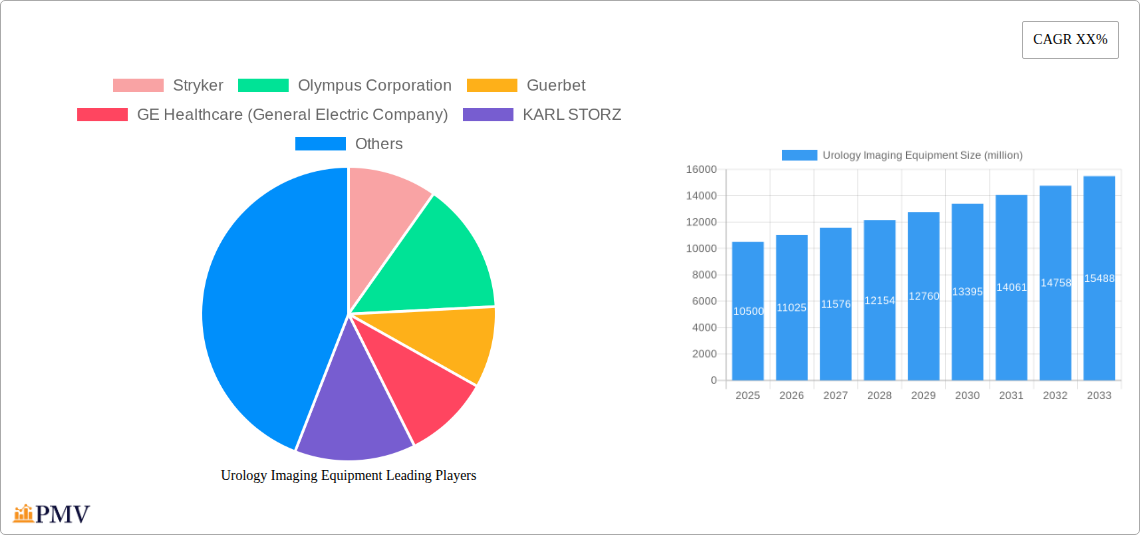
The global urology imaging equipment market exhibits a moderately consolidated structure, with several key players commanding significant market share. The market concentration ratio (CR4) is estimated at XX%, indicating a competitive landscape with both established giants and emerging innovative companies. Innovation ecosystems are vibrant, driven by ongoing R&D investments exceeding $XX million annually, focused on advancements in image resolution, minimally invasive procedures, and AI-powered diagnostic tools. Regulatory frameworks, such as those set by the FDA and similar bodies globally, play a crucial role in shaping market access and product approvals. The market also witnesses continuous M&A activity, with deal values exceeding $XX million in the last five years, reflecting strategic consolidation and expansion efforts. Product substitutes, such as advanced diagnostic techniques, pose moderate competitive pressure. End-user trends indicate a growing preference for advanced imaging modalities offering improved precision and reduced procedure times.
- Market Share (2024 Estimate): Stryker: XX%; Olympus Corporation: XX%; GE Healthcare: XX%; Siemens Healthineers: XX%; Others: XX%.
- M&A Activity (2019-2024): Total deal value exceeding $XX million, with an average deal size of $XX million. Key deals included [mention specific notable M&A deals if available, otherwise use “strategic acquisitions focused on technology enhancement and market expansion.”]
Urology Imaging Equipment Industry Trends & Insights
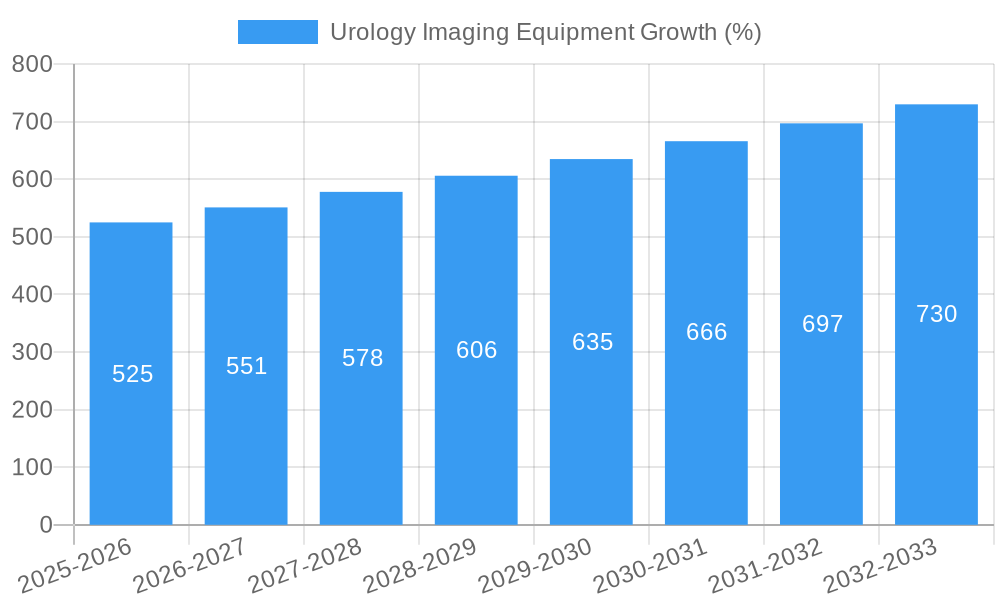
The urology imaging equipment market is experiencing robust growth, driven by several key factors. The rising prevalence of urological diseases, particularly among aging populations, is fueling demand for advanced diagnostic and therapeutic tools. Technological advancements, such as the integration of artificial intelligence (AI) and machine learning (ML) algorithms for improved image analysis and diagnosis, are significantly enhancing market growth. This is further propelled by the increasing adoption of minimally invasive surgical techniques, which rely heavily on precise imaging guidance. Consumer preferences are shifting toward faster, less invasive, and more accurate imaging solutions. Competitive dynamics are characterized by continuous innovation, product differentiation, and strategic partnerships. The market is expected to witness a compound annual growth rate (CAGR) of XX% during the forecast period (2025-2033), with market penetration expected to reach XX% by 2033.
Dominant Markets & Segments in Urology Imaging Equipment
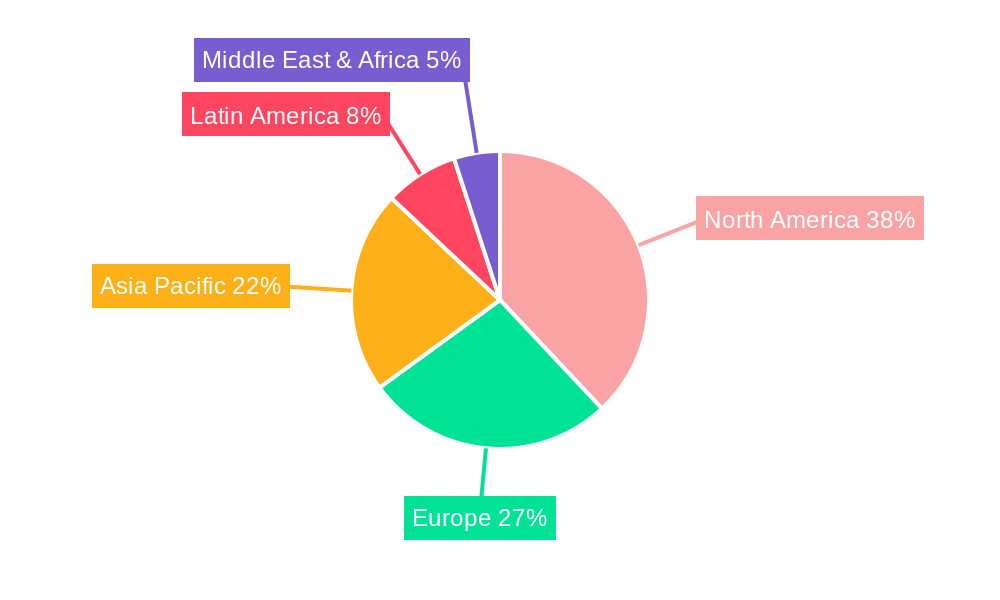
The North American region holds the dominant position in the global urology imaging equipment market, driven by factors such as robust healthcare infrastructure, high healthcare expenditure, and a sizable aging population. The US contributes significantly to this dominance.
- Key Drivers in North America:
- High healthcare expenditure per capita.
- Well-developed healthcare infrastructure.
- Advanced technological adoption rates.
- Favorable regulatory environment.
- High prevalence of urological diseases.
The dominance of North America is primarily attributed to several factors. Firstly, the region boasts a well-established healthcare infrastructure, including a large number of hospitals and specialized clinics equipped with advanced imaging technologies. Secondly, high healthcare expenditure per capita ensures substantial funding for new technologies and treatments. Thirdly, the large and aging population in North America contributes significantly to the prevalence of urological diseases, thereby increasing the demand for diagnostic and therapeutic tools.
Urology Imaging Equipment Product Innovations
Recent product developments focus on enhancing image quality, reducing procedure times, and improving diagnostic accuracy. Innovations include advanced ultrasound systems with enhanced resolution, minimally invasive robotic surgery platforms integrated with real-time imaging, and AI-powered image analysis tools that assist in early detection and diagnosis. These innovations are gaining traction due to their improved efficiency and patient outcomes, directly impacting market competitiveness.
Report Segmentation & Scope
The report segments the market by product type (e.g., ultrasound, fluoroscopy, MRI, CT), application (e.g., diagnosis, surgery), end-user (hospitals, clinics, ambulatory surgical centers), and geography (North America, Europe, Asia Pacific, Rest of World). Each segment provides detailed market size, growth projections, and competitive analysis. For instance, the ultrasound segment is projected to experience the highest CAGR due to its cost-effectiveness and widespread accessibility.
Key Drivers of Urology Imaging Equipment Growth
Several key factors contribute to the growth of the urology imaging equipment market. Technological advancements, such as the development of AI-powered diagnostic tools and minimally invasive surgical techniques, are significantly enhancing market demand. Economic factors, such as rising healthcare expenditure and increasing insurance coverage for advanced medical procedures, also play a pivotal role. Furthermore, supportive regulatory frameworks that encourage innovation and adoption of advanced medical technologies are fueling market expansion.
Challenges in the Urology Imaging Equipment Sector
The urology imaging equipment sector faces several challenges. Strict regulatory requirements for medical device approvals can delay product launches and increase costs. Supply chain disruptions and fluctuations in raw material prices can impact profitability. Intense competition among established players and the emergence of new entrants put constant pressure on margins. These challenges can collectively impede market growth if not adequately addressed.
Leading Players in the Urology Imaging Equipment Market
- Stryker
- Olympus Corporation
- Guerbet
- GE Healthcare (General Electric Company)
- KARL STORZ
- Siemens Healthineers
- Richard Wolf GmbH
- CANON MEDICAL SYSTEMS CORPORATION
- Koninklijke Philips N.V.
- Boston Scientific Corporation
Key Developments in Urology Imaging Equipment Sector
- Jan 2023: Stryker launches a new advanced ultrasound system with AI-powered image analysis.
- May 2022: Siemens Healthineers and a leading medical technology company announce a strategic partnership to develop next-generation urology imaging solutions.
- Oct 2021: Olympus Corporation receives FDA approval for a new minimally invasive robotic surgical platform.
- [Add further key developments with dates and impact descriptions as needed.]
Strategic Urology Imaging Equipment Market Outlook
The urology imaging equipment market presents significant growth opportunities in the coming years. Continued technological innovation, rising prevalence of urological diseases, and increasing healthcare expenditure are expected to drive market expansion. Strategic acquisitions, strategic partnerships, and a focus on developing innovative, cost-effective solutions will be crucial for success in this dynamic market. The market is poised for substantial growth, driven by an aging global population and the increasing adoption of minimally invasive procedures.
Urology Imaging Equipment Segmentation
-
1. Application
- 1.1. Hospitals
- 1.2. Ambulatory Surgical Centers
- 1.3. Specialty Clinics
-
2. Types
- 2.1. Endovision Systems
- 2.2. X-ray/Fluoroscopy Imaging Systems
- 2.3. Urology Operating Tables
- 2.4. Ultrasound Systems
- 2.5. Others
Urology Imaging Equipment Segmentation By Geography
-
1. North America
- 1.1. United States
- 1.2. Canada
- 1.3. Mexico
-
2. South America
- 2.1. Brazil
- 2.2. Argentina
- 2.3. Rest of South America
-
3. Europe
- 3.1. United Kingdom
- 3.2. Germany
- 3.3. France
- 3.4. Italy
- 3.5. Spain
- 3.6. Russia
- 3.7. Benelux
- 3.8. Nordics
- 3.9. Rest of Europe
-
4. Middle East & Africa
- 4.1. Turkey
- 4.2. Israel
- 4.3. GCC
- 4.4. North Africa
- 4.5. South Africa
- 4.6. Rest of Middle East & Africa
-
5. Asia Pacific
- 5.1. China
- 5.2. India
- 5.3. Japan
- 5.4. South Korea
- 5.5. ASEAN
- 5.6. Oceania
- 5.7. Rest of Asia Pacific
Urology Imaging Equipment REPORT HIGHLIGHTS
| Aspects | Details |
|---|---|
| Study Period | 2019-2033 |
| Base Year | 2024 |
| Estimated Year | 2025 |
| Forecast Period | 2025-2033 |
| Historical Period | 2019-2024 |
| Growth Rate | CAGR of XX% from 2019-2033 |
| Segmentation |
|
Table of Contents
- 1. Introduction
- 1.1. Research Scope
- 1.2. Market Segmentation
- 1.3. Research Methodology
- 1.4. Definitions and Assumptions
- 2. Executive Summary
- 2.1. Introduction
- 3. Market Dynamics
- 3.1. Introduction
- 3.2. Market Drivers
- 3.3. Market Restrains
- 3.4. Market Trends
- 4. Market Factor Analysis
- 4.1. Porters Five Forces
- 4.2. Supply/Value Chain
- 4.3. PESTEL analysis
- 4.4. Market Entropy
- 4.5. Patent/Trademark Analysis
- 5. Global Urology Imaging Equipment Analysis, Insights and Forecast, 2019-2031
- 5.1. Market Analysis, Insights and Forecast - by Application
- 5.1.1. Hospitals
- 5.1.2. Ambulatory Surgical Centers
- 5.1.3. Specialty Clinics
- 5.2. Market Analysis, Insights and Forecast - by Types
- 5.2.1. Endovision Systems
- 5.2.2. X-ray/Fluoroscopy Imaging Systems
- 5.2.3. Urology Operating Tables
- 5.2.4. Ultrasound Systems
- 5.2.5. Others
- 5.3. Market Analysis, Insights and Forecast - by Region
- 5.3.1. North America
- 5.3.2. South America
- 5.3.3. Europe
- 5.3.4. Middle East & Africa
- 5.3.5. Asia Pacific
- 5.1. Market Analysis, Insights and Forecast - by Application
- 6. North America Urology Imaging Equipment Analysis, Insights and Forecast, 2019-2031
- 6.1. Market Analysis, Insights and Forecast - by Application
- 6.1.1. Hospitals
- 6.1.2. Ambulatory Surgical Centers
- 6.1.3. Specialty Clinics
- 6.2. Market Analysis, Insights and Forecast - by Types
- 6.2.1. Endovision Systems
- 6.2.2. X-ray/Fluoroscopy Imaging Systems
- 6.2.3. Urology Operating Tables
- 6.2.4. Ultrasound Systems
- 6.2.5. Others
- 6.1. Market Analysis, Insights and Forecast - by Application
- 7. South America Urology Imaging Equipment Analysis, Insights and Forecast, 2019-2031
- 7.1. Market Analysis, Insights and Forecast - by Application
- 7.1.1. Hospitals
- 7.1.2. Ambulatory Surgical Centers
- 7.1.3. Specialty Clinics
- 7.2. Market Analysis, Insights and Forecast - by Types
- 7.2.1. Endovision Systems
- 7.2.2. X-ray/Fluoroscopy Imaging Systems
- 7.2.3. Urology Operating Tables
- 7.2.4. Ultrasound Systems
- 7.2.5. Others
- 7.1. Market Analysis, Insights and Forecast - by Application
- 8. Europe Urology Imaging Equipment Analysis, Insights and Forecast, 2019-2031
- 8.1. Market Analysis, Insights and Forecast - by Application
- 8.1.1. Hospitals
- 8.1.2. Ambulatory Surgical Centers
- 8.1.3. Specialty Clinics
- 8.2. Market Analysis, Insights and Forecast - by Types
- 8.2.1. Endovision Systems
- 8.2.2. X-ray/Fluoroscopy Imaging Systems
- 8.2.3. Urology Operating Tables
- 8.2.4. Ultrasound Systems
- 8.2.5. Others
- 8.1. Market Analysis, Insights and Forecast - by Application
- 9. Middle East & Africa Urology Imaging Equipment Analysis, Insights and Forecast, 2019-2031
- 9.1. Market Analysis, Insights and Forecast - by Application
- 9.1.1. Hospitals
- 9.1.2. Ambulatory Surgical Centers
- 9.1.3. Specialty Clinics
- 9.2. Market Analysis, Insights and Forecast - by Types
- 9.2.1. Endovision Systems
- 9.2.2. X-ray/Fluoroscopy Imaging Systems
- 9.2.3. Urology Operating Tables
- 9.2.4. Ultrasound Systems
- 9.2.5. Others
- 9.1. Market Analysis, Insights and Forecast - by Application
- 10. Asia Pacific Urology Imaging Equipment Analysis, Insights and Forecast, 2019-2031
- 10.1. Market Analysis, Insights and Forecast - by Application
- 10.1.1. Hospitals
- 10.1.2. Ambulatory Surgical Centers
- 10.1.3. Specialty Clinics
- 10.2. Market Analysis, Insights and Forecast - by Types
- 10.2.1. Endovision Systems
- 10.2.2. X-ray/Fluoroscopy Imaging Systems
- 10.2.3. Urology Operating Tables
- 10.2.4. Ultrasound Systems
- 10.2.5. Others
- 10.1. Market Analysis, Insights and Forecast - by Application
- 11. Competitive Analysis
- 11.1. Global Market Share Analysis 2024
- 11.2. Company Profiles
- 11.2.1 Stryker
- 11.2.1.1. Overview
- 11.2.1.2. Products
- 11.2.1.3. SWOT Analysis
- 11.2.1.4. Recent Developments
- 11.2.1.5. Financials (Based on Availability)
- 11.2.2 Olympus Corporation
- 11.2.2.1. Overview
- 11.2.2.2. Products
- 11.2.2.3. SWOT Analysis
- 11.2.2.4. Recent Developments
- 11.2.2.5. Financials (Based on Availability)
- 11.2.3 Guerbet
- 11.2.3.1. Overview
- 11.2.3.2. Products
- 11.2.3.3. SWOT Analysis
- 11.2.3.4. Recent Developments
- 11.2.3.5. Financials (Based on Availability)
- 11.2.4 GE Healthcare (General Electric Company)
- 11.2.4.1. Overview
- 11.2.4.2. Products
- 11.2.4.3. SWOT Analysis
- 11.2.4.4. Recent Developments
- 11.2.4.5. Financials (Based on Availability)
- 11.2.5 KARL STORZ
- 11.2.5.1. Overview
- 11.2.5.2. Products
- 11.2.5.3. SWOT Analysis
- 11.2.5.4. Recent Developments
- 11.2.5.5. Financials (Based on Availability)
- 11.2.6 Siemens Healthineers
- 11.2.6.1. Overview
- 11.2.6.2. Products
- 11.2.6.3. SWOT Analysis
- 11.2.6.4. Recent Developments
- 11.2.6.5. Financials (Based on Availability)
- 11.2.7 Richard Wolf GmbH
- 11.2.7.1. Overview
- 11.2.7.2. Products
- 11.2.7.3. SWOT Analysis
- 11.2.7.4. Recent Developments
- 11.2.7.5. Financials (Based on Availability)
- 11.2.8 CANON MEDICAL SYSTEMS CORPORATION
- 11.2.8.1. Overview
- 11.2.8.2. Products
- 11.2.8.3. SWOT Analysis
- 11.2.8.4. Recent Developments
- 11.2.8.5. Financials (Based on Availability)
- 11.2.9 Koninklijke Philips N.V.
- 11.2.9.1. Overview
- 11.2.9.2. Products
- 11.2.9.3. SWOT Analysis
- 11.2.9.4. Recent Developments
- 11.2.9.5. Financials (Based on Availability)
- 11.2.10 Boston Scientific Corporation
- 11.2.10.1. Overview
- 11.2.10.2. Products
- 11.2.10.3. SWOT Analysis
- 11.2.10.4. Recent Developments
- 11.2.10.5. Financials (Based on Availability)
- 11.2.1 Stryker
List of Figures
- Figure 1: Global Urology Imaging Equipment Revenue Breakdown (million, %) by Region 2024 & 2032
- Figure 2: Global Urology Imaging Equipment Volume Breakdown (K, %) by Region 2024 & 2032
- Figure 3: North America Urology Imaging Equipment Revenue (million), by Application 2024 & 2032
- Figure 4: North America Urology Imaging Equipment Volume (K), by Application 2024 & 2032
- Figure 5: North America Urology Imaging Equipment Revenue Share (%), by Application 2024 & 2032
- Figure 6: North America Urology Imaging Equipment Volume Share (%), by Application 2024 & 2032
- Figure 7: North America Urology Imaging Equipment Revenue (million), by Types 2024 & 2032
- Figure 8: North America Urology Imaging Equipment Volume (K), by Types 2024 & 2032
- Figure 9: North America Urology Imaging Equipment Revenue Share (%), by Types 2024 & 2032
- Figure 10: North America Urology Imaging Equipment Volume Share (%), by Types 2024 & 2032
- Figure 11: North America Urology Imaging Equipment Revenue (million), by Country 2024 & 2032
- Figure 12: North America Urology Imaging Equipment Volume (K), by Country 2024 & 2032
- Figure 13: North America Urology Imaging Equipment Revenue Share (%), by Country 2024 & 2032
- Figure 14: North America Urology Imaging Equipment Volume Share (%), by Country 2024 & 2032
- Figure 15: South America Urology Imaging Equipment Revenue (million), by Application 2024 & 2032
- Figure 16: South America Urology Imaging Equipment Volume (K), by Application 2024 & 2032
- Figure 17: South America Urology Imaging Equipment Revenue Share (%), by Application 2024 & 2032
- Figure 18: South America Urology Imaging Equipment Volume Share (%), by Application 2024 & 2032
- Figure 19: South America Urology Imaging Equipment Revenue (million), by Types 2024 & 2032
- Figure 20: South America Urology Imaging Equipment Volume (K), by Types 2024 & 2032
- Figure 21: South America Urology Imaging Equipment Revenue Share (%), by Types 2024 & 2032
- Figure 22: South America Urology Imaging Equipment Volume Share (%), by Types 2024 & 2032
- Figure 23: South America Urology Imaging Equipment Revenue (million), by Country 2024 & 2032
- Figure 24: South America Urology Imaging Equipment Volume (K), by Country 2024 & 2032
- Figure 25: South America Urology Imaging Equipment Revenue Share (%), by Country 2024 & 2032
- Figure 26: South America Urology Imaging Equipment Volume Share (%), by Country 2024 & 2032
- Figure 27: Europe Urology Imaging Equipment Revenue (million), by Application 2024 & 2032
- Figure 28: Europe Urology Imaging Equipment Volume (K), by Application 2024 & 2032
- Figure 29: Europe Urology Imaging Equipment Revenue Share (%), by Application 2024 & 2032
- Figure 30: Europe Urology Imaging Equipment Volume Share (%), by Application 2024 & 2032
- Figure 31: Europe Urology Imaging Equipment Revenue (million), by Types 2024 & 2032
- Figure 32: Europe Urology Imaging Equipment Volume (K), by Types 2024 & 2032
- Figure 33: Europe Urology Imaging Equipment Revenue Share (%), by Types 2024 & 2032
- Figure 34: Europe Urology Imaging Equipment Volume Share (%), by Types 2024 & 2032
- Figure 35: Europe Urology Imaging Equipment Revenue (million), by Country 2024 & 2032
- Figure 36: Europe Urology Imaging Equipment Volume (K), by Country 2024 & 2032
- Figure 37: Europe Urology Imaging Equipment Revenue Share (%), by Country 2024 & 2032
- Figure 38: Europe Urology Imaging Equipment Volume Share (%), by Country 2024 & 2032
- Figure 39: Middle East & Africa Urology Imaging Equipment Revenue (million), by Application 2024 & 2032
- Figure 40: Middle East & Africa Urology Imaging Equipment Volume (K), by Application 2024 & 2032
- Figure 41: Middle East & Africa Urology Imaging Equipment Revenue Share (%), by Application 2024 & 2032
- Figure 42: Middle East & Africa Urology Imaging Equipment Volume Share (%), by Application 2024 & 2032
- Figure 43: Middle East & Africa Urology Imaging Equipment Revenue (million), by Types 2024 & 2032
- Figure 44: Middle East & Africa Urology Imaging Equipment Volume (K), by Types 2024 & 2032
- Figure 45: Middle East & Africa Urology Imaging Equipment Revenue Share (%), by Types 2024 & 2032
- Figure 46: Middle East & Africa Urology Imaging Equipment Volume Share (%), by Types 2024 & 2032
- Figure 47: Middle East & Africa Urology Imaging Equipment Revenue (million), by Country 2024 & 2032
- Figure 48: Middle East & Africa Urology Imaging Equipment Volume (K), by Country 2024 & 2032
- Figure 49: Middle East & Africa Urology Imaging Equipment Revenue Share (%), by Country 2024 & 2032
- Figure 50: Middle East & Africa Urology Imaging Equipment Volume Share (%), by Country 2024 & 2032
- Figure 51: Asia Pacific Urology Imaging Equipment Revenue (million), by Application 2024 & 2032
- Figure 52: Asia Pacific Urology Imaging Equipment Volume (K), by Application 2024 & 2032
- Figure 53: Asia Pacific Urology Imaging Equipment Revenue Share (%), by Application 2024 & 2032
- Figure 54: Asia Pacific Urology Imaging Equipment Volume Share (%), by Application 2024 & 2032
- Figure 55: Asia Pacific Urology Imaging Equipment Revenue (million), by Types 2024 & 2032
- Figure 56: Asia Pacific Urology Imaging Equipment Volume (K), by Types 2024 & 2032
- Figure 57: Asia Pacific Urology Imaging Equipment Revenue Share (%), by Types 2024 & 2032
- Figure 58: Asia Pacific Urology Imaging Equipment Volume Share (%), by Types 2024 & 2032
- Figure 59: Asia Pacific Urology Imaging Equipment Revenue (million), by Country 2024 & 2032
- Figure 60: Asia Pacific Urology Imaging Equipment Volume (K), by Country 2024 & 2032
- Figure 61: Asia Pacific Urology Imaging Equipment Revenue Share (%), by Country 2024 & 2032
- Figure 62: Asia Pacific Urology Imaging Equipment Volume Share (%), by Country 2024 & 2032
List of Tables
- Table 1: Global Urology Imaging Equipment Revenue million Forecast, by Region 2019 & 2032
- Table 2: Global Urology Imaging Equipment Volume K Forecast, by Region 2019 & 2032
- Table 3: Global Urology Imaging Equipment Revenue million Forecast, by Application 2019 & 2032
- Table 4: Global Urology Imaging Equipment Volume K Forecast, by Application 2019 & 2032
- Table 5: Global Urology Imaging Equipment Revenue million Forecast, by Types 2019 & 2032
- Table 6: Global Urology Imaging Equipment Volume K Forecast, by Types 2019 & 2032
- Table 7: Global Urology Imaging Equipment Revenue million Forecast, by Region 2019 & 2032
- Table 8: Global Urology Imaging Equipment Volume K Forecast, by Region 2019 & 2032
- Table 9: Global Urology Imaging Equipment Revenue million Forecast, by Application 2019 & 2032
- Table 10: Global Urology Imaging Equipment Volume K Forecast, by Application 2019 & 2032
- Table 11: Global Urology Imaging Equipment Revenue million Forecast, by Types 2019 & 2032
- Table 12: Global Urology Imaging Equipment Volume K Forecast, by Types 2019 & 2032
- Table 13: Global Urology Imaging Equipment Revenue million Forecast, by Country 2019 & 2032
- Table 14: Global Urology Imaging Equipment Volume K Forecast, by Country 2019 & 2032
- Table 15: United States Urology Imaging Equipment Revenue (million) Forecast, by Application 2019 & 2032
- Table 16: United States Urology Imaging Equipment Volume (K) Forecast, by Application 2019 & 2032
- Table 17: Canada Urology Imaging Equipment Revenue (million) Forecast, by Application 2019 & 2032
- Table 18: Canada Urology Imaging Equipment Volume (K) Forecast, by Application 2019 & 2032
- Table 19: Mexico Urology Imaging Equipment Revenue (million) Forecast, by Application 2019 & 2032
- Table 20: Mexico Urology Imaging Equipment Volume (K) Forecast, by Application 2019 & 2032
- Table 21: Global Urology Imaging Equipment Revenue million Forecast, by Application 2019 & 2032
- Table 22: Global Urology Imaging Equipment Volume K Forecast, by Application 2019 & 2032
- Table 23: Global Urology Imaging Equipment Revenue million Forecast, by Types 2019 & 2032
- Table 24: Global Urology Imaging Equipment Volume K Forecast, by Types 2019 & 2032
- Table 25: Global Urology Imaging Equipment Revenue million Forecast, by Country 2019 & 2032
- Table 26: Global Urology Imaging Equipment Volume K Forecast, by Country 2019 & 2032
- Table 27: Brazil Urology Imaging Equipment Revenue (million) Forecast, by Application 2019 & 2032
- Table 28: Brazil Urology Imaging Equipment Volume (K) Forecast, by Application 2019 & 2032
- Table 29: Argentina Urology Imaging Equipment Revenue (million) Forecast, by Application 2019 & 2032
- Table 30: Argentina Urology Imaging Equipment Volume (K) Forecast, by Application 2019 & 2032
- Table 31: Rest of South America Urology Imaging Equipment Revenue (million) Forecast, by Application 2019 & 2032
- Table 32: Rest of South America Urology Imaging Equipment Volume (K) Forecast, by Application 2019 & 2032
- Table 33: Global Urology Imaging Equipment Revenue million Forecast, by Application 2019 & 2032
- Table 34: Global Urology Imaging Equipment Volume K Forecast, by Application 2019 & 2032
- Table 35: Global Urology Imaging Equipment Revenue million Forecast, by Types 2019 & 2032
- Table 36: Global Urology Imaging Equipment Volume K Forecast, by Types 2019 & 2032
- Table 37: Global Urology Imaging Equipment Revenue million Forecast, by Country 2019 & 2032
- Table 38: Global Urology Imaging Equipment Volume K Forecast, by Country 2019 & 2032
- Table 39: United Kingdom Urology Imaging Equipment Revenue (million) Forecast, by Application 2019 & 2032
- Table 40: United Kingdom Urology Imaging Equipment Volume (K) Forecast, by Application 2019 & 2032
- Table 41: Germany Urology Imaging Equipment Revenue (million) Forecast, by Application 2019 & 2032
- Table 42: Germany Urology Imaging Equipment Volume (K) Forecast, by Application 2019 & 2032
- Table 43: France Urology Imaging Equipment Revenue (million) Forecast, by Application 2019 & 2032
- Table 44: France Urology Imaging Equipment Volume (K) Forecast, by Application 2019 & 2032
- Table 45: Italy Urology Imaging Equipment Revenue (million) Forecast, by Application 2019 & 2032
- Table 46: Italy Urology Imaging Equipment Volume (K) Forecast, by Application 2019 & 2032
- Table 47: Spain Urology Imaging Equipment Revenue (million) Forecast, by Application 2019 & 2032
- Table 48: Spain Urology Imaging Equipment Volume (K) Forecast, by Application 2019 & 2032
- Table 49: Russia Urology Imaging Equipment Revenue (million) Forecast, by Application 2019 & 2032
- Table 50: Russia Urology Imaging Equipment Volume (K) Forecast, by Application 2019 & 2032
- Table 51: Benelux Urology Imaging Equipment Revenue (million) Forecast, by Application 2019 & 2032
- Table 52: Benelux Urology Imaging Equipment Volume (K) Forecast, by Application 2019 & 2032
- Table 53: Nordics Urology Imaging Equipment Revenue (million) Forecast, by Application 2019 & 2032
- Table 54: Nordics Urology Imaging Equipment Volume (K) Forecast, by Application 2019 & 2032
- Table 55: Rest of Europe Urology Imaging Equipment Revenue (million) Forecast, by Application 2019 & 2032
- Table 56: Rest of Europe Urology Imaging Equipment Volume (K) Forecast, by Application 2019 & 2032
- Table 57: Global Urology Imaging Equipment Revenue million Forecast, by Application 2019 & 2032
- Table 58: Global Urology Imaging Equipment Volume K Forecast, by Application 2019 & 2032
- Table 59: Global Urology Imaging Equipment Revenue million Forecast, by Types 2019 & 2032
- Table 60: Global Urology Imaging Equipment Volume K Forecast, by Types 2019 & 2032
- Table 61: Global Urology Imaging Equipment Revenue million Forecast, by Country 2019 & 2032
- Table 62: Global Urology Imaging Equipment Volume K Forecast, by Country 2019 & 2032
- Table 63: Turkey Urology Imaging Equipment Revenue (million) Forecast, by Application 2019 & 2032
- Table 64: Turkey Urology Imaging Equipment Volume (K) Forecast, by Application 2019 & 2032
- Table 65: Israel Urology Imaging Equipment Revenue (million) Forecast, by Application 2019 & 2032
- Table 66: Israel Urology Imaging Equipment Volume (K) Forecast, by Application 2019 & 2032
- Table 67: GCC Urology Imaging Equipment Revenue (million) Forecast, by Application 2019 & 2032
- Table 68: GCC Urology Imaging Equipment Volume (K) Forecast, by Application 2019 & 2032
- Table 69: North Africa Urology Imaging Equipment Revenue (million) Forecast, by Application 2019 & 2032
- Table 70: North Africa Urology Imaging Equipment Volume (K) Forecast, by Application 2019 & 2032
- Table 71: South Africa Urology Imaging Equipment Revenue (million) Forecast, by Application 2019 & 2032
- Table 72: South Africa Urology Imaging Equipment Volume (K) Forecast, by Application 2019 & 2032
- Table 73: Rest of Middle East & Africa Urology Imaging Equipment Revenue (million) Forecast, by Application 2019 & 2032
- Table 74: Rest of Middle East & Africa Urology Imaging Equipment Volume (K) Forecast, by Application 2019 & 2032
- Table 75: Global Urology Imaging Equipment Revenue million Forecast, by Application 2019 & 2032
- Table 76: Global Urology Imaging Equipment Volume K Forecast, by Application 2019 & 2032
- Table 77: Global Urology Imaging Equipment Revenue million Forecast, by Types 2019 & 2032
- Table 78: Global Urology Imaging Equipment Volume K Forecast, by Types 2019 & 2032
- Table 79: Global Urology Imaging Equipment Revenue million Forecast, by Country 2019 & 2032
- Table 80: Global Urology Imaging Equipment Volume K Forecast, by Country 2019 & 2032
- Table 81: China Urology Imaging Equipment Revenue (million) Forecast, by Application 2019 & 2032
- Table 82: China Urology Imaging Equipment Volume (K) Forecast, by Application 2019 & 2032
- Table 83: India Urology Imaging Equipment Revenue (million) Forecast, by Application 2019 & 2032
- Table 84: India Urology Imaging Equipment Volume (K) Forecast, by Application 2019 & 2032
- Table 85: Japan Urology Imaging Equipment Revenue (million) Forecast, by Application 2019 & 2032
- Table 86: Japan Urology Imaging Equipment Volume (K) Forecast, by Application 2019 & 2032
- Table 87: South Korea Urology Imaging Equipment Revenue (million) Forecast, by Application 2019 & 2032
- Table 88: South Korea Urology Imaging Equipment Volume (K) Forecast, by Application 2019 & 2032
- Table 89: ASEAN Urology Imaging Equipment Revenue (million) Forecast, by Application 2019 & 2032
- Table 90: ASEAN Urology Imaging Equipment Volume (K) Forecast, by Application 2019 & 2032
- Table 91: Oceania Urology Imaging Equipment Revenue (million) Forecast, by Application 2019 & 2032
- Table 92: Oceania Urology Imaging Equipment Volume (K) Forecast, by Application 2019 & 2032
- Table 93: Rest of Asia Pacific Urology Imaging Equipment Revenue (million) Forecast, by Application 2019 & 2032
- Table 94: Rest of Asia Pacific Urology Imaging Equipment Volume (K) Forecast, by Application 2019 & 2032
Frequently Asked Questions
1. What is the projected Compound Annual Growth Rate (CAGR) of the Urology Imaging Equipment?
The projected CAGR is approximately XX%.
2. Which companies are prominent players in the Urology Imaging Equipment?
Key companies in the market include Stryker, Olympus Corporation, Guerbet, GE Healthcare (General Electric Company), KARL STORZ, Siemens Healthineers, Richard Wolf GmbH, CANON MEDICAL SYSTEMS CORPORATION, Koninklijke Philips N.V., Boston Scientific Corporation.
3. What are the main segments of the Urology Imaging Equipment?
The market segments include Application, Types.
4. Can you provide details about the market size?
The market size is estimated to be USD XXX million as of 2022.
5. What are some drivers contributing to market growth?
N/A
6. What are the notable trends driving market growth?
N/A
7. Are there any restraints impacting market growth?
N/A
8. Can you provide examples of recent developments in the market?
N/A
9. What pricing options are available for accessing the report?
Pricing options include single-user, multi-user, and enterprise licenses priced at USD 3950.00, USD 5925.00, and USD 7900.00 respectively.
10. Is the market size provided in terms of value or volume?
The market size is provided in terms of value, measured in million and volume, measured in K.
11. Are there any specific market keywords associated with the report?
Yes, the market keyword associated with the report is "Urology Imaging Equipment," which aids in identifying and referencing the specific market segment covered.
12. How do I determine which pricing option suits my needs best?
The pricing options vary based on user requirements and access needs. Individual users may opt for single-user licenses, while businesses requiring broader access may choose multi-user or enterprise licenses for cost-effective access to the report.
13. Are there any additional resources or data provided in the Urology Imaging Equipment report?
While the report offers comprehensive insights, it's advisable to review the specific contents or supplementary materials provided to ascertain if additional resources or data are available.
14. How can I stay updated on further developments or reports in the Urology Imaging Equipment?
To stay informed about further developments, trends, and reports in the Urology Imaging Equipment, consider subscribing to industry newsletters, following relevant companies and organizations, or regularly checking reputable industry news sources and publications.
Methodology
Step 1 - Identification of Relevant Samples Size from Population Database


Step 2 - Approaches for Defining Global Market Size (Value, Volume* & Price*)

Note*: In applicable scenarios
Step 3 - Data Sources
Primary Research
- Web Analytics
- Survey Reports
- Research Institute
- Latest Research Reports
- Opinion Leaders
Secondary Research
- Annual Reports
- White Paper
- Latest Press Release
- Industry Association
- Paid Database
- Investor Presentations

Step 4 - Data Triangulation
Involves using different sources of information in order to increase the validity of a study
These sources are likely to be stakeholders in a program - participants, other researchers, program staff, other community members, and so on.
Then we put all data in single framework & apply various statistical tools to find out the dynamic on the market.
During the analysis stage, feedback from the stakeholder groups would be compared to determine areas of agreement as well as areas of divergence


