
Key Insights
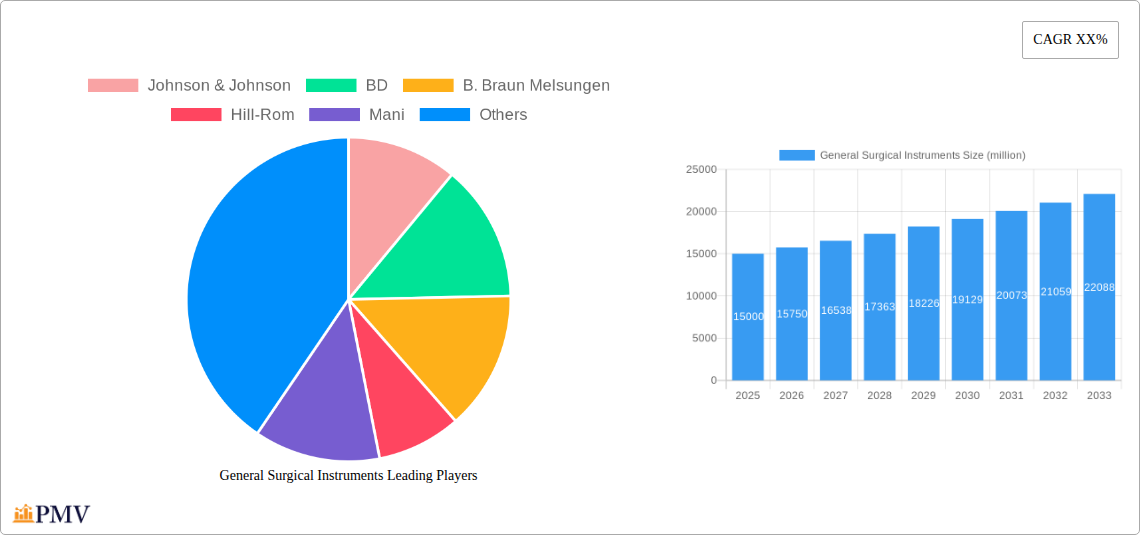
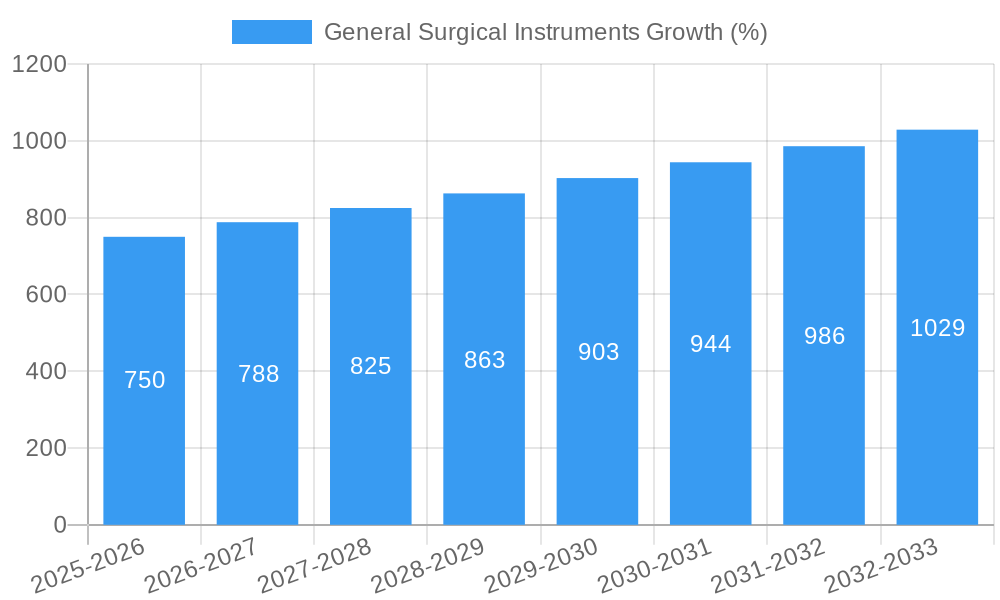
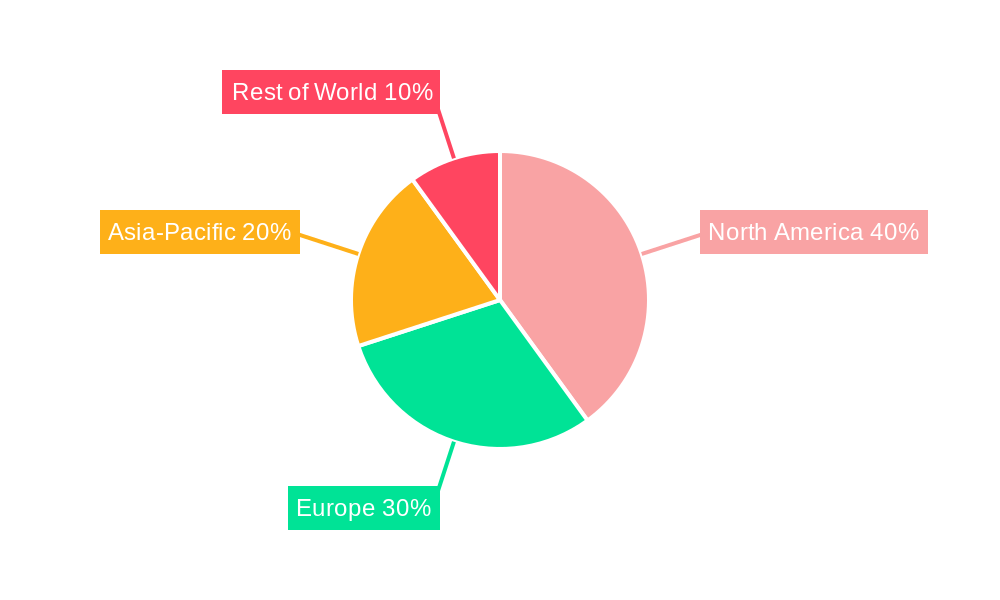
The global market for general surgical instruments is experiencing robust growth, driven by a confluence of factors. Rising prevalence of chronic diseases necessitating surgical interventions, an aging global population, technological advancements leading to minimally invasive procedures, and increasing demand for improved surgical precision are all contributing to market expansion. The market's size in 2025 is estimated at $15 billion, projecting a Compound Annual Growth Rate (CAGR) of 5% from 2025 to 2033, reaching an estimated $22 billion by 2033. Key players like Johnson & Johnson, BD, and B. Braun Melsungen are leveraging their established distribution networks and strong R&D capabilities to maintain market leadership. However, regulatory hurdles in certain regions and the high cost of advanced instruments pose challenges to market growth. The market is segmented by product type (e.g., laparoscopic instruments, forceps, scalpels), application (e.g., general surgery, cardiovascular surgery, orthopedics), and end-user (e.g., hospitals, ambulatory surgical centers). The North American region currently holds the largest market share due to high healthcare expenditure and technological advancements. However, Asia-Pacific is poised for significant growth due to rising disposable incomes and improving healthcare infrastructure.
Future growth will be significantly influenced by the adoption of innovative materials, such as high-performance polymers and titanium alloys, offering enhanced durability and biocompatibility. Furthermore, the increasing integration of robotics and artificial intelligence in surgical procedures is expected to drive the demand for sophisticated instruments. Manufacturers are focusing on developing disposable and reusable instruments that provide better sterility, efficiency, and cost-effectiveness. This trend is coupled with a growing emphasis on patient safety, leading to rigorous quality control measures and the development of instruments with improved ergonomics and user-friendliness. The competitive landscape is characterized by both established multinational companies and smaller specialized manufacturers, creating a dynamic and rapidly evolving market.
General Surgical Instruments Market Report: 2019-2033
This comprehensive report provides a detailed analysis of the global General Surgical Instruments market, offering invaluable insights for stakeholders across the medical device industry. With a study period spanning 2019-2033, a base year of 2025, and an estimated and forecast period of 2025-2033, this report leverages extensive data from the historical period (2019-2024) to project future market trends. The report's value exceeds $xx million, offering a granular view of market segmentation, competitive dynamics, and key growth drivers.
General Surgical Instruments Market Structure & Competitive Dynamics
The global General Surgical Instruments market exhibits a moderately consolidated structure, with key players like Johnson & Johnson, Medtronic, and Zimmer Biomet holding significant market share. The market's concentration ratio (CR5) is estimated at xx%, reflecting a balance between established players and emerging innovators. Innovation ecosystems are vibrant, fueled by ongoing research and development in minimally invasive surgery, robotics, and advanced materials. Regulatory frameworks, such as those enforced by the FDA and other international bodies, significantly influence product development and market access. Product substitutes, including minimally invasive procedures and alternative therapies, exert competitive pressure. End-user trends, including increasing demand for high-quality, cost-effective instruments, drive market growth. M&A activity within the sector has seen approximately $xx million in deal values over the past five years, mostly focused on strengthening technology portfolios and expanding market reach. Key M&A activities include:
- Acquisition of Company X by Company Y for $xx million in 2023, expanding their product portfolio.
- Strategic partnership between Company A and Company B for joint development of a new surgical instrument technology.
General Surgical Instruments Industry Trends & Insights
The General Surgical Instruments market is experiencing robust growth, projected at a CAGR of xx% during the forecast period (2025-2033). This growth is primarily driven by the increasing prevalence of chronic diseases necessitating surgical interventions, a global rise in surgical procedures, technological advancements leading to improved surgical precision and minimally invasive techniques, and the rising adoption of advanced surgical instruments by hospitals and ambulatory surgical centers. The market penetration rate for advanced instruments (e.g., laparoscopic instruments) is increasing steadily, reaching approximately xx% in 2025. Technological disruptions, such as the integration of AI and robotics in surgery, are reshaping the market landscape, driving innovation and competition. Consumer preferences are shifting toward instruments with enhanced ergonomics, durability, and infection control features. The competitive landscape remains dynamic, with companies focusing on product differentiation, strategic partnerships, and geographical expansion.
Dominant Markets & Segments in General Surgical Instruments
The North American market currently holds the largest market share in the General Surgical Instruments sector, followed by Europe and Asia Pacific. Several factors contribute to North America's dominance:
- Robust healthcare infrastructure: Well-established healthcare systems and advanced medical facilities drive demand for high-quality surgical instruments.
- High disposable income: Allows for greater investment in advanced surgical technologies.
- Favorable regulatory environment: Facilitates innovation and market entry for new products.
Europe also demonstrates strong market growth, driven by an aging population, rising prevalence of chronic diseases, and increasing investments in healthcare infrastructure. The Asia Pacific region shows significant growth potential, spurred by rapid economic growth, improving healthcare infrastructure, and a growing middle class with increased access to healthcare services. Within specific segments, laparoscopic instruments represent a rapidly expanding portion of the market, accounting for approximately xx% of total revenue in 2025, driven by its minimally invasive nature.
General Surgical Instruments Product Innovations
Recent innovations focus on minimally invasive surgical instruments, incorporating advanced materials (e.g., lightweight polymers), improved ergonomics, and integrated technologies such as haptic feedback and 3D visualization. These advancements enhance surgical precision, reduce procedure times, and minimize patient trauma. Furthermore, disposable instruments are gaining traction due to enhanced infection control, streamlining sterilization processes and reducing the risk of cross-contamination. The market increasingly favors instruments with enhanced durability, resulting in reduced replacement costs for healthcare facilities.
Report Segmentation & Scope
This report segments the General Surgical Instruments market by product type (e.g., laparoscopic instruments, orthopedic instruments, cardiovascular instruments), by end-user (hospitals, ambulatory surgical centers, clinics), and by geography (North America, Europe, Asia Pacific, Rest of World). Each segment provides detailed analysis of market size, growth projections, and competitive landscapes. The growth projections for each segment are influenced by factors such as technological advancements, regulatory changes, and economic conditions within each region. For example, the laparoscopic instruments segment is projected to experience significant growth due to the increasing adoption of minimally invasive surgical techniques. The hospital segment holds the largest market share, driven by the high volume of surgical procedures performed in these facilities.
Key Drivers of General Surgical Instruments Growth
The General Surgical Instruments market is fueled by several key factors. Technological advancements, leading to the development of innovative instruments with enhanced precision, ergonomics, and durability, play a significant role. The growing prevalence of chronic diseases requiring surgical intervention significantly expands the demand for surgical instruments. Government initiatives and healthcare reforms designed to improve access to surgical care in both developed and developing nations further bolster market growth. Furthermore, the increasing adoption of minimally invasive surgical techniques contributes to the market's expansion, driving demand for specialized instruments.
Challenges in the General Surgical Instruments Sector
The General Surgical Instruments sector faces various challenges. Stringent regulatory requirements for medical device approval and market entry present significant hurdles for manufacturers. Supply chain disruptions, particularly those caused by geopolitical events or natural disasters, can impact the availability and cost of instruments. Intense competition among established players and emerging companies creates pressure on pricing and profit margins. The rising cost of raw materials and manufacturing also impacts profitability. The overall impact of these challenges is estimated to reduce the market growth by approximately xx% during the forecast period.
Leading Players in the General Surgical Instruments Market
- Johnson & Johnson
- BD
- B. Braun Melsungen
- Hill-Rom
- Mani
- Medtronic
- Swann-Morton
- Feather
- KAI Group
- Zimmer Biomet
- KLS Martin
- SteriLance
- Huaiyin Medical
Key Developments in General Surgical Instruments Sector
- January 2023: Company X launched a new line of laparoscopic instruments featuring enhanced ergonomics and precision.
- March 2022: Company Y acquired Company Z, expanding its product portfolio in minimally invasive surgery.
- June 2021: New FDA regulations impacted the approval process for certain surgical instruments.
- November 2020: A significant supply chain disruption affected the availability of key raw materials for instrument manufacturing.
Strategic General Surgical Instruments Market Outlook
The future of the General Surgical Instruments market is promising, with continued growth driven by technological innovation, increasing demand for minimally invasive procedures, and expanding access to healthcare services globally. Strategic opportunities exist for companies focused on developing innovative products, expanding into emerging markets, and forming strategic partnerships to enhance their market reach and technological capabilities. The integration of advanced technologies, such as AI and robotics, will further revolutionize the surgical landscape, creating significant growth potential in the coming years. Companies with a robust R&D pipeline and a strong focus on product differentiation are expected to gain a competitive edge in this rapidly evolving market.
General Surgical Instruments Segmentation
-
1. Application
- 1.1. Obstetrics and Gynecology
- 1.2. Neurosurgery
- 1.3. Plastic and Reconstructive Surgery
- 1.4. Cardiovascular
- 1.5. Orthopedic
- 1.6. Others
-
2. Types
- 2.1. Surgical Scissors
- 2.2. Surgical Forceps
- 2.3. Blades & Scalpels
- 2.4. Retractors
- 2.5. Dilators
- 2.6. Others
General Surgical Instruments Segmentation By Geography
-
1. North America
- 1.1. United States
- 1.2. Canada
- 1.3. Mexico
-
2. South America
- 2.1. Brazil
- 2.2. Argentina
- 2.3. Rest of South America
-
3. Europe
- 3.1. United Kingdom
- 3.2. Germany
- 3.3. France
- 3.4. Italy
- 3.5. Spain
- 3.6. Russia
- 3.7. Benelux
- 3.8. Nordics
- 3.9. Rest of Europe
-
4. Middle East & Africa
- 4.1. Turkey
- 4.2. Israel
- 4.3. GCC
- 4.4. North Africa
- 4.5. South Africa
- 4.6. Rest of Middle East & Africa
-
5. Asia Pacific
- 5.1. China
- 5.2. India
- 5.3. Japan
- 5.4. South Korea
- 5.5. ASEAN
- 5.6. Oceania
- 5.7. Rest of Asia Pacific
General Surgical Instruments REPORT HIGHLIGHTS
| Aspects | Details |
|---|---|
| Study Period | 2019-2033 |
| Base Year | 2024 |
| Estimated Year | 2025 |
| Forecast Period | 2025-2033 |
| Historical Period | 2019-2024 |
| Growth Rate | CAGR of XX% from 2019-2033 |
| Segmentation |
|
Table of Contents
- 1. Introduction
- 1.1. Research Scope
- 1.2. Market Segmentation
- 1.3. Research Methodology
- 1.4. Definitions and Assumptions
- 2. Executive Summary
- 2.1. Introduction
- 3. Market Dynamics
- 3.1. Introduction
- 3.2. Market Drivers
- 3.3. Market Restrains
- 3.4. Market Trends
- 4. Market Factor Analysis
- 4.1. Porters Five Forces
- 4.2. Supply/Value Chain
- 4.3. PESTEL analysis
- 4.4. Market Entropy
- 4.5. Patent/Trademark Analysis
- 5. Global General Surgical Instruments Analysis, Insights and Forecast, 2019-2031
- 5.1. Market Analysis, Insights and Forecast - by Application
- 5.1.1. Obstetrics and Gynecology
- 5.1.2. Neurosurgery
- 5.1.3. Plastic and Reconstructive Surgery
- 5.1.4. Cardiovascular
- 5.1.5. Orthopedic
- 5.1.6. Others
- 5.2. Market Analysis, Insights and Forecast - by Types
- 5.2.1. Surgical Scissors
- 5.2.2. Surgical Forceps
- 5.2.3. Blades & Scalpels
- 5.2.4. Retractors
- 5.2.5. Dilators
- 5.2.6. Others
- 5.3. Market Analysis, Insights and Forecast - by Region
- 5.3.1. North America
- 5.3.2. South America
- 5.3.3. Europe
- 5.3.4. Middle East & Africa
- 5.3.5. Asia Pacific
- 5.1. Market Analysis, Insights and Forecast - by Application
- 6. North America General Surgical Instruments Analysis, Insights and Forecast, 2019-2031
- 6.1. Market Analysis, Insights and Forecast - by Application
- 6.1.1. Obstetrics and Gynecology
- 6.1.2. Neurosurgery
- 6.1.3. Plastic and Reconstructive Surgery
- 6.1.4. Cardiovascular
- 6.1.5. Orthopedic
- 6.1.6. Others
- 6.2. Market Analysis, Insights and Forecast - by Types
- 6.2.1. Surgical Scissors
- 6.2.2. Surgical Forceps
- 6.2.3. Blades & Scalpels
- 6.2.4. Retractors
- 6.2.5. Dilators
- 6.2.6. Others
- 6.1. Market Analysis, Insights and Forecast - by Application
- 7. South America General Surgical Instruments Analysis, Insights and Forecast, 2019-2031
- 7.1. Market Analysis, Insights and Forecast - by Application
- 7.1.1. Obstetrics and Gynecology
- 7.1.2. Neurosurgery
- 7.1.3. Plastic and Reconstructive Surgery
- 7.1.4. Cardiovascular
- 7.1.5. Orthopedic
- 7.1.6. Others
- 7.2. Market Analysis, Insights and Forecast - by Types
- 7.2.1. Surgical Scissors
- 7.2.2. Surgical Forceps
- 7.2.3. Blades & Scalpels
- 7.2.4. Retractors
- 7.2.5. Dilators
- 7.2.6. Others
- 7.1. Market Analysis, Insights and Forecast - by Application
- 8. Europe General Surgical Instruments Analysis, Insights and Forecast, 2019-2031
- 8.1. Market Analysis, Insights and Forecast - by Application
- 8.1.1. Obstetrics and Gynecology
- 8.1.2. Neurosurgery
- 8.1.3. Plastic and Reconstructive Surgery
- 8.1.4. Cardiovascular
- 8.1.5. Orthopedic
- 8.1.6. Others
- 8.2. Market Analysis, Insights and Forecast - by Types
- 8.2.1. Surgical Scissors
- 8.2.2. Surgical Forceps
- 8.2.3. Blades & Scalpels
- 8.2.4. Retractors
- 8.2.5. Dilators
- 8.2.6. Others
- 8.1. Market Analysis, Insights and Forecast - by Application
- 9. Middle East & Africa General Surgical Instruments Analysis, Insights and Forecast, 2019-2031
- 9.1. Market Analysis, Insights and Forecast - by Application
- 9.1.1. Obstetrics and Gynecology
- 9.1.2. Neurosurgery
- 9.1.3. Plastic and Reconstructive Surgery
- 9.1.4. Cardiovascular
- 9.1.5. Orthopedic
- 9.1.6. Others
- 9.2. Market Analysis, Insights and Forecast - by Types
- 9.2.1. Surgical Scissors
- 9.2.2. Surgical Forceps
- 9.2.3. Blades & Scalpels
- 9.2.4. Retractors
- 9.2.5. Dilators
- 9.2.6. Others
- 9.1. Market Analysis, Insights and Forecast - by Application
- 10. Asia Pacific General Surgical Instruments Analysis, Insights and Forecast, 2019-2031
- 10.1. Market Analysis, Insights and Forecast - by Application
- 10.1.1. Obstetrics and Gynecology
- 10.1.2. Neurosurgery
- 10.1.3. Plastic and Reconstructive Surgery
- 10.1.4. Cardiovascular
- 10.1.5. Orthopedic
- 10.1.6. Others
- 10.2. Market Analysis, Insights and Forecast - by Types
- 10.2.1. Surgical Scissors
- 10.2.2. Surgical Forceps
- 10.2.3. Blades & Scalpels
- 10.2.4. Retractors
- 10.2.5. Dilators
- 10.2.6. Others
- 10.1. Market Analysis, Insights and Forecast - by Application
- 11. Competitive Analysis
- 11.1. Global Market Share Analysis 2024
- 11.2. Company Profiles
- 11.2.1 Johnson & Johnson
- 11.2.1.1. Overview
- 11.2.1.2. Products
- 11.2.1.3. SWOT Analysis
- 11.2.1.4. Recent Developments
- 11.2.1.5. Financials (Based on Availability)
- 11.2.2 BD
- 11.2.2.1. Overview
- 11.2.2.2. Products
- 11.2.2.3. SWOT Analysis
- 11.2.2.4. Recent Developments
- 11.2.2.5. Financials (Based on Availability)
- 11.2.3 B. Braun Melsungen
- 11.2.3.1. Overview
- 11.2.3.2. Products
- 11.2.3.3. SWOT Analysis
- 11.2.3.4. Recent Developments
- 11.2.3.5. Financials (Based on Availability)
- 11.2.4 Hill-Rom
- 11.2.4.1. Overview
- 11.2.4.2. Products
- 11.2.4.3. SWOT Analysis
- 11.2.4.4. Recent Developments
- 11.2.4.5. Financials (Based on Availability)
- 11.2.5 Mani
- 11.2.5.1. Overview
- 11.2.5.2. Products
- 11.2.5.3. SWOT Analysis
- 11.2.5.4. Recent Developments
- 11.2.5.5. Financials (Based on Availability)
- 11.2.6 Medtronic
- 11.2.6.1. Overview
- 11.2.6.2. Products
- 11.2.6.3. SWOT Analysis
- 11.2.6.4. Recent Developments
- 11.2.6.5. Financials (Based on Availability)
- 11.2.7 Swann-Morton
- 11.2.7.1. Overview
- 11.2.7.2. Products
- 11.2.7.3. SWOT Analysis
- 11.2.7.4. Recent Developments
- 11.2.7.5. Financials (Based on Availability)
- 11.2.8 Feather
- 11.2.8.1. Overview
- 11.2.8.2. Products
- 11.2.8.3. SWOT Analysis
- 11.2.8.4. Recent Developments
- 11.2.8.5. Financials (Based on Availability)
- 11.2.9 KAI Group
- 11.2.9.1. Overview
- 11.2.9.2. Products
- 11.2.9.3. SWOT Analysis
- 11.2.9.4. Recent Developments
- 11.2.9.5. Financials (Based on Availability)
- 11.2.10 Zimmer Biomet
- 11.2.10.1. Overview
- 11.2.10.2. Products
- 11.2.10.3. SWOT Analysis
- 11.2.10.4. Recent Developments
- 11.2.10.5. Financials (Based on Availability)
- 11.2.11 KLS Martin
- 11.2.11.1. Overview
- 11.2.11.2. Products
- 11.2.11.3. SWOT Analysis
- 11.2.11.4. Recent Developments
- 11.2.11.5. Financials (Based on Availability)
- 11.2.12 SteriLance
- 11.2.12.1. Overview
- 11.2.12.2. Products
- 11.2.12.3. SWOT Analysis
- 11.2.12.4. Recent Developments
- 11.2.12.5. Financials (Based on Availability)
- 11.2.13 Huaiyin Medical
- 11.2.13.1. Overview
- 11.2.13.2. Products
- 11.2.13.3. SWOT Analysis
- 11.2.13.4. Recent Developments
- 11.2.13.5. Financials (Based on Availability)
- 11.2.1 Johnson & Johnson
List of Figures
- Figure 1: Global General Surgical Instruments Revenue Breakdown (million, %) by Region 2024 & 2032
- Figure 2: Global General Surgical Instruments Volume Breakdown (K, %) by Region 2024 & 2032
- Figure 3: North America General Surgical Instruments Revenue (million), by Application 2024 & 2032
- Figure 4: North America General Surgical Instruments Volume (K), by Application 2024 & 2032
- Figure 5: North America General Surgical Instruments Revenue Share (%), by Application 2024 & 2032
- Figure 6: North America General Surgical Instruments Volume Share (%), by Application 2024 & 2032
- Figure 7: North America General Surgical Instruments Revenue (million), by Types 2024 & 2032
- Figure 8: North America General Surgical Instruments Volume (K), by Types 2024 & 2032
- Figure 9: North America General Surgical Instruments Revenue Share (%), by Types 2024 & 2032
- Figure 10: North America General Surgical Instruments Volume Share (%), by Types 2024 & 2032
- Figure 11: North America General Surgical Instruments Revenue (million), by Country 2024 & 2032
- Figure 12: North America General Surgical Instruments Volume (K), by Country 2024 & 2032
- Figure 13: North America General Surgical Instruments Revenue Share (%), by Country 2024 & 2032
- Figure 14: North America General Surgical Instruments Volume Share (%), by Country 2024 & 2032
- Figure 15: South America General Surgical Instruments Revenue (million), by Application 2024 & 2032
- Figure 16: South America General Surgical Instruments Volume (K), by Application 2024 & 2032
- Figure 17: South America General Surgical Instruments Revenue Share (%), by Application 2024 & 2032
- Figure 18: South America General Surgical Instruments Volume Share (%), by Application 2024 & 2032
- Figure 19: South America General Surgical Instruments Revenue (million), by Types 2024 & 2032
- Figure 20: South America General Surgical Instruments Volume (K), by Types 2024 & 2032
- Figure 21: South America General Surgical Instruments Revenue Share (%), by Types 2024 & 2032
- Figure 22: South America General Surgical Instruments Volume Share (%), by Types 2024 & 2032
- Figure 23: South America General Surgical Instruments Revenue (million), by Country 2024 & 2032
- Figure 24: South America General Surgical Instruments Volume (K), by Country 2024 & 2032
- Figure 25: South America General Surgical Instruments Revenue Share (%), by Country 2024 & 2032
- Figure 26: South America General Surgical Instruments Volume Share (%), by Country 2024 & 2032
- Figure 27: Europe General Surgical Instruments Revenue (million), by Application 2024 & 2032
- Figure 28: Europe General Surgical Instruments Volume (K), by Application 2024 & 2032
- Figure 29: Europe General Surgical Instruments Revenue Share (%), by Application 2024 & 2032
- Figure 30: Europe General Surgical Instruments Volume Share (%), by Application 2024 & 2032
- Figure 31: Europe General Surgical Instruments Revenue (million), by Types 2024 & 2032
- Figure 32: Europe General Surgical Instruments Volume (K), by Types 2024 & 2032
- Figure 33: Europe General Surgical Instruments Revenue Share (%), by Types 2024 & 2032
- Figure 34: Europe General Surgical Instruments Volume Share (%), by Types 2024 & 2032
- Figure 35: Europe General Surgical Instruments Revenue (million), by Country 2024 & 2032
- Figure 36: Europe General Surgical Instruments Volume (K), by Country 2024 & 2032
- Figure 37: Europe General Surgical Instruments Revenue Share (%), by Country 2024 & 2032
- Figure 38: Europe General Surgical Instruments Volume Share (%), by Country 2024 & 2032
- Figure 39: Middle East & Africa General Surgical Instruments Revenue (million), by Application 2024 & 2032
- Figure 40: Middle East & Africa General Surgical Instruments Volume (K), by Application 2024 & 2032
- Figure 41: Middle East & Africa General Surgical Instruments Revenue Share (%), by Application 2024 & 2032
- Figure 42: Middle East & Africa General Surgical Instruments Volume Share (%), by Application 2024 & 2032
- Figure 43: Middle East & Africa General Surgical Instruments Revenue (million), by Types 2024 & 2032
- Figure 44: Middle East & Africa General Surgical Instruments Volume (K), by Types 2024 & 2032
- Figure 45: Middle East & Africa General Surgical Instruments Revenue Share (%), by Types 2024 & 2032
- Figure 46: Middle East & Africa General Surgical Instruments Volume Share (%), by Types 2024 & 2032
- Figure 47: Middle East & Africa General Surgical Instruments Revenue (million), by Country 2024 & 2032
- Figure 48: Middle East & Africa General Surgical Instruments Volume (K), by Country 2024 & 2032
- Figure 49: Middle East & Africa General Surgical Instruments Revenue Share (%), by Country 2024 & 2032
- Figure 50: Middle East & Africa General Surgical Instruments Volume Share (%), by Country 2024 & 2032
- Figure 51: Asia Pacific General Surgical Instruments Revenue (million), by Application 2024 & 2032
- Figure 52: Asia Pacific General Surgical Instruments Volume (K), by Application 2024 & 2032
- Figure 53: Asia Pacific General Surgical Instruments Revenue Share (%), by Application 2024 & 2032
- Figure 54: Asia Pacific General Surgical Instruments Volume Share (%), by Application 2024 & 2032
- Figure 55: Asia Pacific General Surgical Instruments Revenue (million), by Types 2024 & 2032
- Figure 56: Asia Pacific General Surgical Instruments Volume (K), by Types 2024 & 2032
- Figure 57: Asia Pacific General Surgical Instruments Revenue Share (%), by Types 2024 & 2032
- Figure 58: Asia Pacific General Surgical Instruments Volume Share (%), by Types 2024 & 2032
- Figure 59: Asia Pacific General Surgical Instruments Revenue (million), by Country 2024 & 2032
- Figure 60: Asia Pacific General Surgical Instruments Volume (K), by Country 2024 & 2032
- Figure 61: Asia Pacific General Surgical Instruments Revenue Share (%), by Country 2024 & 2032
- Figure 62: Asia Pacific General Surgical Instruments Volume Share (%), by Country 2024 & 2032
List of Tables
- Table 1: Global General Surgical Instruments Revenue million Forecast, by Region 2019 & 2032
- Table 2: Global General Surgical Instruments Volume K Forecast, by Region 2019 & 2032
- Table 3: Global General Surgical Instruments Revenue million Forecast, by Application 2019 & 2032
- Table 4: Global General Surgical Instruments Volume K Forecast, by Application 2019 & 2032
- Table 5: Global General Surgical Instruments Revenue million Forecast, by Types 2019 & 2032
- Table 6: Global General Surgical Instruments Volume K Forecast, by Types 2019 & 2032
- Table 7: Global General Surgical Instruments Revenue million Forecast, by Region 2019 & 2032
- Table 8: Global General Surgical Instruments Volume K Forecast, by Region 2019 & 2032
- Table 9: Global General Surgical Instruments Revenue million Forecast, by Application 2019 & 2032
- Table 10: Global General Surgical Instruments Volume K Forecast, by Application 2019 & 2032
- Table 11: Global General Surgical Instruments Revenue million Forecast, by Types 2019 & 2032
- Table 12: Global General Surgical Instruments Volume K Forecast, by Types 2019 & 2032
- Table 13: Global General Surgical Instruments Revenue million Forecast, by Country 2019 & 2032
- Table 14: Global General Surgical Instruments Volume K Forecast, by Country 2019 & 2032
- Table 15: United States General Surgical Instruments Revenue (million) Forecast, by Application 2019 & 2032
- Table 16: United States General Surgical Instruments Volume (K) Forecast, by Application 2019 & 2032
- Table 17: Canada General Surgical Instruments Revenue (million) Forecast, by Application 2019 & 2032
- Table 18: Canada General Surgical Instruments Volume (K) Forecast, by Application 2019 & 2032
- Table 19: Mexico General Surgical Instruments Revenue (million) Forecast, by Application 2019 & 2032
- Table 20: Mexico General Surgical Instruments Volume (K) Forecast, by Application 2019 & 2032
- Table 21: Global General Surgical Instruments Revenue million Forecast, by Application 2019 & 2032
- Table 22: Global General Surgical Instruments Volume K Forecast, by Application 2019 & 2032
- Table 23: Global General Surgical Instruments Revenue million Forecast, by Types 2019 & 2032
- Table 24: Global General Surgical Instruments Volume K Forecast, by Types 2019 & 2032
- Table 25: Global General Surgical Instruments Revenue million Forecast, by Country 2019 & 2032
- Table 26: Global General Surgical Instruments Volume K Forecast, by Country 2019 & 2032
- Table 27: Brazil General Surgical Instruments Revenue (million) Forecast, by Application 2019 & 2032
- Table 28: Brazil General Surgical Instruments Volume (K) Forecast, by Application 2019 & 2032
- Table 29: Argentina General Surgical Instruments Revenue (million) Forecast, by Application 2019 & 2032
- Table 30: Argentina General Surgical Instruments Volume (K) Forecast, by Application 2019 & 2032
- Table 31: Rest of South America General Surgical Instruments Revenue (million) Forecast, by Application 2019 & 2032
- Table 32: Rest of South America General Surgical Instruments Volume (K) Forecast, by Application 2019 & 2032
- Table 33: Global General Surgical Instruments Revenue million Forecast, by Application 2019 & 2032
- Table 34: Global General Surgical Instruments Volume K Forecast, by Application 2019 & 2032
- Table 35: Global General Surgical Instruments Revenue million Forecast, by Types 2019 & 2032
- Table 36: Global General Surgical Instruments Volume K Forecast, by Types 2019 & 2032
- Table 37: Global General Surgical Instruments Revenue million Forecast, by Country 2019 & 2032
- Table 38: Global General Surgical Instruments Volume K Forecast, by Country 2019 & 2032
- Table 39: United Kingdom General Surgical Instruments Revenue (million) Forecast, by Application 2019 & 2032
- Table 40: United Kingdom General Surgical Instruments Volume (K) Forecast, by Application 2019 & 2032
- Table 41: Germany General Surgical Instruments Revenue (million) Forecast, by Application 2019 & 2032
- Table 42: Germany General Surgical Instruments Volume (K) Forecast, by Application 2019 & 2032
- Table 43: France General Surgical Instruments Revenue (million) Forecast, by Application 2019 & 2032
- Table 44: France General Surgical Instruments Volume (K) Forecast, by Application 2019 & 2032
- Table 45: Italy General Surgical Instruments Revenue (million) Forecast, by Application 2019 & 2032
- Table 46: Italy General Surgical Instruments Volume (K) Forecast, by Application 2019 & 2032
- Table 47: Spain General Surgical Instruments Revenue (million) Forecast, by Application 2019 & 2032
- Table 48: Spain General Surgical Instruments Volume (K) Forecast, by Application 2019 & 2032
- Table 49: Russia General Surgical Instruments Revenue (million) Forecast, by Application 2019 & 2032
- Table 50: Russia General Surgical Instruments Volume (K) Forecast, by Application 2019 & 2032
- Table 51: Benelux General Surgical Instruments Revenue (million) Forecast, by Application 2019 & 2032
- Table 52: Benelux General Surgical Instruments Volume (K) Forecast, by Application 2019 & 2032
- Table 53: Nordics General Surgical Instruments Revenue (million) Forecast, by Application 2019 & 2032
- Table 54: Nordics General Surgical Instruments Volume (K) Forecast, by Application 2019 & 2032
- Table 55: Rest of Europe General Surgical Instruments Revenue (million) Forecast, by Application 2019 & 2032
- Table 56: Rest of Europe General Surgical Instruments Volume (K) Forecast, by Application 2019 & 2032
- Table 57: Global General Surgical Instruments Revenue million Forecast, by Application 2019 & 2032
- Table 58: Global General Surgical Instruments Volume K Forecast, by Application 2019 & 2032
- Table 59: Global General Surgical Instruments Revenue million Forecast, by Types 2019 & 2032
- Table 60: Global General Surgical Instruments Volume K Forecast, by Types 2019 & 2032
- Table 61: Global General Surgical Instruments Revenue million Forecast, by Country 2019 & 2032
- Table 62: Global General Surgical Instruments Volume K Forecast, by Country 2019 & 2032
- Table 63: Turkey General Surgical Instruments Revenue (million) Forecast, by Application 2019 & 2032
- Table 64: Turkey General Surgical Instruments Volume (K) Forecast, by Application 2019 & 2032
- Table 65: Israel General Surgical Instruments Revenue (million) Forecast, by Application 2019 & 2032
- Table 66: Israel General Surgical Instruments Volume (K) Forecast, by Application 2019 & 2032
- Table 67: GCC General Surgical Instruments Revenue (million) Forecast, by Application 2019 & 2032
- Table 68: GCC General Surgical Instruments Volume (K) Forecast, by Application 2019 & 2032
- Table 69: North Africa General Surgical Instruments Revenue (million) Forecast, by Application 2019 & 2032
- Table 70: North Africa General Surgical Instruments Volume (K) Forecast, by Application 2019 & 2032
- Table 71: South Africa General Surgical Instruments Revenue (million) Forecast, by Application 2019 & 2032
- Table 72: South Africa General Surgical Instruments Volume (K) Forecast, by Application 2019 & 2032
- Table 73: Rest of Middle East & Africa General Surgical Instruments Revenue (million) Forecast, by Application 2019 & 2032
- Table 74: Rest of Middle East & Africa General Surgical Instruments Volume (K) Forecast, by Application 2019 & 2032
- Table 75: Global General Surgical Instruments Revenue million Forecast, by Application 2019 & 2032
- Table 76: Global General Surgical Instruments Volume K Forecast, by Application 2019 & 2032
- Table 77: Global General Surgical Instruments Revenue million Forecast, by Types 2019 & 2032
- Table 78: Global General Surgical Instruments Volume K Forecast, by Types 2019 & 2032
- Table 79: Global General Surgical Instruments Revenue million Forecast, by Country 2019 & 2032
- Table 80: Global General Surgical Instruments Volume K Forecast, by Country 2019 & 2032
- Table 81: China General Surgical Instruments Revenue (million) Forecast, by Application 2019 & 2032
- Table 82: China General Surgical Instruments Volume (K) Forecast, by Application 2019 & 2032
- Table 83: India General Surgical Instruments Revenue (million) Forecast, by Application 2019 & 2032
- Table 84: India General Surgical Instruments Volume (K) Forecast, by Application 2019 & 2032
- Table 85: Japan General Surgical Instruments Revenue (million) Forecast, by Application 2019 & 2032
- Table 86: Japan General Surgical Instruments Volume (K) Forecast, by Application 2019 & 2032
- Table 87: South Korea General Surgical Instruments Revenue (million) Forecast, by Application 2019 & 2032
- Table 88: South Korea General Surgical Instruments Volume (K) Forecast, by Application 2019 & 2032
- Table 89: ASEAN General Surgical Instruments Revenue (million) Forecast, by Application 2019 & 2032
- Table 90: ASEAN General Surgical Instruments Volume (K) Forecast, by Application 2019 & 2032
- Table 91: Oceania General Surgical Instruments Revenue (million) Forecast, by Application 2019 & 2032
- Table 92: Oceania General Surgical Instruments Volume (K) Forecast, by Application 2019 & 2032
- Table 93: Rest of Asia Pacific General Surgical Instruments Revenue (million) Forecast, by Application 2019 & 2032
- Table 94: Rest of Asia Pacific General Surgical Instruments Volume (K) Forecast, by Application 2019 & 2032
Frequently Asked Questions
1. What is the projected Compound Annual Growth Rate (CAGR) of the General Surgical Instruments?
The projected CAGR is approximately XX%.
2. Which companies are prominent players in the General Surgical Instruments?
Key companies in the market include Johnson & Johnson, BD, B. Braun Melsungen, Hill-Rom, Mani, Medtronic, Swann-Morton, Feather, KAI Group, Zimmer Biomet, KLS Martin, SteriLance, Huaiyin Medical.
3. What are the main segments of the General Surgical Instruments?
The market segments include Application, Types.
4. Can you provide details about the market size?
The market size is estimated to be USD XXX million as of 2022.
5. What are some drivers contributing to market growth?
N/A
6. What are the notable trends driving market growth?
N/A
7. Are there any restraints impacting market growth?
N/A
8. Can you provide examples of recent developments in the market?
N/A
9. What pricing options are available for accessing the report?
Pricing options include single-user, multi-user, and enterprise licenses priced at USD 3350.00, USD 5025.00, and USD 6700.00 respectively.
10. Is the market size provided in terms of value or volume?
The market size is provided in terms of value, measured in million and volume, measured in K.
11. Are there any specific market keywords associated with the report?
Yes, the market keyword associated with the report is "General Surgical Instruments," which aids in identifying and referencing the specific market segment covered.
12. How do I determine which pricing option suits my needs best?
The pricing options vary based on user requirements and access needs. Individual users may opt for single-user licenses, while businesses requiring broader access may choose multi-user or enterprise licenses for cost-effective access to the report.
13. Are there any additional resources or data provided in the General Surgical Instruments report?
While the report offers comprehensive insights, it's advisable to review the specific contents or supplementary materials provided to ascertain if additional resources or data are available.
14. How can I stay updated on further developments or reports in the General Surgical Instruments?
To stay informed about further developments, trends, and reports in the General Surgical Instruments, consider subscribing to industry newsletters, following relevant companies and organizations, or regularly checking reputable industry news sources and publications.
Methodology
Step 1 - Identification of Relevant Samples Size from Population Database


Step 2 - Approaches for Defining Global Market Size (Value, Volume* & Price*)

Note*: In applicable scenarios
Step 3 - Data Sources
Primary Research
- Web Analytics
- Survey Reports
- Research Institute
- Latest Research Reports
- Opinion Leaders
Secondary Research
- Annual Reports
- White Paper
- Latest Press Release
- Industry Association
- Paid Database
- Investor Presentations

Step 4 - Data Triangulation
Involves using different sources of information in order to increase the validity of a study
These sources are likely to be stakeholders in a program - participants, other researchers, program staff, other community members, and so on.
Then we put all data in single framework & apply various statistical tools to find out the dynamic on the market.
During the analysis stage, feedback from the stakeholder groups would be compared to determine areas of agreement as well as areas of divergence


