
Key Insights
The global gamma irradiators market is experiencing robust growth, driven by increasing demand for sterilization and preservation of medical devices, pharmaceuticals, and food products. The market's expansion is fueled by stringent regulatory requirements for product safety and hygiene across various industries, coupled with the rising adoption of gamma irradiation as a cost-effective and efficient sterilization method compared to other techniques like ethylene oxide. Advancements in irradiator technology, including the development of more efficient and compact units, are further contributing to market expansion. While the initial investment in gamma irradiator infrastructure can be significant, the long-term operational costs are relatively low, making it a financially attractive solution for large-scale sterilization needs. The market is segmented based on application (medical devices, pharmaceuticals, food, etc.), irradiator type (Co-60, Cs-137), and geographical region. Key players like Nordion and Hopewell Designs are actively engaged in developing innovative irradiator designs and expanding their global reach, leading to increased competition and market consolidation. The historical period (2019-2024) showed a steady increase in market size, with a projected CAGR continuing into the forecast period (2025-2033).
The market's growth trajectory is expected to be influenced by factors such as increasing awareness of food safety concerns, the rising prevalence of infectious diseases, and the continued growth of the healthcare and pharmaceutical sectors. However, potential restraints include the stringent regulatory approvals required for operating gamma irradiators, the associated safety concerns related to handling radioactive materials, and the potential for environmental impacts if not managed properly. Furthermore, the high capital expenditure required for installation and maintenance could limit market penetration in developing economies. Future growth will likely be driven by technological innovations in radiation shielding, automation, and remote monitoring capabilities to enhance safety and efficiency. Strategic partnerships and acquisitions among industry players will also shape the competitive landscape in the coming years.
This comprehensive report provides an in-depth analysis of the global Gamma Irradiators market, offering invaluable insights for stakeholders seeking to navigate this dynamic sector. The study period spans from 2019 to 2033, with 2025 serving as the base and estimated year. The forecast period is 2025-2033, and the historical period covers 2019-2024. This report meticulously examines market structure, competitive dynamics, industry trends, leading players, and future growth prospects, utilizing millions as the unit for all market value figures.
Gamma Irradiators Market Structure & Competitive Dynamics
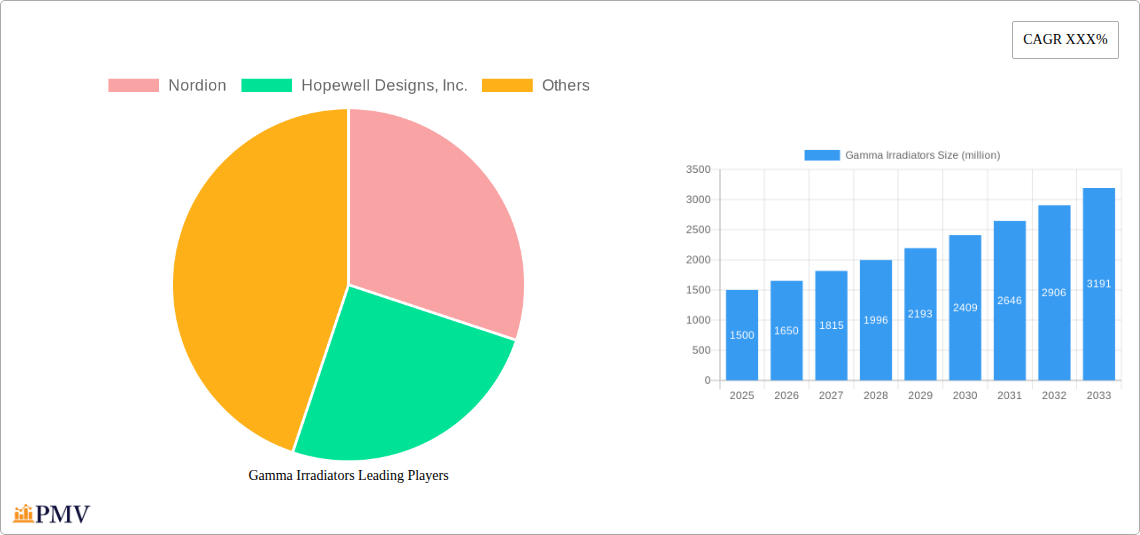
The Gamma Irradiators market exhibits a moderately consolidated structure with a few major players holding significant market share. Nordion and Hopewell Designs, Inc. are key examples of established players, with Nordion potentially holding around xx million USD in market share in 2025, while Hopewell Designs, Inc. commands approximately xx million USD. Innovation is driven by ongoing research into improved radiation efficiency and safety features. Regulatory frameworks vary across regions, influencing adoption rates and necessitating compliance with stringent safety protocols. Product substitutes, such as electron beam irradiation, exist but Gamma irradiation often maintains a competitive edge due to its established track record and cost-effectiveness for certain applications.
End-user trends reveal a growing demand across diverse sectors, including medical sterilization, food irradiation, and industrial applications. M&A activity in the sector has been moderate in recent years, with deal values ranging from xx million USD to xx million USD in individual transactions. This activity reflects strategic consolidation and expansion efforts by larger players seeking to capture market share and enhance their product portfolios. Smaller companies are increasingly focusing on niche applications and technological innovation to gain a competitive edge.
- Market Concentration: Moderately consolidated.
- Innovation Ecosystems: Focused on efficiency and safety improvements.
- Regulatory Frameworks: Vary significantly across regions.
- Product Substitutes: Electron beam irradiation, but Gamma Irradiation remains prominent.
- M&A Activity: Moderate, with deals valuing xx million USD to xx million USD.
Gamma Irradiators Industry Trends & Insights
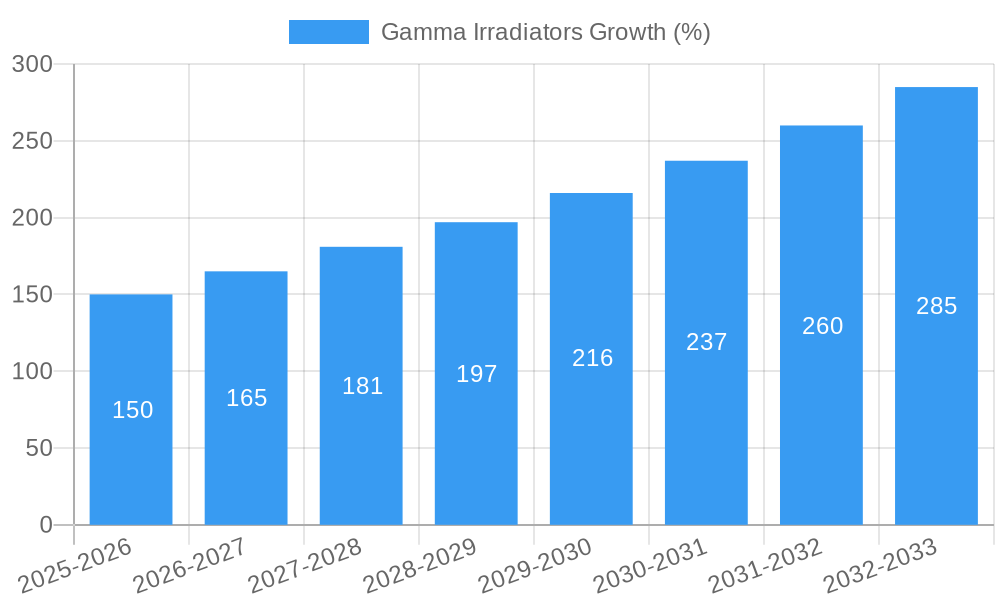
The Gamma Irradiators market is projected to experience a CAGR of xx% during the forecast period (2025-2033), driven primarily by the increasing demand for sterilized medical devices and irradiated food products globally. Technological advancements, including the development of more efficient and compact irradiators, are further fueling market expansion. Consumer preferences are increasingly shifting towards safer and more effectively preserved food products, bolstering the demand for food irradiation services. The market penetration rate in developing economies is expected to increase significantly due to growing awareness of the benefits of gamma irradiation and rising disposable incomes. Competitive dynamics are shaped by both established players and emerging companies vying for market share through innovation, cost optimization, and strategic partnerships.
Dominant Markets & Segments in Gamma Irradiators
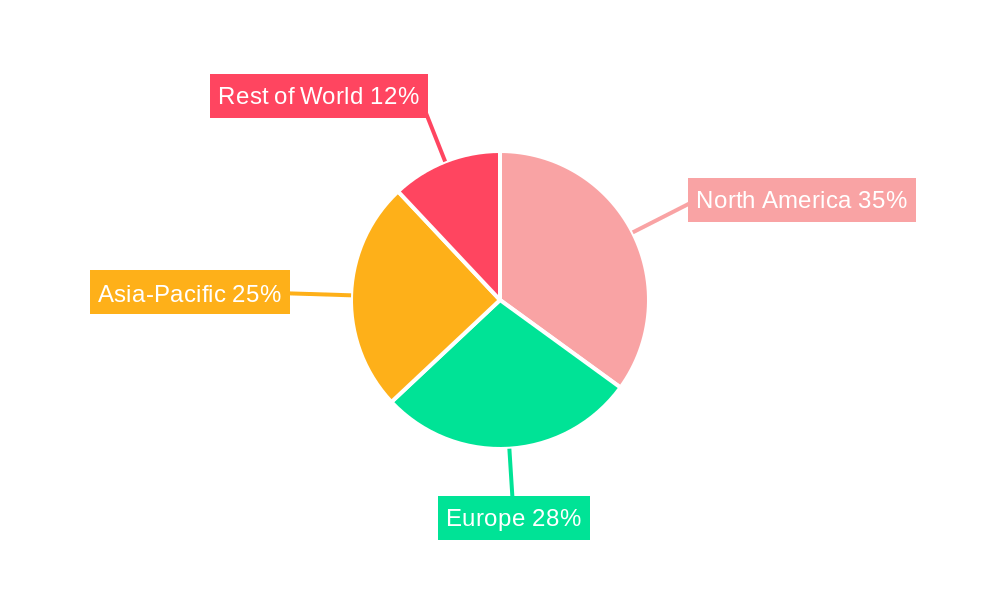
The North American market currently dominates the Gamma Irradiators sector, representing approximately xx million USD in market value in 2025. This dominance stems from several key factors:
- Robust healthcare infrastructure: A well-established healthcare system drives demand for medical sterilization services.
- Stringent regulatory environment: While demanding, this framework fosters trust in the technology and its efficacy.
- High disposable income: Enables increased consumer spending on processed and preserved food products.
- Government support for technological advancements: Funding and initiatives support ongoing innovation.
The European market follows closely, accounting for an approximate xx million USD market value. Asia-Pacific is experiencing rapid growth, driven by a burgeoning middle class and increasing investment in healthcare and food processing infrastructure. This region is projected to become a significant market player in the coming years, with projected annual growth exceeding xx% over the next five years.
Gamma Irradiators Product Innovations
Recent innovations in Gamma irradiators focus on enhancing efficiency, reducing operational costs, and improving safety features. Developments include more compact and modular designs, automated control systems, and advanced radiation shielding technologies. These innovations cater to the growing demand for efficient and safe irradiation solutions across various applications, enhancing market competitiveness and expanding market reach. The integration of IoT and data analytics is also emerging as a key trend.
Report Segmentation & Scope
This report segments the Gamma Irradiators market based on several key factors:
- By Application: Medical sterilization, food irradiation, industrial applications (e.g., polymer modification). Medical sterilization is the largest segment, projected to account for xx million USD in 2025, followed by food irradiation at xx million USD.
- By Geography: North America, Europe, Asia-Pacific, Middle East & Africa, and South America. Each geographic segment displays unique growth trajectories and competitive landscapes.
- By Irradiator Type: Cobalt-60 based systems, Cesium-137 based systems.
Key Drivers of Gamma Irradiators Growth
The Gamma Irradiators market growth is propelled by several key factors:
- Rising demand for sterile medical devices: The increasing prevalence of infectious diseases necessitates higher levels of sterilization.
- Growing consumer preference for safe and preserved food: Demand for extended shelf life and reduced foodborne illnesses is boosting food irradiation.
- Technological advancements: Enhanced efficiency and safety features are broadening the applications of Gamma irradiators.
- Government regulations and initiatives: Support for irradiation technologies is fostering market growth.
Challenges in the Gamma Irradiators Sector
The Gamma Irradiators market faces several challenges:
- Stringent regulatory approvals: Navigating the regulatory hurdles in different regions can be time-consuming and costly.
- High initial investment costs: The setup and maintenance of irradiators require significant upfront investments, limiting entry for smaller companies.
- Concerns about radiation safety: Addressing public concerns regarding radiation safety is crucial for market acceptance.
- Competition from alternative sterilization methods: Electron beam and other methods pose competitive threats.
Leading Players in the Gamma Irradiators Market
- Nordion
- Hopewell Designs, Inc.
Key Developments in Gamma Irradiators Sector
- 2022 Q4: Nordion launched a new generation of Gamma irradiator with improved efficiency.
- 2023 Q1: Hopewell Designs, Inc. secured a significant contract for food irradiation services in the Asian market.
- 2024 Q3: A major merger between two smaller Gamma irradiator manufacturers resulted in increased market concentration.
Strategic Gamma Irradiators Market Outlook
The Gamma Irradiators market is poised for continued growth, driven by ongoing technological advancements, expanding applications, and increasing regulatory support. Strategic opportunities exist for companies focusing on innovation, cost optimization, and expansion into emerging markets. Companies specializing in developing advanced irradiation technologies, efficient service delivery models, and strong regulatory compliance will have a competitive advantage. The market is expected to witness further consolidation as larger players seek to enhance their market presence and expand their service offerings.
Gamma Irradiators Segmentation
-
1. Application
- 1.1. Hospital
- 1.2. Research Institutions
- 1.3. Other
-
2. Type
- 2.1. Below 100 Ci
- 2.2. 100-1000 Ci
- 2.3. Above 1000 Ci
Gamma Irradiators Segmentation By Geography
-
1. North America
- 1.1. United States
- 1.2. Canada
- 1.3. Mexico
-
2. South America
- 2.1. Brazil
- 2.2. Argentina
- 2.3. Rest of South America
-
3. Europe
- 3.1. United Kingdom
- 3.2. Germany
- 3.3. France
- 3.4. Italy
- 3.5. Spain
- 3.6. Russia
- 3.7. Benelux
- 3.8. Nordics
- 3.9. Rest of Europe
-
4. Middle East & Africa
- 4.1. Turkey
- 4.2. Israel
- 4.3. GCC
- 4.4. North Africa
- 4.5. South Africa
- 4.6. Rest of Middle East & Africa
-
5. Asia Pacific
- 5.1. China
- 5.2. India
- 5.3. Japan
- 5.4. South Korea
- 5.5. ASEAN
- 5.6. Oceania
- 5.7. Rest of Asia Pacific
Gamma Irradiators REPORT HIGHLIGHTS
| Aspects | Details |
|---|---|
| Study Period | 2019-2033 |
| Base Year | 2024 |
| Estimated Year | 2025 |
| Forecast Period | 2025-2033 |
| Historical Period | 2019-2024 |
| Growth Rate | CAGR of XXX% from 2019-2033 |
| Segmentation |
|
Table of Contents
- 1. Introduction
- 1.1. Research Scope
- 1.2. Market Segmentation
- 1.3. Research Methodology
- 1.4. Definitions and Assumptions
- 2. Executive Summary
- 2.1. Introduction
- 3. Market Dynamics
- 3.1. Introduction
- 3.2. Market Drivers
- 3.3. Market Restrains
- 3.4. Market Trends
- 4. Market Factor Analysis
- 4.1. Porters Five Forces
- 4.2. Supply/Value Chain
- 4.3. PESTEL analysis
- 4.4. Market Entropy
- 4.5. Patent/Trademark Analysis
- 5. Global Gamma Irradiators Analysis, Insights and Forecast, 2019-2031
- 5.1. Market Analysis, Insights and Forecast - by Application
- 5.1.1. Hospital
- 5.1.2. Research Institutions
- 5.1.3. Other
- 5.2. Market Analysis, Insights and Forecast - by Type
- 5.2.1. Below 100 Ci
- 5.2.2. 100-1000 Ci
- 5.2.3. Above 1000 Ci
- 5.3. Market Analysis, Insights and Forecast - by Region
- 5.3.1. North America
- 5.3.2. South America
- 5.3.3. Europe
- 5.3.4. Middle East & Africa
- 5.3.5. Asia Pacific
- 5.1. Market Analysis, Insights and Forecast - by Application
- 6. North America Gamma Irradiators Analysis, Insights and Forecast, 2019-2031
- 6.1. Market Analysis, Insights and Forecast - by Application
- 6.1.1. Hospital
- 6.1.2. Research Institutions
- 6.1.3. Other
- 6.2. Market Analysis, Insights and Forecast - by Type
- 6.2.1. Below 100 Ci
- 6.2.2. 100-1000 Ci
- 6.2.3. Above 1000 Ci
- 6.1. Market Analysis, Insights and Forecast - by Application
- 7. South America Gamma Irradiators Analysis, Insights and Forecast, 2019-2031
- 7.1. Market Analysis, Insights and Forecast - by Application
- 7.1.1. Hospital
- 7.1.2. Research Institutions
- 7.1.3. Other
- 7.2. Market Analysis, Insights and Forecast - by Type
- 7.2.1. Below 100 Ci
- 7.2.2. 100-1000 Ci
- 7.2.3. Above 1000 Ci
- 7.1. Market Analysis, Insights and Forecast - by Application
- 8. Europe Gamma Irradiators Analysis, Insights and Forecast, 2019-2031
- 8.1. Market Analysis, Insights and Forecast - by Application
- 8.1.1. Hospital
- 8.1.2. Research Institutions
- 8.1.3. Other
- 8.2. Market Analysis, Insights and Forecast - by Type
- 8.2.1. Below 100 Ci
- 8.2.2. 100-1000 Ci
- 8.2.3. Above 1000 Ci
- 8.1. Market Analysis, Insights and Forecast - by Application
- 9. Middle East & Africa Gamma Irradiators Analysis, Insights and Forecast, 2019-2031
- 9.1. Market Analysis, Insights and Forecast - by Application
- 9.1.1. Hospital
- 9.1.2. Research Institutions
- 9.1.3. Other
- 9.2. Market Analysis, Insights and Forecast - by Type
- 9.2.1. Below 100 Ci
- 9.2.2. 100-1000 Ci
- 9.2.3. Above 1000 Ci
- 9.1. Market Analysis, Insights and Forecast - by Application
- 10. Asia Pacific Gamma Irradiators Analysis, Insights and Forecast, 2019-2031
- 10.1. Market Analysis, Insights and Forecast - by Application
- 10.1.1. Hospital
- 10.1.2. Research Institutions
- 10.1.3. Other
- 10.2. Market Analysis, Insights and Forecast - by Type
- 10.2.1. Below 100 Ci
- 10.2.2. 100-1000 Ci
- 10.2.3. Above 1000 Ci
- 10.1. Market Analysis, Insights and Forecast - by Application
- 11. Competitive Analysis
- 11.1. Global Market Share Analysis 2024
- 11.2. Company Profiles
- 11.2.1 Nordion
- 11.2.1.1. Overview
- 11.2.1.2. Products
- 11.2.1.3. SWOT Analysis
- 11.2.1.4. Recent Developments
- 11.2.1.5. Financials (Based on Availability)
- 11.2.2 Hopewell Designs Inc.
- 11.2.2.1. Overview
- 11.2.2.2. Products
- 11.2.2.3. SWOT Analysis
- 11.2.2.4. Recent Developments
- 11.2.2.5. Financials (Based on Availability)
- 11.2.1 Nordion
List of Figures
- Figure 1: Global Gamma Irradiators Revenue Breakdown (million, %) by Region 2024 & 2032
- Figure 2: North America Gamma Irradiators Revenue (million), by Application 2024 & 2032
- Figure 3: North America Gamma Irradiators Revenue Share (%), by Application 2024 & 2032
- Figure 4: North America Gamma Irradiators Revenue (million), by Type 2024 & 2032
- Figure 5: North America Gamma Irradiators Revenue Share (%), by Type 2024 & 2032
- Figure 6: North America Gamma Irradiators Revenue (million), by Country 2024 & 2032
- Figure 7: North America Gamma Irradiators Revenue Share (%), by Country 2024 & 2032
- Figure 8: South America Gamma Irradiators Revenue (million), by Application 2024 & 2032
- Figure 9: South America Gamma Irradiators Revenue Share (%), by Application 2024 & 2032
- Figure 10: South America Gamma Irradiators Revenue (million), by Type 2024 & 2032
- Figure 11: South America Gamma Irradiators Revenue Share (%), by Type 2024 & 2032
- Figure 12: South America Gamma Irradiators Revenue (million), by Country 2024 & 2032
- Figure 13: South America Gamma Irradiators Revenue Share (%), by Country 2024 & 2032
- Figure 14: Europe Gamma Irradiators Revenue (million), by Application 2024 & 2032
- Figure 15: Europe Gamma Irradiators Revenue Share (%), by Application 2024 & 2032
- Figure 16: Europe Gamma Irradiators Revenue (million), by Type 2024 & 2032
- Figure 17: Europe Gamma Irradiators Revenue Share (%), by Type 2024 & 2032
- Figure 18: Europe Gamma Irradiators Revenue (million), by Country 2024 & 2032
- Figure 19: Europe Gamma Irradiators Revenue Share (%), by Country 2024 & 2032
- Figure 20: Middle East & Africa Gamma Irradiators Revenue (million), by Application 2024 & 2032
- Figure 21: Middle East & Africa Gamma Irradiators Revenue Share (%), by Application 2024 & 2032
- Figure 22: Middle East & Africa Gamma Irradiators Revenue (million), by Type 2024 & 2032
- Figure 23: Middle East & Africa Gamma Irradiators Revenue Share (%), by Type 2024 & 2032
- Figure 24: Middle East & Africa Gamma Irradiators Revenue (million), by Country 2024 & 2032
- Figure 25: Middle East & Africa Gamma Irradiators Revenue Share (%), by Country 2024 & 2032
- Figure 26: Asia Pacific Gamma Irradiators Revenue (million), by Application 2024 & 2032
- Figure 27: Asia Pacific Gamma Irradiators Revenue Share (%), by Application 2024 & 2032
- Figure 28: Asia Pacific Gamma Irradiators Revenue (million), by Type 2024 & 2032
- Figure 29: Asia Pacific Gamma Irradiators Revenue Share (%), by Type 2024 & 2032
- Figure 30: Asia Pacific Gamma Irradiators Revenue (million), by Country 2024 & 2032
- Figure 31: Asia Pacific Gamma Irradiators Revenue Share (%), by Country 2024 & 2032
List of Tables
- Table 1: Global Gamma Irradiators Revenue million Forecast, by Region 2019 & 2032
- Table 2: Global Gamma Irradiators Revenue million Forecast, by Application 2019 & 2032
- Table 3: Global Gamma Irradiators Revenue million Forecast, by Type 2019 & 2032
- Table 4: Global Gamma Irradiators Revenue million Forecast, by Region 2019 & 2032
- Table 5: Global Gamma Irradiators Revenue million Forecast, by Application 2019 & 2032
- Table 6: Global Gamma Irradiators Revenue million Forecast, by Type 2019 & 2032
- Table 7: Global Gamma Irradiators Revenue million Forecast, by Country 2019 & 2032
- Table 8: United States Gamma Irradiators Revenue (million) Forecast, by Application 2019 & 2032
- Table 9: Canada Gamma Irradiators Revenue (million) Forecast, by Application 2019 & 2032
- Table 10: Mexico Gamma Irradiators Revenue (million) Forecast, by Application 2019 & 2032
- Table 11: Global Gamma Irradiators Revenue million Forecast, by Application 2019 & 2032
- Table 12: Global Gamma Irradiators Revenue million Forecast, by Type 2019 & 2032
- Table 13: Global Gamma Irradiators Revenue million Forecast, by Country 2019 & 2032
- Table 14: Brazil Gamma Irradiators Revenue (million) Forecast, by Application 2019 & 2032
- Table 15: Argentina Gamma Irradiators Revenue (million) Forecast, by Application 2019 & 2032
- Table 16: Rest of South America Gamma Irradiators Revenue (million) Forecast, by Application 2019 & 2032
- Table 17: Global Gamma Irradiators Revenue million Forecast, by Application 2019 & 2032
- Table 18: Global Gamma Irradiators Revenue million Forecast, by Type 2019 & 2032
- Table 19: Global Gamma Irradiators Revenue million Forecast, by Country 2019 & 2032
- Table 20: United Kingdom Gamma Irradiators Revenue (million) Forecast, by Application 2019 & 2032
- Table 21: Germany Gamma Irradiators Revenue (million) Forecast, by Application 2019 & 2032
- Table 22: France Gamma Irradiators Revenue (million) Forecast, by Application 2019 & 2032
- Table 23: Italy Gamma Irradiators Revenue (million) Forecast, by Application 2019 & 2032
- Table 24: Spain Gamma Irradiators Revenue (million) Forecast, by Application 2019 & 2032
- Table 25: Russia Gamma Irradiators Revenue (million) Forecast, by Application 2019 & 2032
- Table 26: Benelux Gamma Irradiators Revenue (million) Forecast, by Application 2019 & 2032
- Table 27: Nordics Gamma Irradiators Revenue (million) Forecast, by Application 2019 & 2032
- Table 28: Rest of Europe Gamma Irradiators Revenue (million) Forecast, by Application 2019 & 2032
- Table 29: Global Gamma Irradiators Revenue million Forecast, by Application 2019 & 2032
- Table 30: Global Gamma Irradiators Revenue million Forecast, by Type 2019 & 2032
- Table 31: Global Gamma Irradiators Revenue million Forecast, by Country 2019 & 2032
- Table 32: Turkey Gamma Irradiators Revenue (million) Forecast, by Application 2019 & 2032
- Table 33: Israel Gamma Irradiators Revenue (million) Forecast, by Application 2019 & 2032
- Table 34: GCC Gamma Irradiators Revenue (million) Forecast, by Application 2019 & 2032
- Table 35: North Africa Gamma Irradiators Revenue (million) Forecast, by Application 2019 & 2032
- Table 36: South Africa Gamma Irradiators Revenue (million) Forecast, by Application 2019 & 2032
- Table 37: Rest of Middle East & Africa Gamma Irradiators Revenue (million) Forecast, by Application 2019 & 2032
- Table 38: Global Gamma Irradiators Revenue million Forecast, by Application 2019 & 2032
- Table 39: Global Gamma Irradiators Revenue million Forecast, by Type 2019 & 2032
- Table 40: Global Gamma Irradiators Revenue million Forecast, by Country 2019 & 2032
- Table 41: China Gamma Irradiators Revenue (million) Forecast, by Application 2019 & 2032
- Table 42: India Gamma Irradiators Revenue (million) Forecast, by Application 2019 & 2032
- Table 43: Japan Gamma Irradiators Revenue (million) Forecast, by Application 2019 & 2032
- Table 44: South Korea Gamma Irradiators Revenue (million) Forecast, by Application 2019 & 2032
- Table 45: ASEAN Gamma Irradiators Revenue (million) Forecast, by Application 2019 & 2032
- Table 46: Oceania Gamma Irradiators Revenue (million) Forecast, by Application 2019 & 2032
- Table 47: Rest of Asia Pacific Gamma Irradiators Revenue (million) Forecast, by Application 2019 & 2032
Frequently Asked Questions
1. What is the projected Compound Annual Growth Rate (CAGR) of the Gamma Irradiators?
The projected CAGR is approximately XXX%.
2. Which companies are prominent players in the Gamma Irradiators?
Key companies in the market include Nordion, Hopewell Designs, Inc..
3. What are the main segments of the Gamma Irradiators?
The market segments include Application, Type.
4. Can you provide details about the market size?
The market size is estimated to be USD XXX million as of 2022.
5. What are some drivers contributing to market growth?
N/A
6. What are the notable trends driving market growth?
N/A
7. Are there any restraints impacting market growth?
N/A
8. Can you provide examples of recent developments in the market?
N/A
9. What pricing options are available for accessing the report?
Pricing options include single-user, multi-user, and enterprise licenses priced at USD 2900.00, USD 4350.00, and USD 5800.00 respectively.
10. Is the market size provided in terms of value or volume?
The market size is provided in terms of value, measured in million.
11. Are there any specific market keywords associated with the report?
Yes, the market keyword associated with the report is "Gamma Irradiators," which aids in identifying and referencing the specific market segment covered.
12. How do I determine which pricing option suits my needs best?
The pricing options vary based on user requirements and access needs. Individual users may opt for single-user licenses, while businesses requiring broader access may choose multi-user or enterprise licenses for cost-effective access to the report.
13. Are there any additional resources or data provided in the Gamma Irradiators report?
While the report offers comprehensive insights, it's advisable to review the specific contents or supplementary materials provided to ascertain if additional resources or data are available.
14. How can I stay updated on further developments or reports in the Gamma Irradiators?
To stay informed about further developments, trends, and reports in the Gamma Irradiators, consider subscribing to industry newsletters, following relevant companies and organizations, or regularly checking reputable industry news sources and publications.
Methodology
Step 1 - Identification of Relevant Samples Size from Population Database


Step 2 - Approaches for Defining Global Market Size (Value, Volume* & Price*)

Note*: In applicable scenarios
Step 3 - Data Sources
Primary Research
- Web Analytics
- Survey Reports
- Research Institute
- Latest Research Reports
- Opinion Leaders
Secondary Research
- Annual Reports
- White Paper
- Latest Press Release
- Industry Association
- Paid Database
- Investor Presentations

Step 4 - Data Triangulation
Involves using different sources of information in order to increase the validity of a study
These sources are likely to be stakeholders in a program - participants, other researchers, program staff, other community members, and so on.
Then we put all data in single framework & apply various statistical tools to find out the dynamic on the market.
During the analysis stage, feedback from the stakeholder groups would be compared to determine areas of agreement as well as areas of divergence


