
Key Insights
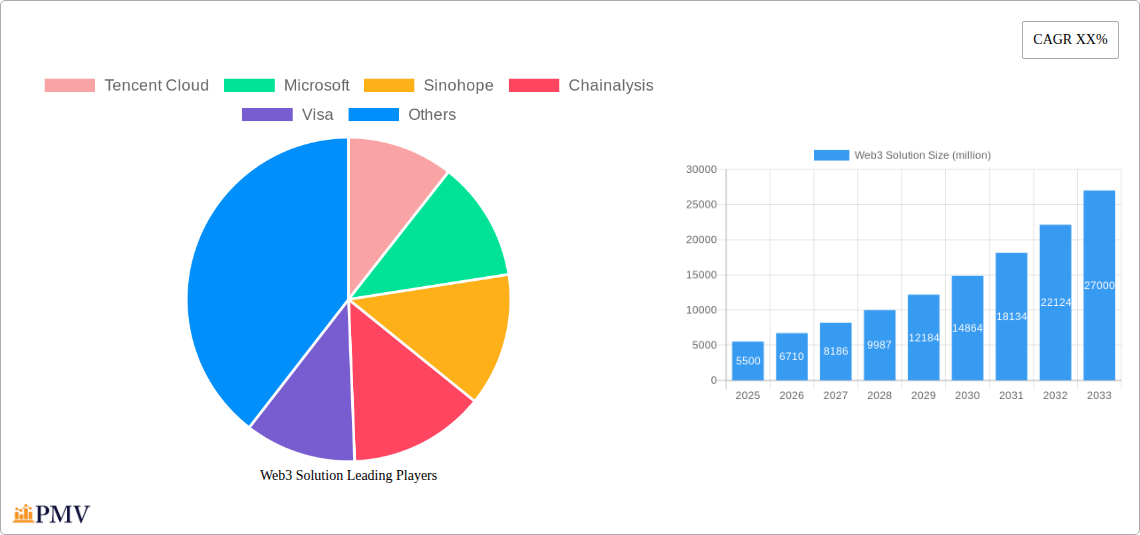
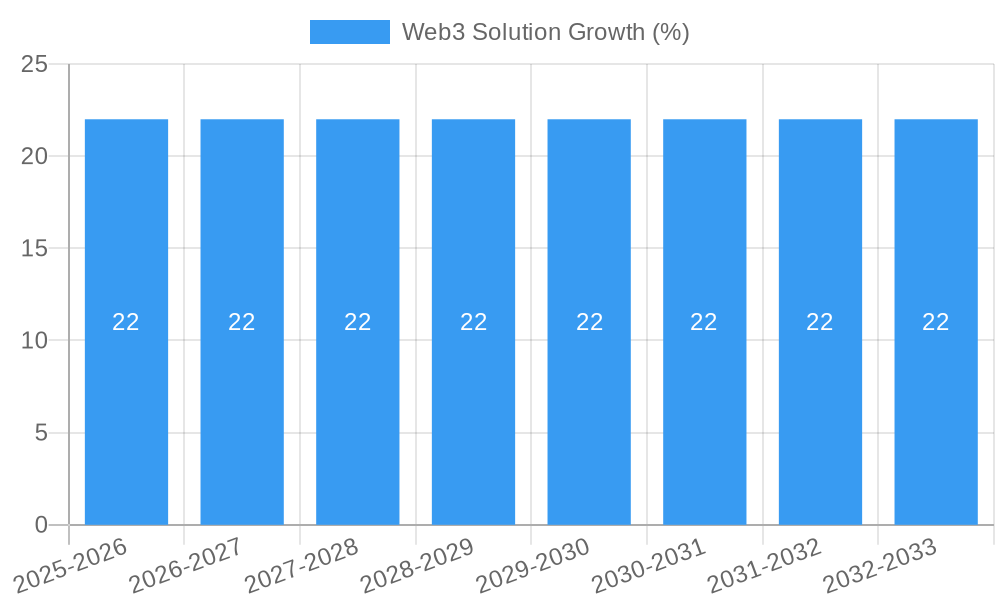
The Web3 solutions market is poised for significant expansion, projected to reach an estimated market size of $5,500 million by 2025. This surge is driven by the escalating adoption of blockchain technology across diverse sectors and the increasing demand for decentralized applications (dApps) and decentralized finance (DeFi) services. Large enterprises are increasingly recognizing the potential of Web3 for enhanced security, transparency, and operational efficiency, alongside a growing interest from Small and Medium-sized Enterprises (SMEs) seeking innovative ways to engage with customers and streamline processes. The burgeoning ecosystem of Non-Fungible Tokens (NFTs) further fuels this growth, creating new avenues for digital ownership and creative expression. As the infrastructure for Web3 solutions matures, with advancements in blockchain platforms and the development of robust dApp frameworks, the market is set to witness robust expansion. The estimated Compound Annual Growth Rate (CAGR) of 22% from 2025 to 2033 underscores the immense potential and rapid evolution of this transformative market.
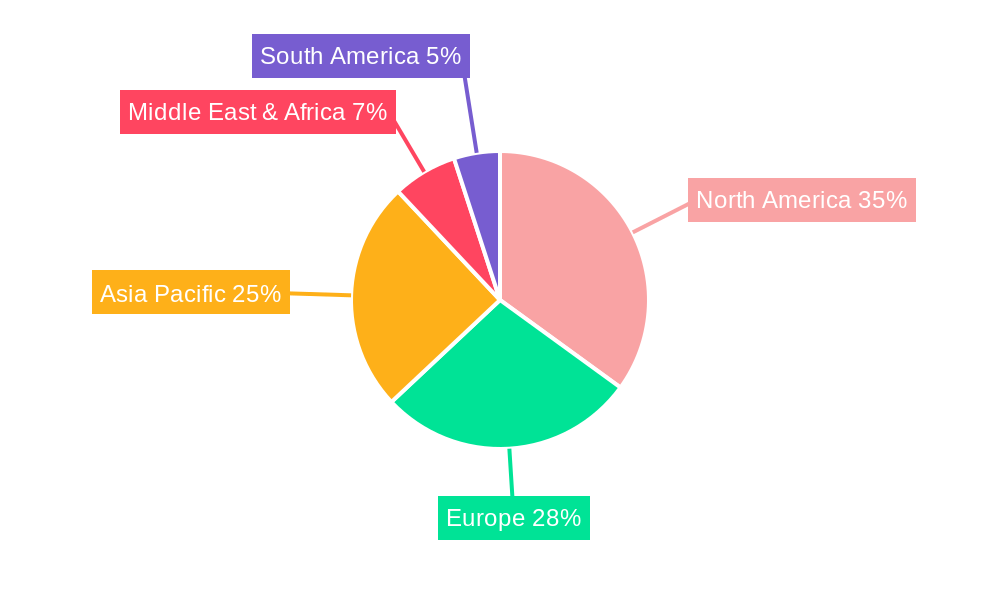
Despite the promising outlook, certain restraints could temper the pace of widespread adoption. Regulatory uncertainties surrounding cryptocurrencies and decentralized technologies, alongside concerns about scalability and user experience in nascent Web3 applications, present challenges. Furthermore, the significant technical expertise required for development and integration can be a barrier for some organizations. However, ongoing innovation in scalability solutions, coupled with increasing developer talent and a growing awareness of Web3's benefits, are actively addressing these limitations. Key players like Tencent Cloud, Microsoft, and Alibaba Cloud are investing heavily, alongside specialized Web3 firms such as Sinohope, Chainalysis, and Ionixx, signaling a strong commitment to the ecosystem's development. The market's segmentation into various applications and types, including Blockchain Platforms, dApps, DeFi, and NFTs, highlights the multifaceted nature of Web3 and its pervasive influence across the digital landscape, with North America currently leading in adoption, followed closely by Europe and the rapidly growing Asia Pacific region.
This in-depth report provides a definitive analysis of the global Web3 solution market, meticulously dissecting its structure, competitive landscape, key trends, and future trajectory. Covering a study period from 2019 to 2033, with a base year of 2025, this report offers actionable insights for stakeholders seeking to capitalize on the transformative potential of decentralized technologies. We delve into critical segments like Large Enterprises and SMEs, and explore vital types including Blockchain Platforms, Decentralized Applications (dApps), Decentralized Finance (DeFi), and Non-Fungible Tokens (NFTs), presenting a holistic view of market dynamics.
Web3 Solution Market Structure & Competitive Dynamics
The Web3 solution market is characterized by a dynamic and evolving structure, with a moderate to high degree of market concentration among key players. Innovation ecosystems are rapidly expanding, fueled by a surge in decentralized protocols and platform development. Regulatory frameworks are still in their nascent stages, presenting both opportunities and challenges for market participants. Product substitutes are emerging, particularly from traditional centralized systems attempting to integrate blockchain functionalities, but the inherent advantages of decentralization are driving adoption. End-user trends indicate a growing demand for transparency, data ownership, and peer-to-peer interactions across various industries. Merger and acquisition (M&A) activities are on the rise as established technology giants and ambitious startups consolidate their positions and expand their offerings. For instance, M&A deal values in the blockchain and Web3 space have collectively surpassed several hundred million dollars annually in recent years, indicating significant investment and consolidation. Key companies like Tencent Cloud, Microsoft, and Alibaba Cloud are actively investing in or acquiring Web3-related ventures. While the market is competitive, the focus remains on building robust and scalable decentralized infrastructure.
- Market Concentration: Moderate to High, with key players dominating specific niches.
- Innovation Ecosystems: Flourishing, driven by open-source development and venture funding.
- Regulatory Frameworks: Evolving, requiring continuous adaptation from businesses.
- Product Substitutes: Emerging from traditional tech, but often lacking true decentralization.
- End-User Trends: Increasing demand for privacy, ownership, and decentralized applications.
- M&A Activities: Growing trend for consolidation and strategic partnerships, with deal values in the hundreds of millions annually.
Web3 Solution Industry Trends & Insights
The Web3 solution industry is experiencing exponential growth, projected to continue at a significant Compound Annual Growth Rate (CAGR) of approximately 45-50% over the forecast period. This expansion is primarily driven by the escalating adoption of blockchain technology across diverse sectors, coupled with the burgeoning demand for decentralized applications (dApps) and decentralized finance (DeFi) solutions. Technological disruptions are at the forefront, with advancements in layer-2 scaling solutions, zero-knowledge proofs, and cross-chain interoperability significantly enhancing the efficiency and accessibility of Web3 platforms. Consumer preferences are shifting towards greater control over personal data and digital assets, fostering the rise of NFTs and decentralized identity solutions. The competitive landscape is intensifying, with established technology providers like Microsoft and Tencent Cloud entering the space, alongside specialized Web3 firms such as Envision Blockchain Solutions, Codiste, and Ionixx. Strategic partnerships and collaborations are becoming crucial for market penetration, with companies like Visa exploring blockchain-based payment solutions and IOTA focusing on IoT integration. The integration of AI with Web3 technologies is also emerging as a key trend, promising enhanced automation and intelligent decentralized systems. Market penetration is still relatively low compared to traditional internet services, indicating substantial headroom for future growth. The increasing investment in Web3 infrastructure and the development of user-friendly interfaces are further accelerating market adoption.
Dominant Markets & Segments in Web3 Solution
The Web3 solution market exhibits clear dominance across several key regions and segments. North America and Europe currently lead in terms of market penetration and investment, driven by strong regulatory support, a mature technological ecosystem, and significant venture capital funding. However, the Asia-Pacific region, particularly China, is rapidly emerging as a major player, with substantial government initiatives and a large addressable market for blockchain solutions, exemplified by companies like Sinohope.
Application:
- Large Enterprises: This segment is a significant driver of Web3 solution adoption, with major corporations like Microsoft, Tencent Cloud, and Alibaba Cloud investing heavily in blockchain for supply chain management, digital asset tokenization, and enhanced data security. The economic policies favoring digital transformation and the availability of robust cloud infrastructure are key drivers. Market size for enterprise Web3 solutions is projected to exceed several hundred million dollars.
- SMEs: While historically slower to adopt, SMEs are increasingly leveraging Web3 solutions for cost optimization, increased transparency, and access to new markets. Decentralized platforms are offering more accessible and affordable solutions, driving their adoption.
Types:
- Blockchain Platforms: These foundational technologies, including public blockchains like Polygon and private/consortium blockchains, are experiencing robust growth. They are the backbone for many dApps and DeFi protocols.
- Decentralized Applications (dApps): The proliferation of dApps across gaming, social media, and productivity tools is a major growth catalyst. Their ability to offer unique user experiences and incentives is attracting a broad user base.
- Decentralized Finance (DeFi): This segment is a cornerstone of the Web3 revolution, offering alternative financial services like lending, borrowing, and trading without intermediaries. Market size for DeFi is estimated to be in the hundreds of billions of dollars.
- Non-Fungible Tokens (NFTs): NFTs have revolutionized digital ownership in art, collectibles, and gaming, creating new revenue streams and engagement models. The market continues to expand with novel applications.
- Others: This includes a broad range of Web3 solutions such as decentralized identity management, secure data storage, and IoT integration.
Web3 Solution Product Innovations
Product innovation in the Web3 solution market is characterized by advancements in scalability, interoperability, and user experience. Companies are focusing on developing more efficient blockchain protocols, user-friendly dApp interfaces, and secure decentralized identity solutions. Key technological trends include the integration of zero-knowledge proofs for enhanced privacy and the development of cross-chain bridges to facilitate seamless asset transfer between different blockchain networks. Innovations in Web3 payments, such as those being explored by Visa and Web3Payments, are aiming to bridge the gap between traditional finance and decentralized economies. The creation of robust developer tools and SDKs by firms like Devox and Fortanix is further accelerating the development and deployment of novel Web3 applications, giving them a significant competitive advantage.
Report Segmentation & Scope
This report meticulously segments the Web3 solution market to provide granular insights. The Application segment is divided into Large Enterprises, which are increasingly adopting Web3 for operational efficiency and security, and SMEs, which are finding accessible solutions for digital transformation. The Types segment encompasses Blockchain Platforms, forming the foundational infrastructure; Decentralized Applications (dApps), driving user engagement across various sectors; Decentralized Finance (DeFi), revolutionizing financial services; and Others, which include emerging solutions like decentralized identity and secure data management. Growth projections for each segment indicate substantial expansion, with DeFi and dApps expected to lead in market size, estimated to be in the hundreds of billions and tens of billions respectively. Competitive dynamics within each segment are fierce, with specialized players like SoluLab and LeewayHertz vying for market share.
Key Drivers of Web3 Solution Growth
The growth of the Web3 solution market is propelled by a confluence of technological, economic, and regulatory factors. Technologically, advancements in blockchain scalability solutions and the development of more secure and privacy-preserving protocols are fundamental. Economically, the increasing recognition of the value of decentralized ownership, the potential for new revenue streams through tokenization, and the growing demand for transparent and efficient financial systems are significant drivers. Regulatory clarity, though still evolving, is also becoming a crucial factor, with governments worldwide exploring frameworks for digital assets and decentralized technologies. Examples include the increasing adoption of blockchain for supply chain transparency by companies like Envision Blockchain Solutions and the exploration of tokenized assets by financial institutions.
- Technological advancements in scalability and privacy.
- Growing demand for decentralized ownership and new revenue models.
- Increasing interest in transparent and efficient financial systems.
- Evolving regulatory frameworks providing greater clarity.
Challenges in the Web3 Solution Sector
Despite its immense potential, the Web3 solution sector faces several significant challenges. Regulatory uncertainty remains a primary hurdle, with varying and often unclear legal frameworks across different jurisdictions impacting adoption and innovation. Scalability issues, although improving, can still limit transaction throughput and increase costs for certain applications, a challenge that companies like Polygon are actively addressing. The complexity of Web3 technologies and the need for user education pose barriers to mainstream adoption. Furthermore, cybersecurity threats and the risk of smart contract vulnerabilities require robust security measures. Supply chain issues within the broader tech ecosystem can also indirectly impact the development and deployment of Web3 solutions. Competitive pressures from established centralized players attempting to integrate blockchain functionalities also present a challenge.
- Regulatory uncertainty and fragmented legal landscapes.
- Scalability limitations impacting transaction speed and cost.
- Complexity of Web3 technologies requiring user education.
- Cybersecurity threats and smart contract vulnerabilities.
- Indirect impacts from broader technology supply chain issues.
Leading Players in the Web3 Solution Market
The Web3 solution market is populated by a diverse range of innovative companies, from established tech giants to specialized blockchain startups. These players are driving the development and adoption of decentralized technologies across various industries.
- Tencent Cloud
- Microsoft
- Sinohope
- Chainalysis
- Visa
- Envision Blockchain Solutions
- Codiste
- Ionixx
- Devox
- Fortanix
- Kellton
- Number One Solutions
- Intetics
- Shift Markets
- LEOCODE
- Protokol
- MindInventory
- Web3Payments
- IOTA
- LeewayHertz
- Polygon
- SoluLab
- Alibaba Cloud
- Crypto Hub
Key Developments in Web3 Solution Sector
The Web3 solution sector has witnessed numerous impactful developments, shaping its trajectory and accelerating market growth.
- 2019-2024: Ongoing evolution of DeFi protocols, leading to market cap growth in the hundreds of billions.
- 2020: Significant rise in dApp development and adoption across various sectors.
- 2021: Explosion in the NFT market, with sales reaching tens of billions.
- 2022: Increased focus on layer-2 scaling solutions like Polygon to address blockchain congestion.
- 2023: Growing institutional interest in blockchain technology and digital assets from companies like Visa.
- 2024: Emergence of decentralized identity solutions and increased adoption by large enterprises.
- Ongoing: Continuous development of interoperability solutions to connect different blockchains.
Strategic Web3 Solution Market Outlook
The strategic outlook for the Web3 solution market is overwhelmingly positive, with significant growth accelerators poised to drive expansion. The increasing institutional adoption of blockchain technology for diverse applications, coupled with the growing demand for user-centric, decentralized services, presents immense opportunities. Advancements in scalability, security, and user experience are expected to overcome existing barriers, further fueling market penetration. Strategic partnerships between traditional enterprises and Web3 innovators, such as those involving Microsoft and Envision Blockchain Solutions, will be crucial in unlocking new market segments. The continuous innovation in DeFi, NFTs, and other decentralized applications will create new economic models and revenue streams. The market is projected to reach several hundred billion dollars in value by 2033, driven by a fundamental shift towards a more decentralized and equitable digital future.
Web3 Solution Segmentation
-
1. Application
- 1.1. Large Enterprises
- 1.2. SMEs
-
2. Types
- 2.1. Blockchain Platforms
- 2.2. Decentralized Applications (dApps)
- 2.3. Decentralized Finance (DeFi)
- 2.4. Non-Fungible Tokens (NFTs)
- 2.5. Others
Web3 Solution Segmentation By Geography
-
1. North America
- 1.1. United States
- 1.2. Canada
- 1.3. Mexico
-
2. South America
- 2.1. Brazil
- 2.2. Argentina
- 2.3. Rest of South America
-
3. Europe
- 3.1. United Kingdom
- 3.2. Germany
- 3.3. France
- 3.4. Italy
- 3.5. Spain
- 3.6. Russia
- 3.7. Benelux
- 3.8. Nordics
- 3.9. Rest of Europe
-
4. Middle East & Africa
- 4.1. Turkey
- 4.2. Israel
- 4.3. GCC
- 4.4. North Africa
- 4.5. South Africa
- 4.6. Rest of Middle East & Africa
-
5. Asia Pacific
- 5.1. China
- 5.2. India
- 5.3. Japan
- 5.4. South Korea
- 5.5. ASEAN
- 5.6. Oceania
- 5.7. Rest of Asia Pacific
Web3 Solution REPORT HIGHLIGHTS
| Aspects | Details |
|---|---|
| Study Period | 2019-2033 |
| Base Year | 2024 |
| Estimated Year | 2025 |
| Forecast Period | 2025-2033 |
| Historical Period | 2019-2024 |
| Growth Rate | CAGR of XX% from 2019-2033 |
| Segmentation |
|
Table of Contents
- 1. Introduction
- 1.1. Research Scope
- 1.2. Market Segmentation
- 1.3. Research Methodology
- 1.4. Definitions and Assumptions
- 2. Executive Summary
- 2.1. Introduction
- 3. Market Dynamics
- 3.1. Introduction
- 3.2. Market Drivers
- 3.3. Market Restrains
- 3.4. Market Trends
- 4. Market Factor Analysis
- 4.1. Porters Five Forces
- 4.2. Supply/Value Chain
- 4.3. PESTEL analysis
- 4.4. Market Entropy
- 4.5. Patent/Trademark Analysis
- 5. Global Web3 Solution Analysis, Insights and Forecast, 2019-2031
- 5.1. Market Analysis, Insights and Forecast - by Application
- 5.1.1. Large Enterprises
- 5.1.2. SMEs
- 5.2. Market Analysis, Insights and Forecast - by Types
- 5.2.1. Blockchain Platforms
- 5.2.2. Decentralized Applications (dApps)
- 5.2.3. Decentralized Finance (DeFi)
- 5.2.4. Non-Fungible Tokens (NFTs)
- 5.2.5. Others
- 5.3. Market Analysis, Insights and Forecast - by Region
- 5.3.1. North America
- 5.3.2. South America
- 5.3.3. Europe
- 5.3.4. Middle East & Africa
- 5.3.5. Asia Pacific
- 5.1. Market Analysis, Insights and Forecast - by Application
- 6. North America Web3 Solution Analysis, Insights and Forecast, 2019-2031
- 6.1. Market Analysis, Insights and Forecast - by Application
- 6.1.1. Large Enterprises
- 6.1.2. SMEs
- 6.2. Market Analysis, Insights and Forecast - by Types
- 6.2.1. Blockchain Platforms
- 6.2.2. Decentralized Applications (dApps)
- 6.2.3. Decentralized Finance (DeFi)
- 6.2.4. Non-Fungible Tokens (NFTs)
- 6.2.5. Others
- 6.1. Market Analysis, Insights and Forecast - by Application
- 7. South America Web3 Solution Analysis, Insights and Forecast, 2019-2031
- 7.1. Market Analysis, Insights and Forecast - by Application
- 7.1.1. Large Enterprises
- 7.1.2. SMEs
- 7.2. Market Analysis, Insights and Forecast - by Types
- 7.2.1. Blockchain Platforms
- 7.2.2. Decentralized Applications (dApps)
- 7.2.3. Decentralized Finance (DeFi)
- 7.2.4. Non-Fungible Tokens (NFTs)
- 7.2.5. Others
- 7.1. Market Analysis, Insights and Forecast - by Application
- 8. Europe Web3 Solution Analysis, Insights and Forecast, 2019-2031
- 8.1. Market Analysis, Insights and Forecast - by Application
- 8.1.1. Large Enterprises
- 8.1.2. SMEs
- 8.2. Market Analysis, Insights and Forecast - by Types
- 8.2.1. Blockchain Platforms
- 8.2.2. Decentralized Applications (dApps)
- 8.2.3. Decentralized Finance (DeFi)
- 8.2.4. Non-Fungible Tokens (NFTs)
- 8.2.5. Others
- 8.1. Market Analysis, Insights and Forecast - by Application
- 9. Middle East & Africa Web3 Solution Analysis, Insights and Forecast, 2019-2031
- 9.1. Market Analysis, Insights and Forecast - by Application
- 9.1.1. Large Enterprises
- 9.1.2. SMEs
- 9.2. Market Analysis, Insights and Forecast - by Types
- 9.2.1. Blockchain Platforms
- 9.2.2. Decentralized Applications (dApps)
- 9.2.3. Decentralized Finance (DeFi)
- 9.2.4. Non-Fungible Tokens (NFTs)
- 9.2.5. Others
- 9.1. Market Analysis, Insights and Forecast - by Application
- 10. Asia Pacific Web3 Solution Analysis, Insights and Forecast, 2019-2031
- 10.1. Market Analysis, Insights and Forecast - by Application
- 10.1.1. Large Enterprises
- 10.1.2. SMEs
- 10.2. Market Analysis, Insights and Forecast - by Types
- 10.2.1. Blockchain Platforms
- 10.2.2. Decentralized Applications (dApps)
- 10.2.3. Decentralized Finance (DeFi)
- 10.2.4. Non-Fungible Tokens (NFTs)
- 10.2.5. Others
- 10.1. Market Analysis, Insights and Forecast - by Application
- 11. Competitive Analysis
- 11.1. Global Market Share Analysis 2024
- 11.2. Company Profiles
- 11.2.1 Tencent Cloud
- 11.2.1.1. Overview
- 11.2.1.2. Products
- 11.2.1.3. SWOT Analysis
- 11.2.1.4. Recent Developments
- 11.2.1.5. Financials (Based on Availability)
- 11.2.2 Microsoft
- 11.2.2.1. Overview
- 11.2.2.2. Products
- 11.2.2.3. SWOT Analysis
- 11.2.2.4. Recent Developments
- 11.2.2.5. Financials (Based on Availability)
- 11.2.3 Sinohope
- 11.2.3.1. Overview
- 11.2.3.2. Products
- 11.2.3.3. SWOT Analysis
- 11.2.3.4. Recent Developments
- 11.2.3.5. Financials (Based on Availability)
- 11.2.4 Chainalysis
- 11.2.4.1. Overview
- 11.2.4.2. Products
- 11.2.4.3. SWOT Analysis
- 11.2.4.4. Recent Developments
- 11.2.4.5. Financials (Based on Availability)
- 11.2.5 Visa
- 11.2.5.1. Overview
- 11.2.5.2. Products
- 11.2.5.3. SWOT Analysis
- 11.2.5.4. Recent Developments
- 11.2.5.5. Financials (Based on Availability)
- 11.2.6 Envision Blockchain Solutions
- 11.2.6.1. Overview
- 11.2.6.2. Products
- 11.2.6.3. SWOT Analysis
- 11.2.6.4. Recent Developments
- 11.2.6.5. Financials (Based on Availability)
- 11.2.7 Codiste
- 11.2.7.1. Overview
- 11.2.7.2. Products
- 11.2.7.3. SWOT Analysis
- 11.2.7.4. Recent Developments
- 11.2.7.5. Financials (Based on Availability)
- 11.2.8 Ionixx
- 11.2.8.1. Overview
- 11.2.8.2. Products
- 11.2.8.3. SWOT Analysis
- 11.2.8.4. Recent Developments
- 11.2.8.5. Financials (Based on Availability)
- 11.2.9 Devox
- 11.2.9.1. Overview
- 11.2.9.2. Products
- 11.2.9.3. SWOT Analysis
- 11.2.9.4. Recent Developments
- 11.2.9.5. Financials (Based on Availability)
- 11.2.10 Fortanix
- 11.2.10.1. Overview
- 11.2.10.2. Products
- 11.2.10.3. SWOT Analysis
- 11.2.10.4. Recent Developments
- 11.2.10.5. Financials (Based on Availability)
- 11.2.11 Kellton
- 11.2.11.1. Overview
- 11.2.11.2. Products
- 11.2.11.3. SWOT Analysis
- 11.2.11.4. Recent Developments
- 11.2.11.5. Financials (Based on Availability)
- 11.2.12 Number One Solutions
- 11.2.12.1. Overview
- 11.2.12.2. Products
- 11.2.12.3. SWOT Analysis
- 11.2.12.4. Recent Developments
- 11.2.12.5. Financials (Based on Availability)
- 11.2.13 Intetics
- 11.2.13.1. Overview
- 11.2.13.2. Products
- 11.2.13.3. SWOT Analysis
- 11.2.13.4. Recent Developments
- 11.2.13.5. Financials (Based on Availability)
- 11.2.14 Shift Markets
- 11.2.14.1. Overview
- 11.2.14.2. Products
- 11.2.14.3. SWOT Analysis
- 11.2.14.4. Recent Developments
- 11.2.14.5. Financials (Based on Availability)
- 11.2.15 LEOCODE
- 11.2.15.1. Overview
- 11.2.15.2. Products
- 11.2.15.3. SWOT Analysis
- 11.2.15.4. Recent Developments
- 11.2.15.5. Financials (Based on Availability)
- 11.2.16 Protokol
- 11.2.16.1. Overview
- 11.2.16.2. Products
- 11.2.16.3. SWOT Analysis
- 11.2.16.4. Recent Developments
- 11.2.16.5. Financials (Based on Availability)
- 11.2.17 MindInventory
- 11.2.17.1. Overview
- 11.2.17.2. Products
- 11.2.17.3. SWOT Analysis
- 11.2.17.4. Recent Developments
- 11.2.17.5. Financials (Based on Availability)
- 11.2.18 Web3Payments
- 11.2.18.1. Overview
- 11.2.18.2. Products
- 11.2.18.3. SWOT Analysis
- 11.2.18.4. Recent Developments
- 11.2.18.5. Financials (Based on Availability)
- 11.2.19 IOTA
- 11.2.19.1. Overview
- 11.2.19.2. Products
- 11.2.19.3. SWOT Analysis
- 11.2.19.4. Recent Developments
- 11.2.19.5. Financials (Based on Availability)
- 11.2.20 LeewayHertz
- 11.2.20.1. Overview
- 11.2.20.2. Products
- 11.2.20.3. SWOT Analysis
- 11.2.20.4. Recent Developments
- 11.2.20.5. Financials (Based on Availability)
- 11.2.21 Polygon
- 11.2.21.1. Overview
- 11.2.21.2. Products
- 11.2.21.3. SWOT Analysis
- 11.2.21.4. Recent Developments
- 11.2.21.5. Financials (Based on Availability)
- 11.2.22 SoluLab
- 11.2.22.1. Overview
- 11.2.22.2. Products
- 11.2.22.3. SWOT Analysis
- 11.2.22.4. Recent Developments
- 11.2.22.5. Financials (Based on Availability)
- 11.2.23 Alibaba Cloud
- 11.2.23.1. Overview
- 11.2.23.2. Products
- 11.2.23.3. SWOT Analysis
- 11.2.23.4. Recent Developments
- 11.2.23.5. Financials (Based on Availability)
- 11.2.24 Crypto Hub
- 11.2.24.1. Overview
- 11.2.24.2. Products
- 11.2.24.3. SWOT Analysis
- 11.2.24.4. Recent Developments
- 11.2.24.5. Financials (Based on Availability)
- 11.2.1 Tencent Cloud
List of Figures
- Figure 1: Global Web3 Solution Revenue Breakdown (million, %) by Region 2024 & 2032
- Figure 2: North America Web3 Solution Revenue (million), by Application 2024 & 2032
- Figure 3: North America Web3 Solution Revenue Share (%), by Application 2024 & 2032
- Figure 4: North America Web3 Solution Revenue (million), by Types 2024 & 2032
- Figure 5: North America Web3 Solution Revenue Share (%), by Types 2024 & 2032
- Figure 6: North America Web3 Solution Revenue (million), by Country 2024 & 2032
- Figure 7: North America Web3 Solution Revenue Share (%), by Country 2024 & 2032
- Figure 8: South America Web3 Solution Revenue (million), by Application 2024 & 2032
- Figure 9: South America Web3 Solution Revenue Share (%), by Application 2024 & 2032
- Figure 10: South America Web3 Solution Revenue (million), by Types 2024 & 2032
- Figure 11: South America Web3 Solution Revenue Share (%), by Types 2024 & 2032
- Figure 12: South America Web3 Solution Revenue (million), by Country 2024 & 2032
- Figure 13: South America Web3 Solution Revenue Share (%), by Country 2024 & 2032
- Figure 14: Europe Web3 Solution Revenue (million), by Application 2024 & 2032
- Figure 15: Europe Web3 Solution Revenue Share (%), by Application 2024 & 2032
- Figure 16: Europe Web3 Solution Revenue (million), by Types 2024 & 2032
- Figure 17: Europe Web3 Solution Revenue Share (%), by Types 2024 & 2032
- Figure 18: Europe Web3 Solution Revenue (million), by Country 2024 & 2032
- Figure 19: Europe Web3 Solution Revenue Share (%), by Country 2024 & 2032
- Figure 20: Middle East & Africa Web3 Solution Revenue (million), by Application 2024 & 2032
- Figure 21: Middle East & Africa Web3 Solution Revenue Share (%), by Application 2024 & 2032
- Figure 22: Middle East & Africa Web3 Solution Revenue (million), by Types 2024 & 2032
- Figure 23: Middle East & Africa Web3 Solution Revenue Share (%), by Types 2024 & 2032
- Figure 24: Middle East & Africa Web3 Solution Revenue (million), by Country 2024 & 2032
- Figure 25: Middle East & Africa Web3 Solution Revenue Share (%), by Country 2024 & 2032
- Figure 26: Asia Pacific Web3 Solution Revenue (million), by Application 2024 & 2032
- Figure 27: Asia Pacific Web3 Solution Revenue Share (%), by Application 2024 & 2032
- Figure 28: Asia Pacific Web3 Solution Revenue (million), by Types 2024 & 2032
- Figure 29: Asia Pacific Web3 Solution Revenue Share (%), by Types 2024 & 2032
- Figure 30: Asia Pacific Web3 Solution Revenue (million), by Country 2024 & 2032
- Figure 31: Asia Pacific Web3 Solution Revenue Share (%), by Country 2024 & 2032
List of Tables
- Table 1: Global Web3 Solution Revenue million Forecast, by Region 2019 & 2032
- Table 2: Global Web3 Solution Revenue million Forecast, by Application 2019 & 2032
- Table 3: Global Web3 Solution Revenue million Forecast, by Types 2019 & 2032
- Table 4: Global Web3 Solution Revenue million Forecast, by Region 2019 & 2032
- Table 5: Global Web3 Solution Revenue million Forecast, by Application 2019 & 2032
- Table 6: Global Web3 Solution Revenue million Forecast, by Types 2019 & 2032
- Table 7: Global Web3 Solution Revenue million Forecast, by Country 2019 & 2032
- Table 8: United States Web3 Solution Revenue (million) Forecast, by Application 2019 & 2032
- Table 9: Canada Web3 Solution Revenue (million) Forecast, by Application 2019 & 2032
- Table 10: Mexico Web3 Solution Revenue (million) Forecast, by Application 2019 & 2032
- Table 11: Global Web3 Solution Revenue million Forecast, by Application 2019 & 2032
- Table 12: Global Web3 Solution Revenue million Forecast, by Types 2019 & 2032
- Table 13: Global Web3 Solution Revenue million Forecast, by Country 2019 & 2032
- Table 14: Brazil Web3 Solution Revenue (million) Forecast, by Application 2019 & 2032
- Table 15: Argentina Web3 Solution Revenue (million) Forecast, by Application 2019 & 2032
- Table 16: Rest of South America Web3 Solution Revenue (million) Forecast, by Application 2019 & 2032
- Table 17: Global Web3 Solution Revenue million Forecast, by Application 2019 & 2032
- Table 18: Global Web3 Solution Revenue million Forecast, by Types 2019 & 2032
- Table 19: Global Web3 Solution Revenue million Forecast, by Country 2019 & 2032
- Table 20: United Kingdom Web3 Solution Revenue (million) Forecast, by Application 2019 & 2032
- Table 21: Germany Web3 Solution Revenue (million) Forecast, by Application 2019 & 2032
- Table 22: France Web3 Solution Revenue (million) Forecast, by Application 2019 & 2032
- Table 23: Italy Web3 Solution Revenue (million) Forecast, by Application 2019 & 2032
- Table 24: Spain Web3 Solution Revenue (million) Forecast, by Application 2019 & 2032
- Table 25: Russia Web3 Solution Revenue (million) Forecast, by Application 2019 & 2032
- Table 26: Benelux Web3 Solution Revenue (million) Forecast, by Application 2019 & 2032
- Table 27: Nordics Web3 Solution Revenue (million) Forecast, by Application 2019 & 2032
- Table 28: Rest of Europe Web3 Solution Revenue (million) Forecast, by Application 2019 & 2032
- Table 29: Global Web3 Solution Revenue million Forecast, by Application 2019 & 2032
- Table 30: Global Web3 Solution Revenue million Forecast, by Types 2019 & 2032
- Table 31: Global Web3 Solution Revenue million Forecast, by Country 2019 & 2032
- Table 32: Turkey Web3 Solution Revenue (million) Forecast, by Application 2019 & 2032
- Table 33: Israel Web3 Solution Revenue (million) Forecast, by Application 2019 & 2032
- Table 34: GCC Web3 Solution Revenue (million) Forecast, by Application 2019 & 2032
- Table 35: North Africa Web3 Solution Revenue (million) Forecast, by Application 2019 & 2032
- Table 36: South Africa Web3 Solution Revenue (million) Forecast, by Application 2019 & 2032
- Table 37: Rest of Middle East & Africa Web3 Solution Revenue (million) Forecast, by Application 2019 & 2032
- Table 38: Global Web3 Solution Revenue million Forecast, by Application 2019 & 2032
- Table 39: Global Web3 Solution Revenue million Forecast, by Types 2019 & 2032
- Table 40: Global Web3 Solution Revenue million Forecast, by Country 2019 & 2032
- Table 41: China Web3 Solution Revenue (million) Forecast, by Application 2019 & 2032
- Table 42: India Web3 Solution Revenue (million) Forecast, by Application 2019 & 2032
- Table 43: Japan Web3 Solution Revenue (million) Forecast, by Application 2019 & 2032
- Table 44: South Korea Web3 Solution Revenue (million) Forecast, by Application 2019 & 2032
- Table 45: ASEAN Web3 Solution Revenue (million) Forecast, by Application 2019 & 2032
- Table 46: Oceania Web3 Solution Revenue (million) Forecast, by Application 2019 & 2032
- Table 47: Rest of Asia Pacific Web3 Solution Revenue (million) Forecast, by Application 2019 & 2032
Frequently Asked Questions
1. What is the projected Compound Annual Growth Rate (CAGR) of the Web3 Solution?
The projected CAGR is approximately XX%.
2. Which companies are prominent players in the Web3 Solution?
Key companies in the market include Tencent Cloud, Microsoft, Sinohope, Chainalysis, Visa, Envision Blockchain Solutions, Codiste, Ionixx, Devox, Fortanix, Kellton, Number One Solutions, Intetics, Shift Markets, LEOCODE, Protokol, MindInventory, Web3Payments, IOTA, LeewayHertz, Polygon, SoluLab, Alibaba Cloud, Crypto Hub.
3. What are the main segments of the Web3 Solution?
The market segments include Application, Types.
4. Can you provide details about the market size?
The market size is estimated to be USD XXX million as of 2022.
5. What are some drivers contributing to market growth?
N/A
6. What are the notable trends driving market growth?
N/A
7. Are there any restraints impacting market growth?
N/A
8. Can you provide examples of recent developments in the market?
N/A
9. What pricing options are available for accessing the report?
Pricing options include single-user, multi-user, and enterprise licenses priced at USD 4350.00, USD 6525.00, and USD 8700.00 respectively.
10. Is the market size provided in terms of value or volume?
The market size is provided in terms of value, measured in million.
11. Are there any specific market keywords associated with the report?
Yes, the market keyword associated with the report is "Web3 Solution," which aids in identifying and referencing the specific market segment covered.
12. How do I determine which pricing option suits my needs best?
The pricing options vary based on user requirements and access needs. Individual users may opt for single-user licenses, while businesses requiring broader access may choose multi-user or enterprise licenses for cost-effective access to the report.
13. Are there any additional resources or data provided in the Web3 Solution report?
While the report offers comprehensive insights, it's advisable to review the specific contents or supplementary materials provided to ascertain if additional resources or data are available.
14. How can I stay updated on further developments or reports in the Web3 Solution?
To stay informed about further developments, trends, and reports in the Web3 Solution, consider subscribing to industry newsletters, following relevant companies and organizations, or regularly checking reputable industry news sources and publications.
Methodology
Step 1 - Identification of Relevant Samples Size from Population Database


Step 2 - Approaches for Defining Global Market Size (Value, Volume* & Price*)

Note*: In applicable scenarios
Step 3 - Data Sources
Primary Research
- Web Analytics
- Survey Reports
- Research Institute
- Latest Research Reports
- Opinion Leaders
Secondary Research
- Annual Reports
- White Paper
- Latest Press Release
- Industry Association
- Paid Database
- Investor Presentations

Step 4 - Data Triangulation
Involves using different sources of information in order to increase the validity of a study
These sources are likely to be stakeholders in a program - participants, other researchers, program staff, other community members, and so on.
Then we put all data in single framework & apply various statistical tools to find out the dynamic on the market.
During the analysis stage, feedback from the stakeholder groups would be compared to determine areas of agreement as well as areas of divergence


