
Key Insights
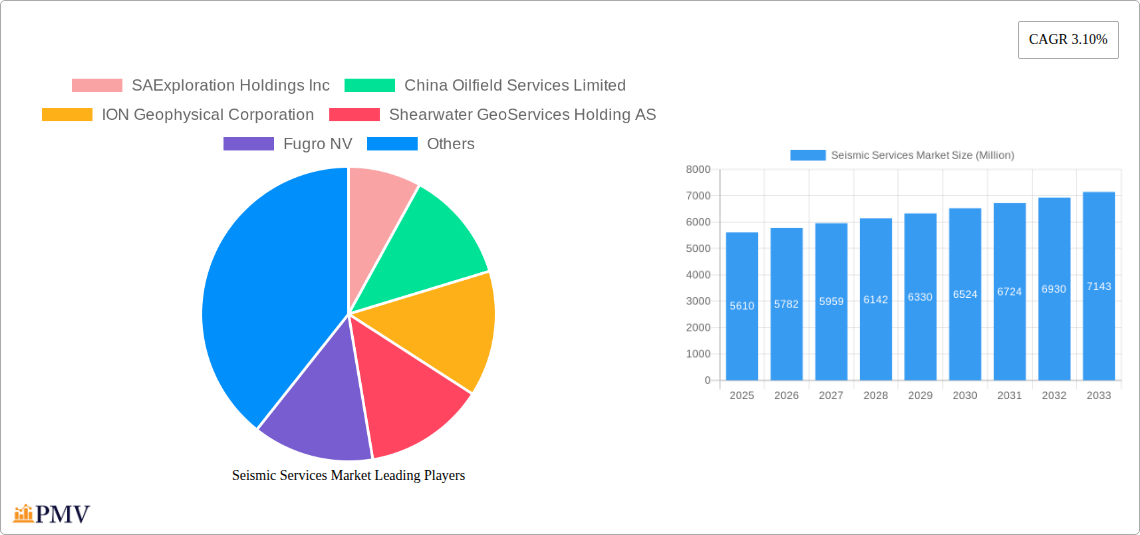
The global Seismic Services market, valued at $5.61 billion in 2025, is projected to experience steady growth, driven by increasing exploration and production activities in the oil and gas industry, particularly in offshore regions. The market's Compound Annual Growth Rate (CAGR) of 3.10% from 2025 to 2033 indicates a consistent, albeit moderate, expansion. Key growth drivers include the rising demand for high-resolution seismic data for improved reservoir characterization and enhanced oil recovery techniques. Technological advancements, such as the adoption of 3D and 4D seismic imaging, are further boosting market growth by providing more accurate and detailed subsurface information. The market segmentation reveals a significant contribution from both onshore and offshore deployment, with offshore likely holding a larger market share due to the growing focus on deepwater exploration. The service segment is further divided into data acquisition, data processing, and interpretation, with data processing and interpretation likely witnessing higher growth due to increasing complexities in data analysis and the need for advanced interpretation techniques. Competitive rivalry is intense, with numerous established players and emerging companies vying for market share. However, potential restraints include fluctuating oil prices, stringent environmental regulations, and the inherent risks associated with offshore operations. The regional distribution of the market is likely skewed towards North America and the Asia-Pacific region, given their significant oil and gas reserves and exploration activities.
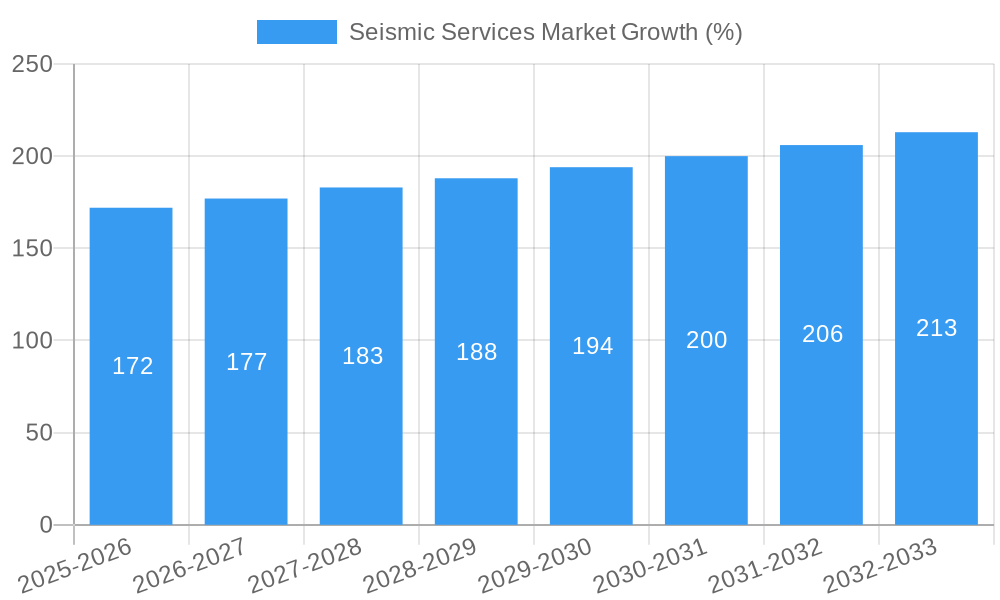
The forecast period (2025-2033) anticipates continued market expansion, primarily fueled by sustained investment in exploration and production, particularly in regions with untapped hydrocarbon reserves. However, the growth rate might be subject to variations based on global energy demand, geopolitical factors, and technological disruptions. Companies within the seismic services industry are focusing on innovation and diversification of services to maintain a competitive edge, while also adapting to evolving industry practices and regulatory frameworks. The ongoing digital transformation within the sector, including the use of AI and machine learning for data analysis, represents a key factor shaping future market dynamics. This trend promises to improve efficiency, reduce costs, and enhance the accuracy of seismic interpretation. Nonetheless, the market's trajectory remains dependent on the global energy landscape and the continued demand for fossil fuels.
Seismic Services Market: A Comprehensive Report (2019-2033)
This in-depth report provides a comprehensive analysis of the Seismic Services Market, covering the period from 2019 to 2033. With a focus on key market segments, competitive dynamics, and future growth projections, this report is an essential resource for industry professionals, investors, and strategic decision-makers. The report utilizes data from the historical period (2019-2024), the base year (2025), and the estimated year (2025) to forecast market trends through 2033. The market is valued at xx Million in 2025 and is projected to reach xx Million by 2033, exhibiting a CAGR of xx%.
Seismic Services Market Market Structure & Competitive Dynamics
The global seismic services market is characterized by a moderately concentrated structure, with a few major players holding significant market share. The market exhibits a dynamic interplay of established companies and emerging players, constantly innovating to improve data acquisition, processing, and interpretation techniques. Regulatory frameworks, particularly concerning environmental impact assessments and safety regulations, significantly influence market operations. Product substitutes, such as alternative subsurface imaging technologies, are constantly developing and challenging the market’s dominance. End-user trends, driven primarily by the oil and gas industry's exploration and production activities, are a primary driver of market growth. Mergers and acquisitions (M&A) are frequent, reflecting the competitive landscape and the pursuit of technological advancements and geographical expansion.
- Market Concentration: The top five companies hold approximately xx% of the global market share in 2025.
- Innovation Ecosystems: Collaboration between service providers and technology companies is driving innovation in areas like AI and machine learning for seismic data analysis.
- M&A Activity: Significant M&A activity in recent years, with deal values exceeding xx Million in aggregate, highlights consolidation and market expansion strategies. Examples include [Specific examples of M&A activity with deal values if available].
- Regulatory Frameworks: Stringent environmental regulations and safety standards impact operational costs and timelines.
Seismic Services Market Industry Trends & Insights
The seismic services market is experiencing robust growth fueled by increasing exploration and production activities in both onshore and offshore environments. Technological advancements, such as the use of advanced sensors and data processing techniques, are improving the accuracy and efficiency of seismic surveys. This trend, coupled with the growing demand for higher-resolution data for improved reservoir characterization, is driving market expansion. Consumer preferences are shifting towards integrated solutions that combine data acquisition, processing, and interpretation, streamlining workflows and reducing costs. Competitive dynamics are shaped by ongoing technological innovations, cost optimization strategies, and the expansion into new geographical areas. The market exhibits a strong correlation between oil and gas prices and exploration spending which directly impact growth.
Dominant Markets & Segments in Seismic Services Market
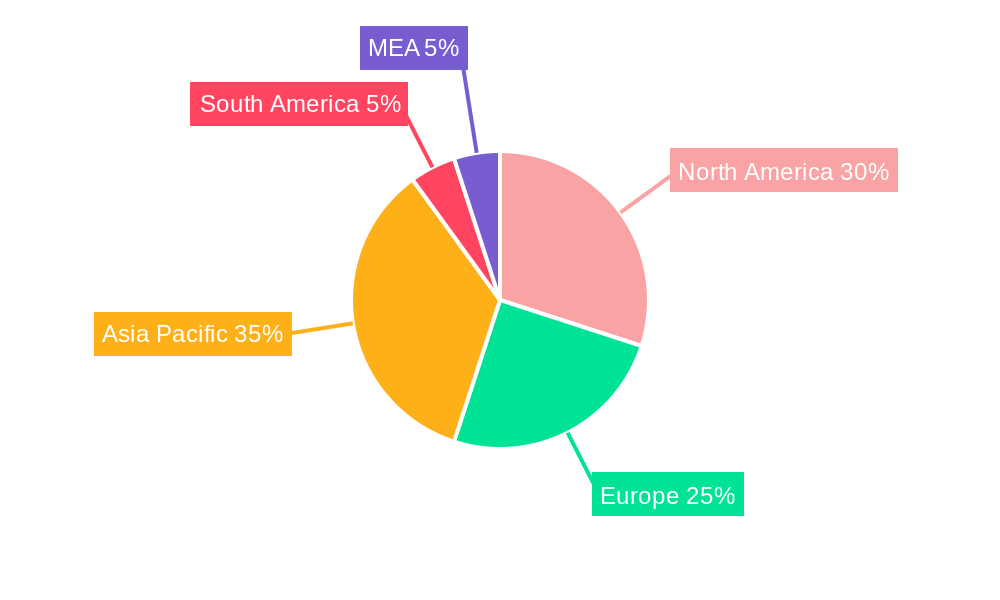
The offshore segment currently dominates the seismic services market, driven by the exploration of deeper water reserves and the increasing demand for high-quality seismic data in challenging environments. The Asia-Pacific region, particularly areas like Southeast Asia and the Middle East, are experiencing significant growth due to substantial exploration and production investments. The data acquisition segment holds the largest market share in terms of revenue, while data processing and interpretation are witnessing increasing demand for sophisticated analytical capabilities.
- Key Drivers in Offshore Seismic Services:
- Growing demand for deepwater exploration.
- Technological advancements in offshore seismic acquisition and processing.
- High oil and gas prices.
- Key Drivers in the Asia-Pacific Region:
- Significant investments in oil and gas exploration.
- Favorable government policies supporting energy development.
- Discovery of new reserves, e.g., the ADNOC gas discovery in the UAE.
- Data Acquisition Segment Dominance:
- Higher upfront investment for acquiring raw seismic data.
- Need for specialized vessels and equipment.
Seismic Services Market Product Innovations
Recent product innovations include the integration of artificial intelligence (AI) and machine learning (ML) algorithms for faster and more accurate seismic data processing and interpretation. Furthermore, advancements in sensor technology are improving the resolution and quality of seismic data acquired, allowing for better subsurface imaging. These technological advances are enabling better reservoir characterization, leading to more efficient and effective exploration and production strategies, improving the market fit and competitive advantage of leading companies.
Report Segmentation & Scope
The report segments the seismic services market based on service type (Data Acquisition, Data Processing and Interpretation) and location of deployment (Onshore, Offshore). Each segment is analyzed based on market size, growth projections, and competitive dynamics. The forecast period is from 2025 to 2033.
- Data Acquisition: This segment is expected to witness substantial growth owing to the increasing exploration activities globally, projected at xx Million in 2025 and reaching xx Million by 2033.
- Data Processing and Interpretation: This segment is experiencing growth due to increasing demand for advanced data analytics capabilities, projected at xx Million in 2025 and reaching xx Million by 2033.
- Onshore: The onshore segment shows steady growth projections driven by exploration in various regions, projected at xx Million in 2025 and reaching xx Million by 2033.
- Offshore: This segment commands a larger market share, with significant growth fueled by deepwater exploration, projected at xx Million in 2025 and reaching xx Million by 2033.
Key Drivers of Seismic Services Market Growth
The seismic services market is primarily driven by the ongoing demand for energy resources, necessitating extensive exploration and production activities. Technological advancements in seismic data acquisition, processing, and interpretation techniques significantly enhance the efficiency and accuracy of subsurface imaging, driving market growth. Furthermore, government policies and regulations regarding energy exploration and environmental protection play a role in shaping market dynamics. The rising adoption of advanced technologies, such as AI and ML, further propels the market's expansion.
Challenges in the Seismic Services Market Sector
The seismic services market faces challenges such as fluctuating oil and gas prices, impacting exploration budgets and investment decisions. Supply chain disruptions, particularly related to specialized equipment and skilled labor, can affect project timelines and costs. Intense competition among established and emerging players adds pressure on pricing and profitability. Stringent environmental regulations and safety standards increase operational complexities and expenses, further challenging market participants. These factors can cause year-on-year variations in market growth.
Leading Players in the Seismic Services Market Market
- SAExploration Holdings Inc
- China Oilfield Services Limited
- ION Geophysical Corporation
- Shearwater GeoServices Holding AS
- Fugro NV
- Schlumberger NV
- CGG SA
- Briscoe Group Limited
- Halliburton Company
- SeaBird Exploration PLC
- Magseis Fairfield ASA (WGP Group Ltd)
- TGS ASA
- Polarcus Ltd
- PGS ASA
Key Developments in Seismic Services Market Sector
- May 2023: TGS, in partnership with PGS and Schlumberger, secured pre-funding for a 6,885 square kilometer multi-client 3D seismic survey offshore Malaysia. This highlights the collaborative nature of large-scale projects and the ongoing demand for high-quality seismic data.
- February 2022: ADNOC's discovery of significant gas reserves in offshore Abu Dhabi underscores the importance of seismic surveys in identifying new hydrocarbon resources and driving further exploration activity.
- January 2022: Shearwater GeoServices secured contracts for two multicomponent surveys in offshore Western Australia, demonstrating the continuing demand for seismic services in specific geographical regions.
Strategic Seismic Services Market Market Outlook
The seismic services market is poised for continued growth, driven by sustained exploration activities and technological advancements. The increasing adoption of integrated solutions and the development of AI-powered data analytics capabilities offer significant strategic opportunities for market participants. Expansion into new geographical regions, particularly in emerging economies, presents further growth potential. Companies focusing on innovation, cost optimization, and strategic partnerships are best positioned to capitalize on future market opportunities.
Seismic Services Market Segmentation
-
1. Service
- 1.1. Data Acquisition
- 1.2. Data Processing and Interpretation
-
2. Location of Deployment
- 2.1. Onshore
- 2.2. Offshore
Seismic Services Market Segmentation By Geography
-
1. North America
- 1.1. United States of America
- 1.2. Canada
- 1.3. Rest of North America
-
2. Asia Pacific
- 2.1. China
- 2.2. India
- 2.3. Australia
- 2.4. Rest of Asia Pacific
-
3. Europe
- 3.1. Germany
- 3.2. Russia
- 3.3. United Kingdom
- 3.4. France
- 3.5. Rest of Europe
-
4. South America
- 4.1. Brazil
- 4.2. Argentina
- 4.3. Rest of the South America
-
5. Middle East and Africa
- 5.1. United Arab Emirates
- 5.2. Saudi Arabia
- 5.3. Iran
- 5.4. Iraq
- 5.5. Rest of the Middle East and Africa
Seismic Services Market REPORT HIGHLIGHTS
| Aspects | Details |
|---|---|
| Study Period | 2019-2033 |
| Base Year | 2024 |
| Estimated Year | 2025 |
| Forecast Period | 2025-2033 |
| Historical Period | 2019-2024 |
| Growth Rate | CAGR of 3.10% from 2019-2033 |
| Segmentation |
|
Table of Contents
- 1. Introduction
- 1.1. Research Scope
- 1.2. Market Segmentation
- 1.3. Research Methodology
- 1.4. Definitions and Assumptions
- 2. Executive Summary
- 2.1. Introduction
- 3. Market Dynamics
- 3.1. Introduction
- 3.2. Market Drivers
- 3.2.1 4.; Increasing Exploration in Offshore Areas4.; The Strengthening of Crude Oil Prices
- 3.2.2 Making the Upstream Activities Economically Feasible
- 3.3. Market Restrains
- 3.3.1. 4.; Shifting to Renewable Energy Sources
- 3.4. Market Trends
- 3.4.1. Increasing Demand from the Offshore Oil and Gas Industry
- 4. Market Factor Analysis
- 4.1. Porters Five Forces
- 4.2. Supply/Value Chain
- 4.3. PESTEL analysis
- 4.4. Market Entropy
- 4.5. Patent/Trademark Analysis
- 5. Global Seismic Services Market Analysis, Insights and Forecast, 2019-2031
- 5.1. Market Analysis, Insights and Forecast - by Service
- 5.1.1. Data Acquisition
- 5.1.2. Data Processing and Interpretation
- 5.2. Market Analysis, Insights and Forecast - by Location of Deployment
- 5.2.1. Onshore
- 5.2.2. Offshore
- 5.3. Market Analysis, Insights and Forecast - by Region
- 5.3.1. North America
- 5.3.2. Asia Pacific
- 5.3.3. Europe
- 5.3.4. South America
- 5.3.5. Middle East and Africa
- 5.1. Market Analysis, Insights and Forecast - by Service
- 6. North America Seismic Services Market Analysis, Insights and Forecast, 2019-2031
- 6.1. Market Analysis, Insights and Forecast - by Service
- 6.1.1. Data Acquisition
- 6.1.2. Data Processing and Interpretation
- 6.2. Market Analysis, Insights and Forecast - by Location of Deployment
- 6.2.1. Onshore
- 6.2.2. Offshore
- 6.1. Market Analysis, Insights and Forecast - by Service
- 7. Asia Pacific Seismic Services Market Analysis, Insights and Forecast, 2019-2031
- 7.1. Market Analysis, Insights and Forecast - by Service
- 7.1.1. Data Acquisition
- 7.1.2. Data Processing and Interpretation
- 7.2. Market Analysis, Insights and Forecast - by Location of Deployment
- 7.2.1. Onshore
- 7.2.2. Offshore
- 7.1. Market Analysis, Insights and Forecast - by Service
- 8. Europe Seismic Services Market Analysis, Insights and Forecast, 2019-2031
- 8.1. Market Analysis, Insights and Forecast - by Service
- 8.1.1. Data Acquisition
- 8.1.2. Data Processing and Interpretation
- 8.2. Market Analysis, Insights and Forecast - by Location of Deployment
- 8.2.1. Onshore
- 8.2.2. Offshore
- 8.1. Market Analysis, Insights and Forecast - by Service
- 9. South America Seismic Services Market Analysis, Insights and Forecast, 2019-2031
- 9.1. Market Analysis, Insights and Forecast - by Service
- 9.1.1. Data Acquisition
- 9.1.2. Data Processing and Interpretation
- 9.2. Market Analysis, Insights and Forecast - by Location of Deployment
- 9.2.1. Onshore
- 9.2.2. Offshore
- 9.1. Market Analysis, Insights and Forecast - by Service
- 10. Middle East and Africa Seismic Services Market Analysis, Insights and Forecast, 2019-2031
- 10.1. Market Analysis, Insights and Forecast - by Service
- 10.1.1. Data Acquisition
- 10.1.2. Data Processing and Interpretation
- 10.2. Market Analysis, Insights and Forecast - by Location of Deployment
- 10.2.1. Onshore
- 10.2.2. Offshore
- 10.1. Market Analysis, Insights and Forecast - by Service
- 11. North America Seismic Services Market Analysis, Insights and Forecast, 2019-2031
- 11.1. Market Analysis, Insights and Forecast - By Country/Sub-region
- 11.1.1 United States
- 11.1.2 Canada
- 11.1.3 Mexico
- 12. Europe Seismic Services Market Analysis, Insights and Forecast, 2019-2031
- 12.1. Market Analysis, Insights and Forecast - By Country/Sub-region
- 12.1.1 Germany
- 12.1.2 United Kingdom
- 12.1.3 France
- 12.1.4 Spain
- 12.1.5 Italy
- 12.1.6 Spain
- 12.1.7 Belgium
- 12.1.8 Netherland
- 12.1.9 Nordics
- 12.1.10 Rest of Europe
- 13. Asia Pacific Seismic Services Market Analysis, Insights and Forecast, 2019-2031
- 13.1. Market Analysis, Insights and Forecast - By Country/Sub-region
- 13.1.1 China
- 13.1.2 Japan
- 13.1.3 India
- 13.1.4 South Korea
- 13.1.5 Southeast Asia
- 13.1.6 Australia
- 13.1.7 Indonesia
- 13.1.8 Phillipes
- 13.1.9 Singapore
- 13.1.10 Thailandc
- 13.1.11 Rest of Asia Pacific
- 14. South America Seismic Services Market Analysis, Insights and Forecast, 2019-2031
- 14.1. Market Analysis, Insights and Forecast - By Country/Sub-region
- 14.1.1 Brazil
- 14.1.2 Argentina
- 14.1.3 Peru
- 14.1.4 Chile
- 14.1.5 Colombia
- 14.1.6 Ecuador
- 14.1.7 Venezuela
- 14.1.8 Rest of South America
- 15. MEA Seismic Services Market Analysis, Insights and Forecast, 2019-2031
- 15.1. Market Analysis, Insights and Forecast - By Country/Sub-region
- 15.1.1 United Arab Emirates
- 15.1.2 Saudi Arabia
- 15.1.3 South Africa
- 15.1.4 Rest of Middle East and Africa
- 16. Competitive Analysis
- 16.1. Global Market Share Analysis 2024
- 16.2. Company Profiles
- 16.2.1 SAExploration Holdings Inc
- 16.2.1.1. Overview
- 16.2.1.2. Products
- 16.2.1.3. SWOT Analysis
- 16.2.1.4. Recent Developments
- 16.2.1.5. Financials (Based on Availability)
- 16.2.2 China Oilfield Services Limited
- 16.2.2.1. Overview
- 16.2.2.2. Products
- 16.2.2.3. SWOT Analysis
- 16.2.2.4. Recent Developments
- 16.2.2.5. Financials (Based on Availability)
- 16.2.3 ION Geophysical Corporation
- 16.2.3.1. Overview
- 16.2.3.2. Products
- 16.2.3.3. SWOT Analysis
- 16.2.3.4. Recent Developments
- 16.2.3.5. Financials (Based on Availability)
- 16.2.4 Shearwater GeoServices Holding AS
- 16.2.4.1. Overview
- 16.2.4.2. Products
- 16.2.4.3. SWOT Analysis
- 16.2.4.4. Recent Developments
- 16.2.4.5. Financials (Based on Availability)
- 16.2.5 Fugro NV
- 16.2.5.1. Overview
- 16.2.5.2. Products
- 16.2.5.3. SWOT Analysis
- 16.2.5.4. Recent Developments
- 16.2.5.5. Financials (Based on Availability)
- 16.2.6 Schlumberger NV
- 16.2.6.1. Overview
- 16.2.6.2. Products
- 16.2.6.3. SWOT Analysis
- 16.2.6.4. Recent Developments
- 16.2.6.5. Financials (Based on Availability)
- 16.2.7 CGG SA
- 16.2.7.1. Overview
- 16.2.7.2. Products
- 16.2.7.3. SWOT Analysis
- 16.2.7.4. Recent Developments
- 16.2.7.5. Financials (Based on Availability)
- 16.2.8 Briscoe Group Limited
- 16.2.8.1. Overview
- 16.2.8.2. Products
- 16.2.8.3. SWOT Analysis
- 16.2.8.4. Recent Developments
- 16.2.8.5. Financials (Based on Availability)
- 16.2.9 Halliburton Company
- 16.2.9.1. Overview
- 16.2.9.2. Products
- 16.2.9.3. SWOT Analysis
- 16.2.9.4. Recent Developments
- 16.2.9.5. Financials (Based on Availability)
- 16.2.10 SeaBird Exploration PLC
- 16.2.10.1. Overview
- 16.2.10.2. Products
- 16.2.10.3. SWOT Analysis
- 16.2.10.4. Recent Developments
- 16.2.10.5. Financials (Based on Availability)
- 16.2.11 Magseis Fairfield ASA (WGP Group Ltd)
- 16.2.11.1. Overview
- 16.2.11.2. Products
- 16.2.11.3. SWOT Analysis
- 16.2.11.4. Recent Developments
- 16.2.11.5. Financials (Based on Availability)
- 16.2.12 TGS ASA
- 16.2.12.1. Overview
- 16.2.12.2. Products
- 16.2.12.3. SWOT Analysis
- 16.2.12.4. Recent Developments
- 16.2.12.5. Financials (Based on Availability)
- 16.2.13 Polarcus Ltd
- 16.2.13.1. Overview
- 16.2.13.2. Products
- 16.2.13.3. SWOT Analysis
- 16.2.13.4. Recent Developments
- 16.2.13.5. Financials (Based on Availability)
- 16.2.14 PGS ASA
- 16.2.14.1. Overview
- 16.2.14.2. Products
- 16.2.14.3. SWOT Analysis
- 16.2.14.4. Recent Developments
- 16.2.14.5. Financials (Based on Availability)
- 16.2.1 SAExploration Holdings Inc
List of Figures
- Figure 1: Global Seismic Services Market Revenue Breakdown (Million, %) by Region 2024 & 2032
- Figure 2: North America Seismic Services Market Revenue (Million), by Country 2024 & 2032
- Figure 3: North America Seismic Services Market Revenue Share (%), by Country 2024 & 2032
- Figure 4: Europe Seismic Services Market Revenue (Million), by Country 2024 & 2032
- Figure 5: Europe Seismic Services Market Revenue Share (%), by Country 2024 & 2032
- Figure 6: Asia Pacific Seismic Services Market Revenue (Million), by Country 2024 & 2032
- Figure 7: Asia Pacific Seismic Services Market Revenue Share (%), by Country 2024 & 2032
- Figure 8: South America Seismic Services Market Revenue (Million), by Country 2024 & 2032
- Figure 9: South America Seismic Services Market Revenue Share (%), by Country 2024 & 2032
- Figure 10: MEA Seismic Services Market Revenue (Million), by Country 2024 & 2032
- Figure 11: MEA Seismic Services Market Revenue Share (%), by Country 2024 & 2032
- Figure 12: North America Seismic Services Market Revenue (Million), by Service 2024 & 2032
- Figure 13: North America Seismic Services Market Revenue Share (%), by Service 2024 & 2032
- Figure 14: North America Seismic Services Market Revenue (Million), by Location of Deployment 2024 & 2032
- Figure 15: North America Seismic Services Market Revenue Share (%), by Location of Deployment 2024 & 2032
- Figure 16: North America Seismic Services Market Revenue (Million), by Country 2024 & 2032
- Figure 17: North America Seismic Services Market Revenue Share (%), by Country 2024 & 2032
- Figure 18: Asia Pacific Seismic Services Market Revenue (Million), by Service 2024 & 2032
- Figure 19: Asia Pacific Seismic Services Market Revenue Share (%), by Service 2024 & 2032
- Figure 20: Asia Pacific Seismic Services Market Revenue (Million), by Location of Deployment 2024 & 2032
- Figure 21: Asia Pacific Seismic Services Market Revenue Share (%), by Location of Deployment 2024 & 2032
- Figure 22: Asia Pacific Seismic Services Market Revenue (Million), by Country 2024 & 2032
- Figure 23: Asia Pacific Seismic Services Market Revenue Share (%), by Country 2024 & 2032
- Figure 24: Europe Seismic Services Market Revenue (Million), by Service 2024 & 2032
- Figure 25: Europe Seismic Services Market Revenue Share (%), by Service 2024 & 2032
- Figure 26: Europe Seismic Services Market Revenue (Million), by Location of Deployment 2024 & 2032
- Figure 27: Europe Seismic Services Market Revenue Share (%), by Location of Deployment 2024 & 2032
- Figure 28: Europe Seismic Services Market Revenue (Million), by Country 2024 & 2032
- Figure 29: Europe Seismic Services Market Revenue Share (%), by Country 2024 & 2032
- Figure 30: South America Seismic Services Market Revenue (Million), by Service 2024 & 2032
- Figure 31: South America Seismic Services Market Revenue Share (%), by Service 2024 & 2032
- Figure 32: South America Seismic Services Market Revenue (Million), by Location of Deployment 2024 & 2032
- Figure 33: South America Seismic Services Market Revenue Share (%), by Location of Deployment 2024 & 2032
- Figure 34: South America Seismic Services Market Revenue (Million), by Country 2024 & 2032
- Figure 35: South America Seismic Services Market Revenue Share (%), by Country 2024 & 2032
- Figure 36: Middle East and Africa Seismic Services Market Revenue (Million), by Service 2024 & 2032
- Figure 37: Middle East and Africa Seismic Services Market Revenue Share (%), by Service 2024 & 2032
- Figure 38: Middle East and Africa Seismic Services Market Revenue (Million), by Location of Deployment 2024 & 2032
- Figure 39: Middle East and Africa Seismic Services Market Revenue Share (%), by Location of Deployment 2024 & 2032
- Figure 40: Middle East and Africa Seismic Services Market Revenue (Million), by Country 2024 & 2032
- Figure 41: Middle East and Africa Seismic Services Market Revenue Share (%), by Country 2024 & 2032
List of Tables
- Table 1: Global Seismic Services Market Revenue Million Forecast, by Region 2019 & 2032
- Table 2: Global Seismic Services Market Revenue Million Forecast, by Service 2019 & 2032
- Table 3: Global Seismic Services Market Revenue Million Forecast, by Location of Deployment 2019 & 2032
- Table 4: Global Seismic Services Market Revenue Million Forecast, by Region 2019 & 2032
- Table 5: Global Seismic Services Market Revenue Million Forecast, by Country 2019 & 2032
- Table 6: United States Seismic Services Market Revenue (Million) Forecast, by Application 2019 & 2032
- Table 7: Canada Seismic Services Market Revenue (Million) Forecast, by Application 2019 & 2032
- Table 8: Mexico Seismic Services Market Revenue (Million) Forecast, by Application 2019 & 2032
- Table 9: Global Seismic Services Market Revenue Million Forecast, by Country 2019 & 2032
- Table 10: Germany Seismic Services Market Revenue (Million) Forecast, by Application 2019 & 2032
- Table 11: United Kingdom Seismic Services Market Revenue (Million) Forecast, by Application 2019 & 2032
- Table 12: France Seismic Services Market Revenue (Million) Forecast, by Application 2019 & 2032
- Table 13: Spain Seismic Services Market Revenue (Million) Forecast, by Application 2019 & 2032
- Table 14: Italy Seismic Services Market Revenue (Million) Forecast, by Application 2019 & 2032
- Table 15: Spain Seismic Services Market Revenue (Million) Forecast, by Application 2019 & 2032
- Table 16: Belgium Seismic Services Market Revenue (Million) Forecast, by Application 2019 & 2032
- Table 17: Netherland Seismic Services Market Revenue (Million) Forecast, by Application 2019 & 2032
- Table 18: Nordics Seismic Services Market Revenue (Million) Forecast, by Application 2019 & 2032
- Table 19: Rest of Europe Seismic Services Market Revenue (Million) Forecast, by Application 2019 & 2032
- Table 20: Global Seismic Services Market Revenue Million Forecast, by Country 2019 & 2032
- Table 21: China Seismic Services Market Revenue (Million) Forecast, by Application 2019 & 2032
- Table 22: Japan Seismic Services Market Revenue (Million) Forecast, by Application 2019 & 2032
- Table 23: India Seismic Services Market Revenue (Million) Forecast, by Application 2019 & 2032
- Table 24: South Korea Seismic Services Market Revenue (Million) Forecast, by Application 2019 & 2032
- Table 25: Southeast Asia Seismic Services Market Revenue (Million) Forecast, by Application 2019 & 2032
- Table 26: Australia Seismic Services Market Revenue (Million) Forecast, by Application 2019 & 2032
- Table 27: Indonesia Seismic Services Market Revenue (Million) Forecast, by Application 2019 & 2032
- Table 28: Phillipes Seismic Services Market Revenue (Million) Forecast, by Application 2019 & 2032
- Table 29: Singapore Seismic Services Market Revenue (Million) Forecast, by Application 2019 & 2032
- Table 30: Thailandc Seismic Services Market Revenue (Million) Forecast, by Application 2019 & 2032
- Table 31: Rest of Asia Pacific Seismic Services Market Revenue (Million) Forecast, by Application 2019 & 2032
- Table 32: Global Seismic Services Market Revenue Million Forecast, by Country 2019 & 2032
- Table 33: Brazil Seismic Services Market Revenue (Million) Forecast, by Application 2019 & 2032
- Table 34: Argentina Seismic Services Market Revenue (Million) Forecast, by Application 2019 & 2032
- Table 35: Peru Seismic Services Market Revenue (Million) Forecast, by Application 2019 & 2032
- Table 36: Chile Seismic Services Market Revenue (Million) Forecast, by Application 2019 & 2032
- Table 37: Colombia Seismic Services Market Revenue (Million) Forecast, by Application 2019 & 2032
- Table 38: Ecuador Seismic Services Market Revenue (Million) Forecast, by Application 2019 & 2032
- Table 39: Venezuela Seismic Services Market Revenue (Million) Forecast, by Application 2019 & 2032
- Table 40: Rest of South America Seismic Services Market Revenue (Million) Forecast, by Application 2019 & 2032
- Table 41: Global Seismic Services Market Revenue Million Forecast, by Country 2019 & 2032
- Table 42: United Arab Emirates Seismic Services Market Revenue (Million) Forecast, by Application 2019 & 2032
- Table 43: Saudi Arabia Seismic Services Market Revenue (Million) Forecast, by Application 2019 & 2032
- Table 44: South Africa Seismic Services Market Revenue (Million) Forecast, by Application 2019 & 2032
- Table 45: Rest of Middle East and Africa Seismic Services Market Revenue (Million) Forecast, by Application 2019 & 2032
- Table 46: Global Seismic Services Market Revenue Million Forecast, by Service 2019 & 2032
- Table 47: Global Seismic Services Market Revenue Million Forecast, by Location of Deployment 2019 & 2032
- Table 48: Global Seismic Services Market Revenue Million Forecast, by Country 2019 & 2032
- Table 49: United States of America Seismic Services Market Revenue (Million) Forecast, by Application 2019 & 2032
- Table 50: Canada Seismic Services Market Revenue (Million) Forecast, by Application 2019 & 2032
- Table 51: Rest of North America Seismic Services Market Revenue (Million) Forecast, by Application 2019 & 2032
- Table 52: Global Seismic Services Market Revenue Million Forecast, by Service 2019 & 2032
- Table 53: Global Seismic Services Market Revenue Million Forecast, by Location of Deployment 2019 & 2032
- Table 54: Global Seismic Services Market Revenue Million Forecast, by Country 2019 & 2032
- Table 55: China Seismic Services Market Revenue (Million) Forecast, by Application 2019 & 2032
- Table 56: India Seismic Services Market Revenue (Million) Forecast, by Application 2019 & 2032
- Table 57: Australia Seismic Services Market Revenue (Million) Forecast, by Application 2019 & 2032
- Table 58: Rest of Asia Pacific Seismic Services Market Revenue (Million) Forecast, by Application 2019 & 2032
- Table 59: Global Seismic Services Market Revenue Million Forecast, by Service 2019 & 2032
- Table 60: Global Seismic Services Market Revenue Million Forecast, by Location of Deployment 2019 & 2032
- Table 61: Global Seismic Services Market Revenue Million Forecast, by Country 2019 & 2032
- Table 62: Germany Seismic Services Market Revenue (Million) Forecast, by Application 2019 & 2032
- Table 63: Russia Seismic Services Market Revenue (Million) Forecast, by Application 2019 & 2032
- Table 64: United Kingdom Seismic Services Market Revenue (Million) Forecast, by Application 2019 & 2032
- Table 65: France Seismic Services Market Revenue (Million) Forecast, by Application 2019 & 2032
- Table 66: Rest of Europe Seismic Services Market Revenue (Million) Forecast, by Application 2019 & 2032
- Table 67: Global Seismic Services Market Revenue Million Forecast, by Service 2019 & 2032
- Table 68: Global Seismic Services Market Revenue Million Forecast, by Location of Deployment 2019 & 2032
- Table 69: Global Seismic Services Market Revenue Million Forecast, by Country 2019 & 2032
- Table 70: Brazil Seismic Services Market Revenue (Million) Forecast, by Application 2019 & 2032
- Table 71: Argentina Seismic Services Market Revenue (Million) Forecast, by Application 2019 & 2032
- Table 72: Rest of the South America Seismic Services Market Revenue (Million) Forecast, by Application 2019 & 2032
- Table 73: Global Seismic Services Market Revenue Million Forecast, by Service 2019 & 2032
- Table 74: Global Seismic Services Market Revenue Million Forecast, by Location of Deployment 2019 & 2032
- Table 75: Global Seismic Services Market Revenue Million Forecast, by Country 2019 & 2032
- Table 76: United Arab Emirates Seismic Services Market Revenue (Million) Forecast, by Application 2019 & 2032
- Table 77: Saudi Arabia Seismic Services Market Revenue (Million) Forecast, by Application 2019 & 2032
- Table 78: Iran Seismic Services Market Revenue (Million) Forecast, by Application 2019 & 2032
- Table 79: Iraq Seismic Services Market Revenue (Million) Forecast, by Application 2019 & 2032
- Table 80: Rest of the Middle East and Africa Seismic Services Market Revenue (Million) Forecast, by Application 2019 & 2032
Frequently Asked Questions
1. What is the projected Compound Annual Growth Rate (CAGR) of the Seismic Services Market?
The projected CAGR is approximately 3.10%.
2. Which companies are prominent players in the Seismic Services Market?
Key companies in the market include SAExploration Holdings Inc, China Oilfield Services Limited, ION Geophysical Corporation, Shearwater GeoServices Holding AS, Fugro NV, Schlumberger NV, CGG SA, Briscoe Group Limited, Halliburton Company, SeaBird Exploration PLC, Magseis Fairfield ASA (WGP Group Ltd), TGS ASA, Polarcus Ltd, PGS ASA.
3. What are the main segments of the Seismic Services Market?
The market segments include Service, Location of Deployment.
4. Can you provide details about the market size?
The market size is estimated to be USD 5.61 Million as of 2022.
5. What are some drivers contributing to market growth?
4.; Increasing Exploration in Offshore Areas4.; The Strengthening of Crude Oil Prices. Making the Upstream Activities Economically Feasible.
6. What are the notable trends driving market growth?
Increasing Demand from the Offshore Oil and Gas Industry.
7. Are there any restraints impacting market growth?
4.; Shifting to Renewable Energy Sources.
8. Can you provide examples of recent developments in the market?
In May 2023, TGS, in partnership with PGS and Schlumberger, has secured pre-funding for a 6,885 square kilometer (2,658 square miles) multi-client 3D seismic survey offshore Malaysia in the North Luconia Province of the Sarawak Basin.
9. What pricing options are available for accessing the report?
Pricing options include single-user, multi-user, and enterprise licenses priced at USD 4750, USD 5250, and USD 8750 respectively.
10. Is the market size provided in terms of value or volume?
The market size is provided in terms of value, measured in Million.
11. Are there any specific market keywords associated with the report?
Yes, the market keyword associated with the report is "Seismic Services Market," which aids in identifying and referencing the specific market segment covered.
12. How do I determine which pricing option suits my needs best?
The pricing options vary based on user requirements and access needs. Individual users may opt for single-user licenses, while businesses requiring broader access may choose multi-user or enterprise licenses for cost-effective access to the report.
13. Are there any additional resources or data provided in the Seismic Services Market report?
While the report offers comprehensive insights, it's advisable to review the specific contents or supplementary materials provided to ascertain if additional resources or data are available.
14. How can I stay updated on further developments or reports in the Seismic Services Market?
To stay informed about further developments, trends, and reports in the Seismic Services Market, consider subscribing to industry newsletters, following relevant companies and organizations, or regularly checking reputable industry news sources and publications.
Methodology
Step 1 - Identification of Relevant Samples Size from Population Database


Step 2 - Approaches for Defining Global Market Size (Value, Volume* & Price*)

Note*: In applicable scenarios
Step 3 - Data Sources
Primary Research
- Web Analytics
- Survey Reports
- Research Institute
- Latest Research Reports
- Opinion Leaders
Secondary Research
- Annual Reports
- White Paper
- Latest Press Release
- Industry Association
- Paid Database
- Investor Presentations

Step 4 - Data Triangulation
Involves using different sources of information in order to increase the validity of a study
These sources are likely to be stakeholders in a program - participants, other researchers, program staff, other community members, and so on.
Then we put all data in single framework & apply various statistical tools to find out the dynamic on the market.
During the analysis stage, feedback from the stakeholder groups would be compared to determine areas of agreement as well as areas of divergence


