
Key Insights
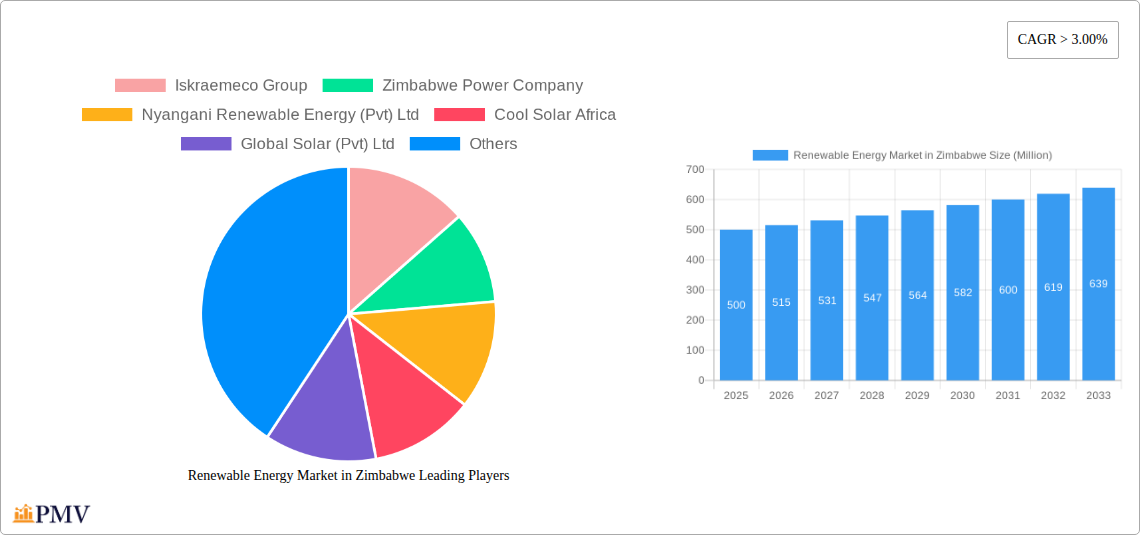
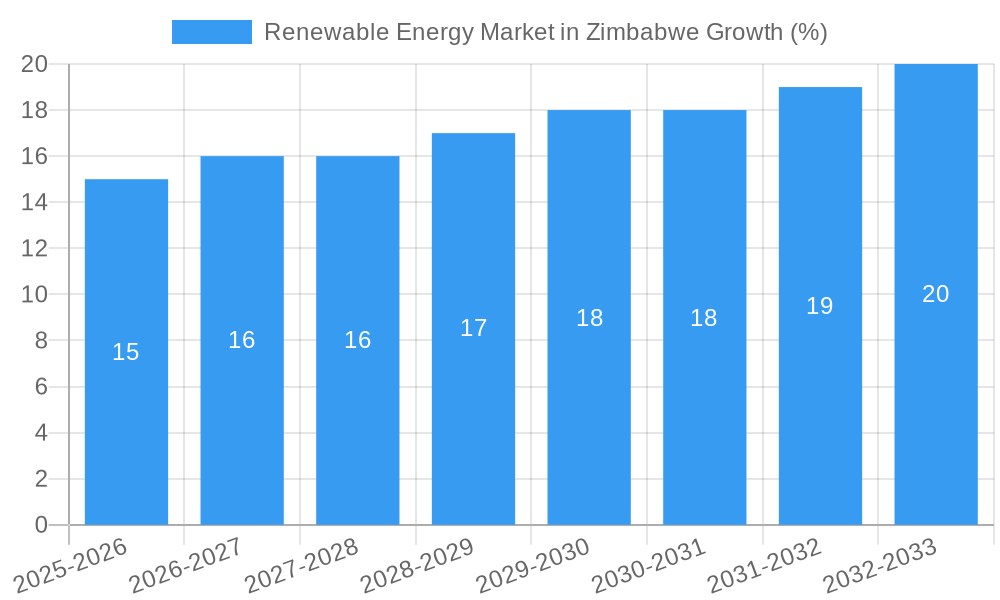
The Zimbabwean renewable energy market, valued at approximately $500 million in 2025, exhibits robust growth potential, projected to expand at a compound annual growth rate (CAGR) exceeding 3% from 2025 to 2033. This growth is fueled by several key drivers. Firstly, Zimbabwe faces significant electricity shortages, driving demand for reliable and sustainable energy sources. Secondly, the government actively promotes renewable energy through favorable policies and incentives, including feed-in tariffs and tax breaks, aimed at attracting both domestic and international investment. Thirdly, decreasing technology costs, particularly for solar photovoltaic (PV) systems, make renewable energy increasingly competitive with traditional fossil fuel-based power generation. However, challenges remain. Limited access to financing, especially for smaller-scale projects, and a lack of sufficient grid infrastructure to accommodate the influx of renewable energy pose significant constraints. The market is segmented by generation source, with hydropower, solar, and bioenergy being the most prominent. Key players like Iskraemeco Group, Zimbabwe Power Company, and several smaller renewable energy developers are actively contributing to the market's expansion. The consistent growth trajectory anticipates a substantial increase in market value over the forecast period, although challenges related to infrastructure development and financial accessibility must be addressed to fully realize the market's potential.
The renewable energy sector in Zimbabwe is poised for substantial growth driven by the urgent need for reliable power, governmental support, and declining technology costs. Hydropower, a mature sector, continues to play a significant role. However, the solar segment is experiencing particularly rapid expansion due to its scalability and decreasing capital expenditure. Bioenergy, mainly derived from biomass, also represents a notable, albeit less rapidly growing, segment. The success of Zimbabwe's renewable energy transition depends significantly on the effective implementation of supportive policies, improved grid infrastructure investment, and access to both domestic and international funding to support project development and deployment across all segments. The involvement of key players like Iskraemeco Group and Zimbabwe Power Company signals a strong commitment to expanding the capacity of renewable energy sources within the country.
Renewable Energy Market in Zimbabwe: A Comprehensive Report (2019-2033)
This in-depth report provides a comprehensive analysis of the Renewable Energy market in Zimbabwe, covering the period from 2019 to 2033. It delves into market structure, competitive dynamics, industry trends, and key players, offering valuable insights for investors, businesses, and policymakers. With a focus on hydropower, solar, bioenergy, and other generation sources, this report projects a robust growth trajectory, driven by supportive government policies and increasing investment in renewable energy infrastructure. The report utilizes data from the historical period (2019-2024), the base year (2025), and forecasts the market until 2033.
Renewable Energy Market in Zimbabwe Market Structure & Competitive Dynamics
The Zimbabwean renewable energy market exhibits a moderately concentrated structure, with a few large players like Zimbabwe Power Company alongside numerous smaller, specialized companies such as Nyangani Renewable Energy (Pvt) Ltd and Cool Solar Africa. Market share is currently dominated by hydropower, but solar is experiencing rapid growth. The regulatory framework, while evolving, is increasingly supportive of renewable energy development. This is evidenced by recent government initiatives and the influx of foreign investment. Innovation is primarily driven by technology transfer and adaptation of existing technologies to the local context. The market is witnessing increased M&A activity, particularly in the solar sector, though exact deal values remain largely undisclosed, estimated to be in the tens of Millions of USD annually in recent years. Significant substitution of fossil fuels is also expected in the forecast period. End-user trends show a strong preference for reliable and affordable energy sources, with a growing awareness of environmental sustainability among consumers and businesses.
- Market Concentration: Moderate, with a few dominant players and numerous smaller firms.
- Innovation Ecosystem: Primarily driven by technology adaptation and foreign investment.
- Regulatory Framework: Evolving, with increasing support for renewable energy.
- Product Substitutes: Fossil fuels (gradually being replaced).
- End-User Trends: Growing preference for reliable, affordable, and sustainable energy.
- M&A Activity: Increasing, predominantly in the solar sector; estimated deal values in the tens of Millions of USD annually.
Renewable Energy Market in Zimbabwe Industry Trends & Insights
The Zimbabwean renewable energy market is experiencing significant growth, driven by several factors. The country faces persistent electricity shortages, making renewable energy a crucial solution. Government initiatives, including the recently announced USD 1 Billion investment in 1 GW of solar IPP installations, are accelerating market expansion. Furthermore, increasing awareness of climate change and the need for sustainable energy sources is driving demand. The compound annual growth rate (CAGR) is projected to be xx% during the forecast period (2025-2033). Technological advancements, particularly in solar photovoltaic (PV) technology, are making renewable energy more cost-competitive. Market penetration of renewable energy in total electricity generation is expected to reach xx% by 2033, compared to xx% in 2025. This growth is further fueled by the USD 45 Million program approved by the UN SDG Fund in January 2022, which aims to catalyze investments in renewable energy. The competitive landscape is intensifying, with both domestic and international players vying for market share.
Dominant Markets & Segments in Renewable Energy Market in Zimbabwe
Currently, hydropower dominates the Zimbabwean renewable energy market, contributing the largest share of installed capacity. However, the solar segment is poised for rapid growth due to its scalability, cost-effectiveness, and technological advancements. Bioenergy contributes significantly, particularly in rural areas using biomass resources. Other generation sources, such as wind and geothermal energy, have less developed presence currently.
Hydropower:
- Key Drivers: Existing infrastructure, relatively mature technology, consistent power generation.
- Dominance Analysis: Currently holds the largest market share due to existing infrastructure and reliable generation capacity. However, its growth is limited by geographical constraints and environmental concerns.
Solar:
- Key Drivers: Decreasing costs of solar PV technology, government support through initiatives like the USD 1 Billion investment in solar IPP projects, ease of deployment, and scalability.
- Dominance Analysis: Rapidly increasing market share, expected to become a major contributor to electricity generation in the coming years.
Bioenergy:
- Key Drivers: Abundance of biomass resources in rural areas, potential for decentralized energy generation, and contribution to rural development.
- Dominance Analysis: Significant but niche market, primarily focused on rural electrification and limited access regions.
Other Generation Sources (Wind, Geothermal):
- Key Drivers: Potential for future growth, driven by technological advancements and government support.
- Dominance Analysis: Currently small market share, but potential for growth with increased investment and infrastructure development.
Renewable Energy Market in Zimbabwe Product Innovations
Recent innovations include the adoption of more efficient solar PV panels, improved energy storage solutions like battery systems, and the development of hybrid renewable energy systems combining solar and hydropower. These innovations enhance reliability and reduce the cost of renewable energy, making them more competitive with traditional fossil fuel-based sources. Focus on locally adapted technologies is also increasing, to improve market fit and lower installation costs.
Report Segmentation & Scope
This report segments the Zimbabwean renewable energy market by generation source: Hydropower, Solar, Bioenergy, and Other Generation Sources. Each segment is analyzed in terms of market size (in Millions of USD), growth projections, and competitive dynamics. The report provides detailed forecasts for each segment, considering factors like technological advancements, policy changes, and investment trends.
- Hydropower: This segment is anticipated to maintain steady growth with incremental capacity additions driven by upgrades to existing facilities.
- Solar: This segment is projected to experience the fastest growth due to the government initiative and the decreasing costs of solar PV.
- Bioenergy: Growth in this segment is expected to be moderate, mostly confined to rural electrification efforts.
- Other Generation Sources: This segment exhibits high growth potential, but faces challenges in terms of infrastructure development and technology costs.
Key Drivers of Renewable Energy Market in Zimbabwe Growth
The Zimbabwean renewable energy market is propelled by several key factors. These include supportive government policies, such as the USD 1 Billion investment in solar projects and the USD 45 Million UN SDG Fund program; decreasing costs of renewable energy technologies, making them increasingly cost-competitive with fossil fuels; increasing electricity demand coupled with unreliable power supply, driving the need for alternative energy sources; and growing environmental awareness among consumers and businesses.
Challenges in the Renewable Energy Market in Zimbabwe Sector
Despite the positive outlook, several challenges hinder the growth of the Zimbabwean renewable energy market. These include the high initial capital costs of renewable energy projects, limited access to financing, unreliable grid infrastructure in many areas making integration difficult, and the need for improved regulatory frameworks to streamline project development. Furthermore, the fluctuating exchange rates and inconsistent macroeconomic policies can also impact investment decisions.
Leading Players in the Renewable Energy Market in Zimbabwe Market
- Iskraemeco Group
- Zimbabwe Power Company
- Nyangani Renewable Energy (Pvt) Ltd
- Cool Solar Africa
- Global Solar (Pvt) Ltd
Key Developments in Renewable Energy Market in Zimbabwe Sector
December 2022: Zimbabwe announced a government implementation agreement (GIA) to expedite the commissioning of 27 solar IPP installations totaling 1 GW, representing a USD 1 Billion investment. This significantly boosts the solar sector.
January 2022: The UN SDG Fund approved a USD 45 Million program to catalyze investments in renewable energy, with USD 10 Million from the UN and USD 35 Million from the Zimbabwean government and local partners. This program boosts both public and private sector involvement.
Strategic Renewable Energy Market in Zimbabwe Market Outlook
The Zimbabwean renewable energy market presents significant opportunities for investors and businesses. The government’s commitment to renewable energy development, coupled with technological advancements and growing energy demand, points towards substantial future growth. Strategic focus on developing local capacity, addressing financing constraints, and improving grid infrastructure will be crucial to unlocking the market's full potential. The expansion of solar and other alternative sources promises to transform the energy landscape and enhance energy security within the country.
Renewable Energy Market in Zimbabwe Segmentation
-
1. Generation Source
- 1.1. Hydropower
- 1.2. Solar
- 1.3. Bioenergy
- 1.4. Other Generation Sources
Renewable Energy Market in Zimbabwe Segmentation By Geography
-
1. North America
- 1.1. United States
- 1.2. Canada
- 1.3. Mexico
-
2. South America
- 2.1. Brazil
- 2.2. Argentina
- 2.3. Rest of South America
-
3. Europe
- 3.1. United Kingdom
- 3.2. Germany
- 3.3. France
- 3.4. Italy
- 3.5. Spain
- 3.6. Russia
- 3.7. Benelux
- 3.8. Nordics
- 3.9. Rest of Europe
-
4. Middle East & Africa
- 4.1. Turkey
- 4.2. Israel
- 4.3. GCC
- 4.4. North Africa
- 4.5. South Africa
- 4.6. Rest of Middle East & Africa
-
5. Asia Pacific
- 5.1. China
- 5.2. India
- 5.3. Japan
- 5.4. South Korea
- 5.5. ASEAN
- 5.6. Oceania
- 5.7. Rest of Asia Pacific
Renewable Energy Market in Zimbabwe REPORT HIGHLIGHTS
| Aspects | Details |
|---|---|
| Study Period | 2019-2033 |
| Base Year | 2024 |
| Estimated Year | 2025 |
| Forecast Period | 2025-2033 |
| Historical Period | 2019-2024 |
| Growth Rate | CAGR of > 3.00% from 2019-2033 |
| Segmentation |
|
Table of Contents
- 1. Introduction
- 1.1. Research Scope
- 1.2. Market Segmentation
- 1.3. Research Methodology
- 1.4. Definitions and Assumptions
- 2. Executive Summary
- 2.1. Introduction
- 3. Market Dynamics
- 3.1. Introduction
- 3.2. Market Drivers
- 3.2.1 4.; Increasing Demand for Coal Based Power Generation Sector4.; Ease of Availability of Coal for Various Sectors
- 3.2.2 Such as Transport
- 3.2.3 Residential
- 3.2.4 Commercial and Others
- 3.3. Market Restrains
- 3.3.1. 4.; Increasing Adoption of Renewable Energy
- 3.4. Market Trends
- 3.4.1. Hydropower Source to Witness Significant Growth
- 4. Market Factor Analysis
- 4.1. Porters Five Forces
- 4.2. Supply/Value Chain
- 4.3. PESTEL analysis
- 4.4. Market Entropy
- 4.5. Patent/Trademark Analysis
- 5. Global Renewable Energy Market in Zimbabwe Analysis, Insights and Forecast, 2019-2031
- 5.1. Market Analysis, Insights and Forecast - by Generation Source
- 5.1.1. Hydropower
- 5.1.2. Solar
- 5.1.3. Bioenergy
- 5.1.4. Other Generation Sources
- 5.2. Market Analysis, Insights and Forecast - by Region
- 5.2.1. North America
- 5.2.2. South America
- 5.2.3. Europe
- 5.2.4. Middle East & Africa
- 5.2.5. Asia Pacific
- 5.1. Market Analysis, Insights and Forecast - by Generation Source
- 6. North America Renewable Energy Market in Zimbabwe Analysis, Insights and Forecast, 2019-2031
- 6.1. Market Analysis, Insights and Forecast - by Generation Source
- 6.1.1. Hydropower
- 6.1.2. Solar
- 6.1.3. Bioenergy
- 6.1.4. Other Generation Sources
- 6.1. Market Analysis, Insights and Forecast - by Generation Source
- 7. South America Renewable Energy Market in Zimbabwe Analysis, Insights and Forecast, 2019-2031
- 7.1. Market Analysis, Insights and Forecast - by Generation Source
- 7.1.1. Hydropower
- 7.1.2. Solar
- 7.1.3. Bioenergy
- 7.1.4. Other Generation Sources
- 7.1. Market Analysis, Insights and Forecast - by Generation Source
- 8. Europe Renewable Energy Market in Zimbabwe Analysis, Insights and Forecast, 2019-2031
- 8.1. Market Analysis, Insights and Forecast - by Generation Source
- 8.1.1. Hydropower
- 8.1.2. Solar
- 8.1.3. Bioenergy
- 8.1.4. Other Generation Sources
- 8.1. Market Analysis, Insights and Forecast - by Generation Source
- 9. Middle East & Africa Renewable Energy Market in Zimbabwe Analysis, Insights and Forecast, 2019-2031
- 9.1. Market Analysis, Insights and Forecast - by Generation Source
- 9.1.1. Hydropower
- 9.1.2. Solar
- 9.1.3. Bioenergy
- 9.1.4. Other Generation Sources
- 9.1. Market Analysis, Insights and Forecast - by Generation Source
- 10. Asia Pacific Renewable Energy Market in Zimbabwe Analysis, Insights and Forecast, 2019-2031
- 10.1. Market Analysis, Insights and Forecast - by Generation Source
- 10.1.1. Hydropower
- 10.1.2. Solar
- 10.1.3. Bioenergy
- 10.1.4. Other Generation Sources
- 10.1. Market Analysis, Insights and Forecast - by Generation Source
- 11. Competitive Analysis
- 11.1. Global Market Share Analysis 2024
- 11.2. Company Profiles
- 11.2.1 Iskraemeco Group
- 11.2.1.1. Overview
- 11.2.1.2. Products
- 11.2.1.3. SWOT Analysis
- 11.2.1.4. Recent Developments
- 11.2.1.5. Financials (Based on Availability)
- 11.2.2 Zimbabwe Power Company
- 11.2.2.1. Overview
- 11.2.2.2. Products
- 11.2.2.3. SWOT Analysis
- 11.2.2.4. Recent Developments
- 11.2.2.5. Financials (Based on Availability)
- 11.2.3 Nyangani Renewable Energy (Pvt) Ltd
- 11.2.3.1. Overview
- 11.2.3.2. Products
- 11.2.3.3. SWOT Analysis
- 11.2.3.4. Recent Developments
- 11.2.3.5. Financials (Based on Availability)
- 11.2.4 Cool Solar Africa
- 11.2.4.1. Overview
- 11.2.4.2. Products
- 11.2.4.3. SWOT Analysis
- 11.2.4.4. Recent Developments
- 11.2.4.5. Financials (Based on Availability)
- 11.2.5 Global Solar (Pvt) Ltd
- 11.2.5.1. Overview
- 11.2.5.2. Products
- 11.2.5.3. SWOT Analysis
- 11.2.5.4. Recent Developments
- 11.2.5.5. Financials (Based on Availability)
- 11.2.1 Iskraemeco Group
List of Figures
- Figure 1: Global Renewable Energy Market in Zimbabwe Revenue Breakdown (Million, %) by Region 2024 & 2032
- Figure 2: Global Renewable Energy Market in Zimbabwe Volume Breakdown (Gigawatt, %) by Region 2024 & 2032
- Figure 3: Zimbabwe Renewable Energy Market in Zimbabwe Revenue (Million), by Country 2024 & 2032
- Figure 4: Zimbabwe Renewable Energy Market in Zimbabwe Volume (Gigawatt), by Country 2024 & 2032
- Figure 5: Zimbabwe Renewable Energy Market in Zimbabwe Revenue Share (%), by Country 2024 & 2032
- Figure 6: Zimbabwe Renewable Energy Market in Zimbabwe Volume Share (%), by Country 2024 & 2032
- Figure 7: North America Renewable Energy Market in Zimbabwe Revenue (Million), by Generation Source 2024 & 2032
- Figure 8: North America Renewable Energy Market in Zimbabwe Volume (Gigawatt), by Generation Source 2024 & 2032
- Figure 9: North America Renewable Energy Market in Zimbabwe Revenue Share (%), by Generation Source 2024 & 2032
- Figure 10: North America Renewable Energy Market in Zimbabwe Volume Share (%), by Generation Source 2024 & 2032
- Figure 11: North America Renewable Energy Market in Zimbabwe Revenue (Million), by Country 2024 & 2032
- Figure 12: North America Renewable Energy Market in Zimbabwe Volume (Gigawatt), by Country 2024 & 2032
- Figure 13: North America Renewable Energy Market in Zimbabwe Revenue Share (%), by Country 2024 & 2032
- Figure 14: North America Renewable Energy Market in Zimbabwe Volume Share (%), by Country 2024 & 2032
- Figure 15: South America Renewable Energy Market in Zimbabwe Revenue (Million), by Generation Source 2024 & 2032
- Figure 16: South America Renewable Energy Market in Zimbabwe Volume (Gigawatt), by Generation Source 2024 & 2032
- Figure 17: South America Renewable Energy Market in Zimbabwe Revenue Share (%), by Generation Source 2024 & 2032
- Figure 18: South America Renewable Energy Market in Zimbabwe Volume Share (%), by Generation Source 2024 & 2032
- Figure 19: South America Renewable Energy Market in Zimbabwe Revenue (Million), by Country 2024 & 2032
- Figure 20: South America Renewable Energy Market in Zimbabwe Volume (Gigawatt), by Country 2024 & 2032
- Figure 21: South America Renewable Energy Market in Zimbabwe Revenue Share (%), by Country 2024 & 2032
- Figure 22: South America Renewable Energy Market in Zimbabwe Volume Share (%), by Country 2024 & 2032
- Figure 23: Europe Renewable Energy Market in Zimbabwe Revenue (Million), by Generation Source 2024 & 2032
- Figure 24: Europe Renewable Energy Market in Zimbabwe Volume (Gigawatt), by Generation Source 2024 & 2032
- Figure 25: Europe Renewable Energy Market in Zimbabwe Revenue Share (%), by Generation Source 2024 & 2032
- Figure 26: Europe Renewable Energy Market in Zimbabwe Volume Share (%), by Generation Source 2024 & 2032
- Figure 27: Europe Renewable Energy Market in Zimbabwe Revenue (Million), by Country 2024 & 2032
- Figure 28: Europe Renewable Energy Market in Zimbabwe Volume (Gigawatt), by Country 2024 & 2032
- Figure 29: Europe Renewable Energy Market in Zimbabwe Revenue Share (%), by Country 2024 & 2032
- Figure 30: Europe Renewable Energy Market in Zimbabwe Volume Share (%), by Country 2024 & 2032
- Figure 31: Middle East & Africa Renewable Energy Market in Zimbabwe Revenue (Million), by Generation Source 2024 & 2032
- Figure 32: Middle East & Africa Renewable Energy Market in Zimbabwe Volume (Gigawatt), by Generation Source 2024 & 2032
- Figure 33: Middle East & Africa Renewable Energy Market in Zimbabwe Revenue Share (%), by Generation Source 2024 & 2032
- Figure 34: Middle East & Africa Renewable Energy Market in Zimbabwe Volume Share (%), by Generation Source 2024 & 2032
- Figure 35: Middle East & Africa Renewable Energy Market in Zimbabwe Revenue (Million), by Country 2024 & 2032
- Figure 36: Middle East & Africa Renewable Energy Market in Zimbabwe Volume (Gigawatt), by Country 2024 & 2032
- Figure 37: Middle East & Africa Renewable Energy Market in Zimbabwe Revenue Share (%), by Country 2024 & 2032
- Figure 38: Middle East & Africa Renewable Energy Market in Zimbabwe Volume Share (%), by Country 2024 & 2032
- Figure 39: Asia Pacific Renewable Energy Market in Zimbabwe Revenue (Million), by Generation Source 2024 & 2032
- Figure 40: Asia Pacific Renewable Energy Market in Zimbabwe Volume (Gigawatt), by Generation Source 2024 & 2032
- Figure 41: Asia Pacific Renewable Energy Market in Zimbabwe Revenue Share (%), by Generation Source 2024 & 2032
- Figure 42: Asia Pacific Renewable Energy Market in Zimbabwe Volume Share (%), by Generation Source 2024 & 2032
- Figure 43: Asia Pacific Renewable Energy Market in Zimbabwe Revenue (Million), by Country 2024 & 2032
- Figure 44: Asia Pacific Renewable Energy Market in Zimbabwe Volume (Gigawatt), by Country 2024 & 2032
- Figure 45: Asia Pacific Renewable Energy Market in Zimbabwe Revenue Share (%), by Country 2024 & 2032
- Figure 46: Asia Pacific Renewable Energy Market in Zimbabwe Volume Share (%), by Country 2024 & 2032
List of Tables
- Table 1: Global Renewable Energy Market in Zimbabwe Revenue Million Forecast, by Region 2019 & 2032
- Table 2: Global Renewable Energy Market in Zimbabwe Volume Gigawatt Forecast, by Region 2019 & 2032
- Table 3: Global Renewable Energy Market in Zimbabwe Revenue Million Forecast, by Generation Source 2019 & 2032
- Table 4: Global Renewable Energy Market in Zimbabwe Volume Gigawatt Forecast, by Generation Source 2019 & 2032
- Table 5: Global Renewable Energy Market in Zimbabwe Revenue Million Forecast, by Region 2019 & 2032
- Table 6: Global Renewable Energy Market in Zimbabwe Volume Gigawatt Forecast, by Region 2019 & 2032
- Table 7: Global Renewable Energy Market in Zimbabwe Revenue Million Forecast, by Country 2019 & 2032
- Table 8: Global Renewable Energy Market in Zimbabwe Volume Gigawatt Forecast, by Country 2019 & 2032
- Table 9: Global Renewable Energy Market in Zimbabwe Revenue Million Forecast, by Generation Source 2019 & 2032
- Table 10: Global Renewable Energy Market in Zimbabwe Volume Gigawatt Forecast, by Generation Source 2019 & 2032
- Table 11: Global Renewable Energy Market in Zimbabwe Revenue Million Forecast, by Country 2019 & 2032
- Table 12: Global Renewable Energy Market in Zimbabwe Volume Gigawatt Forecast, by Country 2019 & 2032
- Table 13: United States Renewable Energy Market in Zimbabwe Revenue (Million) Forecast, by Application 2019 & 2032
- Table 14: United States Renewable Energy Market in Zimbabwe Volume (Gigawatt) Forecast, by Application 2019 & 2032
- Table 15: Canada Renewable Energy Market in Zimbabwe Revenue (Million) Forecast, by Application 2019 & 2032
- Table 16: Canada Renewable Energy Market in Zimbabwe Volume (Gigawatt) Forecast, by Application 2019 & 2032
- Table 17: Mexico Renewable Energy Market in Zimbabwe Revenue (Million) Forecast, by Application 2019 & 2032
- Table 18: Mexico Renewable Energy Market in Zimbabwe Volume (Gigawatt) Forecast, by Application 2019 & 2032
- Table 19: Global Renewable Energy Market in Zimbabwe Revenue Million Forecast, by Generation Source 2019 & 2032
- Table 20: Global Renewable Energy Market in Zimbabwe Volume Gigawatt Forecast, by Generation Source 2019 & 2032
- Table 21: Global Renewable Energy Market in Zimbabwe Revenue Million Forecast, by Country 2019 & 2032
- Table 22: Global Renewable Energy Market in Zimbabwe Volume Gigawatt Forecast, by Country 2019 & 2032
- Table 23: Brazil Renewable Energy Market in Zimbabwe Revenue (Million) Forecast, by Application 2019 & 2032
- Table 24: Brazil Renewable Energy Market in Zimbabwe Volume (Gigawatt) Forecast, by Application 2019 & 2032
- Table 25: Argentina Renewable Energy Market in Zimbabwe Revenue (Million) Forecast, by Application 2019 & 2032
- Table 26: Argentina Renewable Energy Market in Zimbabwe Volume (Gigawatt) Forecast, by Application 2019 & 2032
- Table 27: Rest of South America Renewable Energy Market in Zimbabwe Revenue (Million) Forecast, by Application 2019 & 2032
- Table 28: Rest of South America Renewable Energy Market in Zimbabwe Volume (Gigawatt) Forecast, by Application 2019 & 2032
- Table 29: Global Renewable Energy Market in Zimbabwe Revenue Million Forecast, by Generation Source 2019 & 2032
- Table 30: Global Renewable Energy Market in Zimbabwe Volume Gigawatt Forecast, by Generation Source 2019 & 2032
- Table 31: Global Renewable Energy Market in Zimbabwe Revenue Million Forecast, by Country 2019 & 2032
- Table 32: Global Renewable Energy Market in Zimbabwe Volume Gigawatt Forecast, by Country 2019 & 2032
- Table 33: United Kingdom Renewable Energy Market in Zimbabwe Revenue (Million) Forecast, by Application 2019 & 2032
- Table 34: United Kingdom Renewable Energy Market in Zimbabwe Volume (Gigawatt) Forecast, by Application 2019 & 2032
- Table 35: Germany Renewable Energy Market in Zimbabwe Revenue (Million) Forecast, by Application 2019 & 2032
- Table 36: Germany Renewable Energy Market in Zimbabwe Volume (Gigawatt) Forecast, by Application 2019 & 2032
- Table 37: France Renewable Energy Market in Zimbabwe Revenue (Million) Forecast, by Application 2019 & 2032
- Table 38: France Renewable Energy Market in Zimbabwe Volume (Gigawatt) Forecast, by Application 2019 & 2032
- Table 39: Italy Renewable Energy Market in Zimbabwe Revenue (Million) Forecast, by Application 2019 & 2032
- Table 40: Italy Renewable Energy Market in Zimbabwe Volume (Gigawatt) Forecast, by Application 2019 & 2032
- Table 41: Spain Renewable Energy Market in Zimbabwe Revenue (Million) Forecast, by Application 2019 & 2032
- Table 42: Spain Renewable Energy Market in Zimbabwe Volume (Gigawatt) Forecast, by Application 2019 & 2032
- Table 43: Russia Renewable Energy Market in Zimbabwe Revenue (Million) Forecast, by Application 2019 & 2032
- Table 44: Russia Renewable Energy Market in Zimbabwe Volume (Gigawatt) Forecast, by Application 2019 & 2032
- Table 45: Benelux Renewable Energy Market in Zimbabwe Revenue (Million) Forecast, by Application 2019 & 2032
- Table 46: Benelux Renewable Energy Market in Zimbabwe Volume (Gigawatt) Forecast, by Application 2019 & 2032
- Table 47: Nordics Renewable Energy Market in Zimbabwe Revenue (Million) Forecast, by Application 2019 & 2032
- Table 48: Nordics Renewable Energy Market in Zimbabwe Volume (Gigawatt) Forecast, by Application 2019 & 2032
- Table 49: Rest of Europe Renewable Energy Market in Zimbabwe Revenue (Million) Forecast, by Application 2019 & 2032
- Table 50: Rest of Europe Renewable Energy Market in Zimbabwe Volume (Gigawatt) Forecast, by Application 2019 & 2032
- Table 51: Global Renewable Energy Market in Zimbabwe Revenue Million Forecast, by Generation Source 2019 & 2032
- Table 52: Global Renewable Energy Market in Zimbabwe Volume Gigawatt Forecast, by Generation Source 2019 & 2032
- Table 53: Global Renewable Energy Market in Zimbabwe Revenue Million Forecast, by Country 2019 & 2032
- Table 54: Global Renewable Energy Market in Zimbabwe Volume Gigawatt Forecast, by Country 2019 & 2032
- Table 55: Turkey Renewable Energy Market in Zimbabwe Revenue (Million) Forecast, by Application 2019 & 2032
- Table 56: Turkey Renewable Energy Market in Zimbabwe Volume (Gigawatt) Forecast, by Application 2019 & 2032
- Table 57: Israel Renewable Energy Market in Zimbabwe Revenue (Million) Forecast, by Application 2019 & 2032
- Table 58: Israel Renewable Energy Market in Zimbabwe Volume (Gigawatt) Forecast, by Application 2019 & 2032
- Table 59: GCC Renewable Energy Market in Zimbabwe Revenue (Million) Forecast, by Application 2019 & 2032
- Table 60: GCC Renewable Energy Market in Zimbabwe Volume (Gigawatt) Forecast, by Application 2019 & 2032
- Table 61: North Africa Renewable Energy Market in Zimbabwe Revenue (Million) Forecast, by Application 2019 & 2032
- Table 62: North Africa Renewable Energy Market in Zimbabwe Volume (Gigawatt) Forecast, by Application 2019 & 2032
- Table 63: South Africa Renewable Energy Market in Zimbabwe Revenue (Million) Forecast, by Application 2019 & 2032
- Table 64: South Africa Renewable Energy Market in Zimbabwe Volume (Gigawatt) Forecast, by Application 2019 & 2032
- Table 65: Rest of Middle East & Africa Renewable Energy Market in Zimbabwe Revenue (Million) Forecast, by Application 2019 & 2032
- Table 66: Rest of Middle East & Africa Renewable Energy Market in Zimbabwe Volume (Gigawatt) Forecast, by Application 2019 & 2032
- Table 67: Global Renewable Energy Market in Zimbabwe Revenue Million Forecast, by Generation Source 2019 & 2032
- Table 68: Global Renewable Energy Market in Zimbabwe Volume Gigawatt Forecast, by Generation Source 2019 & 2032
- Table 69: Global Renewable Energy Market in Zimbabwe Revenue Million Forecast, by Country 2019 & 2032
- Table 70: Global Renewable Energy Market in Zimbabwe Volume Gigawatt Forecast, by Country 2019 & 2032
- Table 71: China Renewable Energy Market in Zimbabwe Revenue (Million) Forecast, by Application 2019 & 2032
- Table 72: China Renewable Energy Market in Zimbabwe Volume (Gigawatt) Forecast, by Application 2019 & 2032
- Table 73: India Renewable Energy Market in Zimbabwe Revenue (Million) Forecast, by Application 2019 & 2032
- Table 74: India Renewable Energy Market in Zimbabwe Volume (Gigawatt) Forecast, by Application 2019 & 2032
- Table 75: Japan Renewable Energy Market in Zimbabwe Revenue (Million) Forecast, by Application 2019 & 2032
- Table 76: Japan Renewable Energy Market in Zimbabwe Volume (Gigawatt) Forecast, by Application 2019 & 2032
- Table 77: South Korea Renewable Energy Market in Zimbabwe Revenue (Million) Forecast, by Application 2019 & 2032
- Table 78: South Korea Renewable Energy Market in Zimbabwe Volume (Gigawatt) Forecast, by Application 2019 & 2032
- Table 79: ASEAN Renewable Energy Market in Zimbabwe Revenue (Million) Forecast, by Application 2019 & 2032
- Table 80: ASEAN Renewable Energy Market in Zimbabwe Volume (Gigawatt) Forecast, by Application 2019 & 2032
- Table 81: Oceania Renewable Energy Market in Zimbabwe Revenue (Million) Forecast, by Application 2019 & 2032
- Table 82: Oceania Renewable Energy Market in Zimbabwe Volume (Gigawatt) Forecast, by Application 2019 & 2032
- Table 83: Rest of Asia Pacific Renewable Energy Market in Zimbabwe Revenue (Million) Forecast, by Application 2019 & 2032
- Table 84: Rest of Asia Pacific Renewable Energy Market in Zimbabwe Volume (Gigawatt) Forecast, by Application 2019 & 2032
Frequently Asked Questions
1. What is the projected Compound Annual Growth Rate (CAGR) of the Renewable Energy Market in Zimbabwe?
The projected CAGR is approximately > 3.00%.
2. Which companies are prominent players in the Renewable Energy Market in Zimbabwe?
Key companies in the market include Iskraemeco Group, Zimbabwe Power Company, Nyangani Renewable Energy (Pvt) Ltd, Cool Solar Africa, Global Solar (Pvt) Ltd.
3. What are the main segments of the Renewable Energy Market in Zimbabwe?
The market segments include Generation Source.
4. Can you provide details about the market size?
The market size is estimated to be USD XX Million as of 2022.
5. What are some drivers contributing to market growth?
4.; Increasing Demand for Coal Based Power Generation Sector4.; Ease of Availability of Coal for Various Sectors. Such as Transport. Residential. Commercial and Others.
6. What are the notable trends driving market growth?
Hydropower Source to Witness Significant Growth.
7. Are there any restraints impacting market growth?
4.; Increasing Adoption of Renewable Energy.
8. Can you provide examples of recent developments in the market?
In December 2022, Zimbabwe announced a government implementation agreement (GIA) to expedite the commissioning of 27 solar IPP installations. The 1 GW of projects range from 5 MW arrays to 100 MW solar parks and will cost about USD 1 billion in total.
9. What pricing options are available for accessing the report?
Pricing options include single-user, multi-user, and enterprise licenses priced at USD 3800, USD 4500, and USD 5800 respectively.
10. Is the market size provided in terms of value or volume?
The market size is provided in terms of value, measured in Million and volume, measured in Gigawatt.
11. Are there any specific market keywords associated with the report?
Yes, the market keyword associated with the report is "Renewable Energy Market in Zimbabwe," which aids in identifying and referencing the specific market segment covered.
12. How do I determine which pricing option suits my needs best?
The pricing options vary based on user requirements and access needs. Individual users may opt for single-user licenses, while businesses requiring broader access may choose multi-user or enterprise licenses for cost-effective access to the report.
13. Are there any additional resources or data provided in the Renewable Energy Market in Zimbabwe report?
While the report offers comprehensive insights, it's advisable to review the specific contents or supplementary materials provided to ascertain if additional resources or data are available.
14. How can I stay updated on further developments or reports in the Renewable Energy Market in Zimbabwe?
To stay informed about further developments, trends, and reports in the Renewable Energy Market in Zimbabwe, consider subscribing to industry newsletters, following relevant companies and organizations, or regularly checking reputable industry news sources and publications.
Methodology
Step 1 - Identification of Relevant Samples Size from Population Database


Step 2 - Approaches for Defining Global Market Size (Value, Volume* & Price*)

Note*: In applicable scenarios
Step 3 - Data Sources
Primary Research
- Web Analytics
- Survey Reports
- Research Institute
- Latest Research Reports
- Opinion Leaders
Secondary Research
- Annual Reports
- White Paper
- Latest Press Release
- Industry Association
- Paid Database
- Investor Presentations

Step 4 - Data Triangulation
Involves using different sources of information in order to increase the validity of a study
These sources are likely to be stakeholders in a program - participants, other researchers, program staff, other community members, and so on.
Then we put all data in single framework & apply various statistical tools to find out the dynamic on the market.
During the analysis stage, feedback from the stakeholder groups would be compared to determine areas of agreement as well as areas of divergence


