
Key Insights
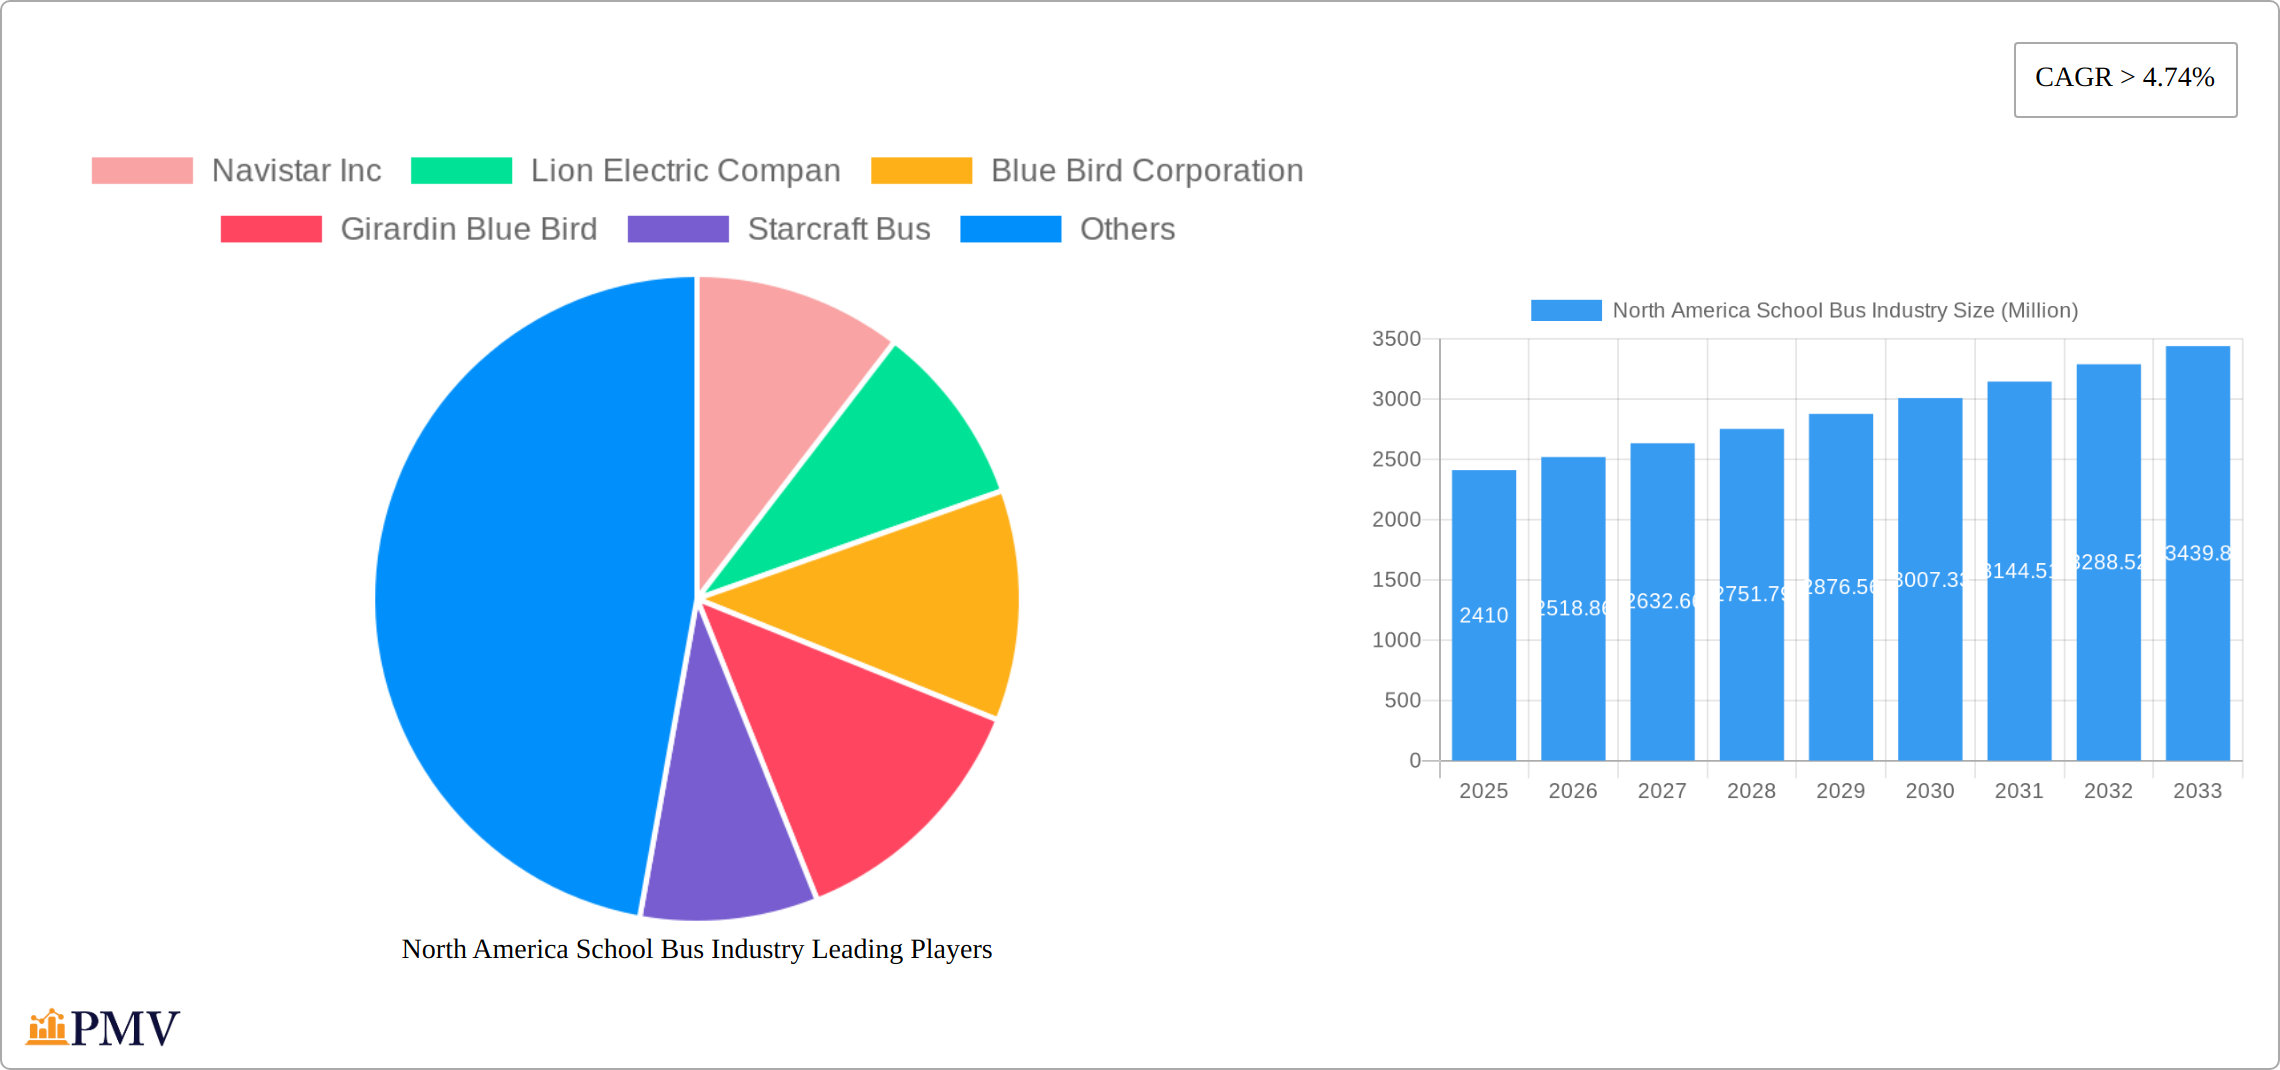
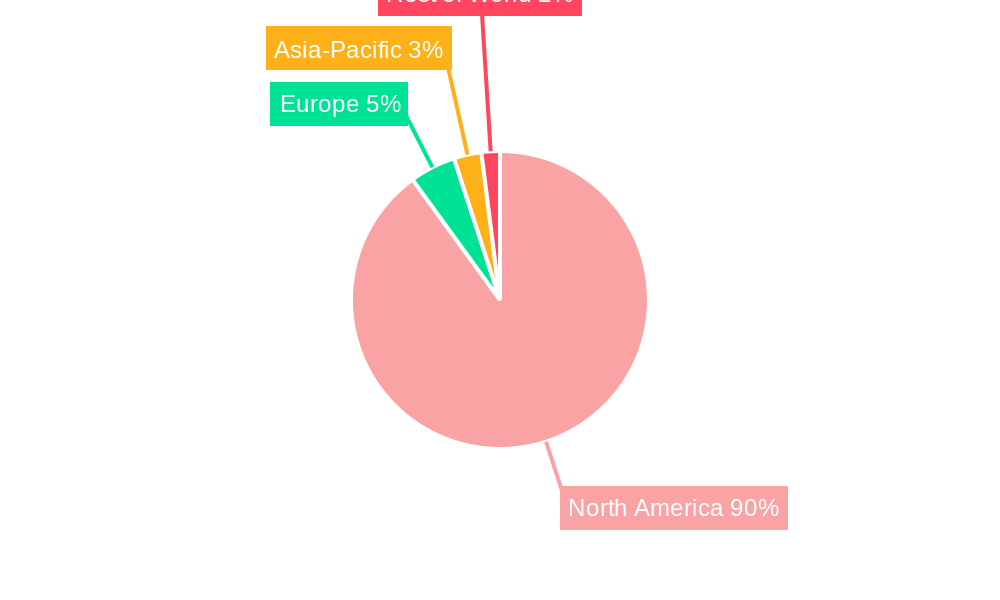
The North American school bus industry, valued at $2.41 billion in 2025, is projected to experience robust growth, driven by increasing student enrollment, aging fleet replacements, and the rising adoption of electric school buses to meet environmental regulations and reduce operational costs. The market's Compound Annual Growth Rate (CAGR) exceeding 4.74% from 2025 to 2033 signifies a significant expansion opportunity. Key market segments include powertrain technologies (internal combustion engines and electric vehicles), and bus types (Type C, Type D, and other specialized buses). While the dominance of traditional IC engine buses is expected to continue in the near term, the electric segment is poised for rapid growth fueled by government incentives, decreasing battery costs, and environmental concerns. The shift toward electrification is likely to reshape the competitive landscape, presenting both challenges and opportunities for established players like Navistar Inc., Lion Electric Co., and Blue Bird Corporation, as well as new entrants specializing in electric vehicle technology. Regional analysis indicates that the United States will continue to dominate the market, followed by Canada and Mexico. The growth, however, is expected to be influenced by factors such as fluctuating fuel prices, economic conditions, and evolving safety regulations. Furthermore, supply chain disruptions and the availability of skilled labor remain potential restraints on market growth.
The forecast period (2025-2033) will witness considerable investment in technological advancements, including autonomous driving features and improved safety systems. The industry is also expected to face increasing pressure to enhance fuel efficiency and reduce emissions. This will likely lead to innovations in alternative fuels and battery technology. Growth will vary by region, with areas experiencing higher population growth and school infrastructure development likely demonstrating faster market expansion. Competition among manufacturers will intensify, particularly in the electric school bus segment, driving innovation and potentially leading to price reductions and improved product offerings. The continued focus on safety standards and regulatory compliance will also shape the trajectory of the market.
North America School Bus Industry Market Report: 2019-2033
This comprehensive report provides an in-depth analysis of the North America school bus industry, offering valuable insights for stakeholders, investors, and industry professionals. Covering the period from 2019 to 2033, with a base year of 2025, this report details market trends, competitive dynamics, and future growth projections for the school bus sector. Key segments such as powertrain (IC Engine, Electric), bus type (Type C, Type D, Other), and leading companies like Blue Bird Corporation, Lion Electric Company, and Thomas Built Buses are meticulously examined.
North America School Bus Industry Market Structure & Competitive Dynamics
The North American school bus industry is characterized by a moderately consolidated market structure, with a few major players holding significant market share. The industry’s competitive landscape is dynamic, driven by technological advancements, particularly in electric vehicle (EV) technology, and increasing regulatory pressure to adopt cleaner transportation solutions. Innovation ecosystems are evolving, with collaborations between established manufacturers and technology providers becoming increasingly common. The regulatory framework is a key influencer, impacting fuel efficiency standards, emission regulations, and safety requirements. Substitute products are limited, primarily encompassing alternative transportation solutions for students, which present niche challenges rather than widespread competition. End-user trends reflect a growing preference for safety, fuel efficiency, and environmentally friendly options. Mergers and acquisitions (M&A) activity has been notable, with strategic partnerships aimed at expanding production capacity and accelerating the adoption of electric school buses.
- Market Concentration: The top five players account for approximately xx% of the total market share (2025).
- M&A Activity: The total value of M&A deals in the sector between 2019 and 2024 was approximately $xx Million. Notable deals include Lion Electric's acquisition of a provisional order for 50 LionC buses (November 2023).
- Innovation: Key areas of innovation include the development of electric school buses, advanced safety features, and improved fuel efficiency technologies.
North America School Bus Industry Industry Trends & Insights
The North American school bus industry is undergoing a dramatic transformation, primarily fueled by the rapid adoption of electric vehicles (EVs). This shift is driven by a confluence of factors: escalating environmental concerns, substantial government incentives promoting zero-emission vehicles, and the steadily decreasing cost of electric powertrains. The market is witnessing a significant surge in electric school bus adoption, marked by accelerating market penetration and a robust Compound Annual Growth Rate (CAGR) for the electric segment. Consumer demand increasingly prioritizes safety, environmental responsibility, and technologically advanced features. The competitive landscape is fiercely contested, with manufacturers vying to develop and deploy cutting-edge electric school bus technologies and establish highly efficient manufacturing processes. Industry consolidation is also underway, driven by strategic partnerships and acquisitions aimed at scaling production and accelerating market penetration.
- Market Growth Drivers: Stringent government regulations favoring electric vehicles, heightened environmental awareness, continuous technological advancements, and increased funding allocated to modernizing school transportation infrastructure.
- CAGR: The overall market is projected to exhibit a CAGR of [Insert Projected CAGR]% from 2025 to 2033, with the electric segment experiencing a significantly higher CAGR of [Insert Projected CAGR for Electric Segment]%.
- Market Penetration: Electric school buses are anticipated to achieve a market penetration rate of [Insert Projected Market Penetration]% by 2033.
Dominant Markets & Segments in North America School Bus Industry
The largest segment within the North America school bus industry is currently the Type C bus segment, followed by Type D. The dominance of Type C buses is attributed to their suitability for a wide range of applications and their flexibility. Type D buses are often preferred for their larger capacity, ideal for transporting larger student populations. The electric powertrain segment is experiencing rapid growth and is expected to become a leading segment in the coming years, driven by strong government support, environmental concerns, and decreasing battery costs.
Key Drivers:
- Type C Bus Segment: High demand from school districts with diverse transportation needs, versatility, and cost-effectiveness.
- Type D Bus Segment: Requirement for larger student capacity, particularly in rural areas and for specialized transportation.
- Electric Powertrain Segment: Government incentives, environmental regulations, falling battery costs, and advancements in charging infrastructure.
- Geographic Dominance: The most dominant regions include densely populated states such as California, Texas, and Florida, characterized by large school districts and significant funding for school transportation.
North America School Bus Industry Product Innovations
The North America school bus industry is witnessing continuous product innovation, particularly in the powertrain segment. Manufacturers are focusing on developing electric buses with longer ranges, faster charging times, and improved battery technology. Advanced safety features, including improved driver-assistance systems and enhanced passenger safety measures, are also gaining prominence. The market is witnessing increased focus on lightweighting of bus bodies, alongside innovations in telematics and data-driven maintenance strategies for enhanced operational efficiency. These innovations are enhancing the market appeal of school buses by fulfilling both regulatory compliance needs and demands for operational efficiency improvements.
Report Segmentation & Scope
This report provides a comprehensive segmentation of the North American school bus market based on two key criteria: powertrain type (Internal Combustion Engine (ICE), Electric) and bus type (Type C, Type D, Other).
Powertrain:
- ICE Engine: This segment is projected to experience a decline in market share due to increasingly stringent emission regulations. However, it will continue to represent a substantial portion of the market throughout the forecast period. Growth is projected at a CAGR of [Insert Projected CAGR]%. The focus will shift towards more fuel-efficient and cleaner-burning ICE engines in the near term.
- Electric: This dynamic segment is characterized by exceptionally rapid growth, fueled by government incentives and the growing emphasis on environmental sustainability. Growth is projected at a CAGR of [Insert Projected CAGR]%.
Bus Type:
- Type C: This segment remains the largest, owing to its versatility and suitability for a broad range of applications. The estimated market size in 2025 is $ [Insert Market Size] Million.
- Type D: This segment holds significant importance due to its higher passenger capacity, making it crucial for larger school districts. The estimated market size in 2025 is $ [Insert Market Size] Million.
- Other: This category encompasses specialized buses such as activity buses, catering to niche requirements and smaller market segments. The estimated market size in 2025 is $ [Insert Market Size] Million.
Key Drivers of North America School Bus Industry Growth
The expansion of the North American school bus industry is propelled by several key factors. Government mandates promoting cleaner transportation are significantly accelerating the adoption of electric buses. Increased investment in school transportation infrastructure projects is fueling demand. Technological innovations, encompassing advancements in battery technology and charging infrastructure, are making electric buses increasingly practical and cost-effective. Finally, the growing societal concern for environmental sustainability is influencing school districts to prioritize zero-emission transportation solutions.
Challenges in the North America School Bus Industry Sector
The industry faces considerable challenges, including the high upfront cost of electric buses, concerns regarding the availability and accessibility of charging infrastructure, the complexities of integrating electric buses into existing fleets, and the potential for supply chain disruptions impacting component availability. These factors can significantly impact market growth and profitability. Furthermore, navigating the diverse and evolving regulatory landscapes across different states presents considerable operational complexities for industry players.
Leading Players in the North America School Bus Industry Market
- Navistar Inc
- Lion Electric Company
- Blue Bird Corporation
- Girardin Blue Bird
- Starcraft Bus
- Trans Tech
- Collins Bus Corporation
- Daimler AG (Thomas Built Buses)
Key Developments in North America School Bus Industry Sector
- October 2023: Blue Bird delivered its 1,500th electric school bus and inaugurated its EV Build-up Center in Georgia, aiming for 5,000 annual electric bus production. This significantly expands Blue Bird’s capacity and reinforces its commitment to zero-emission solutions.
- November 2023: Lion Electric secured a provisional purchase order for 50 LionC all-electric school buses from Highland Electric Fleets, highlighting increasing demand for electric school bus solutions.
- November 2022: Lion Electric commenced production of its zero-emission LionC school bus at its Illinois facility, marking a significant milestone in its expansion and production capabilities.
- October 2022: Thomas Built Buses delivered its 200th electric school bus, demonstrating continued momentum in the electric school bus sector and a commitment to large-scale fleet electrification.
- March 2022: Thomas Built Buses and Highland Electric Fleets expanded their partnership to reduce upfront costs for electric school bus adoption and accelerate market penetration.
Strategic North America School Bus Industry Market Outlook
The future of the North American school bus industry appears promising, driven by the sustained growth of the electric bus segment and ongoing investments in technological innovation. The market presents substantial opportunities for manufacturers, technology providers, and infrastructure developers. Strategic alliances and collaborative partnerships will be instrumental in accelerating the transition to zero-emission school transportation. Continued government support, coupled with breakthroughs in battery technology and charging infrastructure, will further stimulate market expansion. The overarching focus on safety, sustainability, and cost-effectiveness will continue to shape future product development and market dynamics.
North America School Bus Industry Segmentation
-
1. Powertrain
- 1.1. IC Engine
- 1.2. Electric
-
2. Bus Type
- 2.1. Type C
- 2.2. Type D
- 2.3. Other Types
-
3. Geography
- 3.1. United States
- 3.2. Canada
- 3.3. Rest of North America
North America School Bus Industry Segmentation By Geography
- 1. United States
- 2. Canada
- 3. Rest of North America
North America School Bus Industry REPORT HIGHLIGHTS
| Aspects | Details |
|---|---|
| Study Period | 2019-2033 |
| Base Year | 2024 |
| Estimated Year | 2025 |
| Forecast Period | 2025-2033 |
| Historical Period | 2019-2024 |
| Growth Rate | CAGR of > 4.74% from 2019-2033 |
| Segmentation |
|
Table of Contents
- 1. Introduction
- 1.1. Research Scope
- 1.2. Market Segmentation
- 1.3. Research Methodology
- 1.4. Definitions and Assumptions
- 2. Executive Summary
- 2.1. Introduction
- 3. Market Dynamics
- 3.1. Introduction
- 3.2. Market Drivers
- 3.2.1. Increasing Demand For Electric School Buses
- 3.3. Market Restrains
- 3.3.1. Uncertainty of The Global Pandemic
- 3.4. Market Trends
- 3.4.1. The Industry’s Shift Toward the Adoption of Electric School Buses
- 4. Market Factor Analysis
- 4.1. Porters Five Forces
- 4.2. Supply/Value Chain
- 4.3. PESTEL analysis
- 4.4. Market Entropy
- 4.5. Patent/Trademark Analysis
- 5. North America School Bus Industry Analysis, Insights and Forecast, 2019-2031
- 5.1. Market Analysis, Insights and Forecast - by Powertrain
- 5.1.1. IC Engine
- 5.1.2. Electric
- 5.2. Market Analysis, Insights and Forecast - by Bus Type
- 5.2.1. Type C
- 5.2.2. Type D
- 5.2.3. Other Types
- 5.3. Market Analysis, Insights and Forecast - by Geography
- 5.3.1. United States
- 5.3.2. Canada
- 5.3.3. Rest of North America
- 5.4. Market Analysis, Insights and Forecast - by Region
- 5.4.1. United States
- 5.4.2. Canada
- 5.4.3. Rest of North America
- 5.1. Market Analysis, Insights and Forecast - by Powertrain
- 6. United States North America School Bus Industry Analysis, Insights and Forecast, 2019-2031
- 6.1. Market Analysis, Insights and Forecast - by Powertrain
- 6.1.1. IC Engine
- 6.1.2. Electric
- 6.2. Market Analysis, Insights and Forecast - by Bus Type
- 6.2.1. Type C
- 6.2.2. Type D
- 6.2.3. Other Types
- 6.3. Market Analysis, Insights and Forecast - by Geography
- 6.3.1. United States
- 6.3.2. Canada
- 6.3.3. Rest of North America
- 6.1. Market Analysis, Insights and Forecast - by Powertrain
- 7. Canada North America School Bus Industry Analysis, Insights and Forecast, 2019-2031
- 7.1. Market Analysis, Insights and Forecast - by Powertrain
- 7.1.1. IC Engine
- 7.1.2. Electric
- 7.2. Market Analysis, Insights and Forecast - by Bus Type
- 7.2.1. Type C
- 7.2.2. Type D
- 7.2.3. Other Types
- 7.3. Market Analysis, Insights and Forecast - by Geography
- 7.3.1. United States
- 7.3.2. Canada
- 7.3.3. Rest of North America
- 7.1. Market Analysis, Insights and Forecast - by Powertrain
- 8. Rest of North America North America School Bus Industry Analysis, Insights and Forecast, 2019-2031
- 8.1. Market Analysis, Insights and Forecast - by Powertrain
- 8.1.1. IC Engine
- 8.1.2. Electric
- 8.2. Market Analysis, Insights and Forecast - by Bus Type
- 8.2.1. Type C
- 8.2.2. Type D
- 8.2.3. Other Types
- 8.3. Market Analysis, Insights and Forecast - by Geography
- 8.3.1. United States
- 8.3.2. Canada
- 8.3.3. Rest of North America
- 8.1. Market Analysis, Insights and Forecast - by Powertrain
- 9. United States North America School Bus Industry Analysis, Insights and Forecast, 2019-2031
- 10. Canada North America School Bus Industry Analysis, Insights and Forecast, 2019-2031
- 11. Mexico North America School Bus Industry Analysis, Insights and Forecast, 2019-2031
- 12. Rest of North America North America School Bus Industry Analysis, Insights and Forecast, 2019-2031
- 13. Competitive Analysis
- 13.1. Market Share Analysis 2024
- 13.2. Company Profiles
- 13.2.1 Navistar Inc
- 13.2.1.1. Overview
- 13.2.1.2. Products
- 13.2.1.3. SWOT Analysis
- 13.2.1.4. Recent Developments
- 13.2.1.5. Financials (Based on Availability)
- 13.2.2 Lion Electric Compan
- 13.2.2.1. Overview
- 13.2.2.2. Products
- 13.2.2.3. SWOT Analysis
- 13.2.2.4. Recent Developments
- 13.2.2.5. Financials (Based on Availability)
- 13.2.3 Blue Bird Corporation
- 13.2.3.1. Overview
- 13.2.3.2. Products
- 13.2.3.3. SWOT Analysis
- 13.2.3.4. Recent Developments
- 13.2.3.5. Financials (Based on Availability)
- 13.2.4 Girardin Blue Bird
- 13.2.4.1. Overview
- 13.2.4.2. Products
- 13.2.4.3. SWOT Analysis
- 13.2.4.4. Recent Developments
- 13.2.4.5. Financials (Based on Availability)
- 13.2.5 Starcraft Bus
- 13.2.5.1. Overview
- 13.2.5.2. Products
- 13.2.5.3. SWOT Analysis
- 13.2.5.4. Recent Developments
- 13.2.5.5. Financials (Based on Availability)
- 13.2.6 Trans Tech
- 13.2.6.1. Overview
- 13.2.6.2. Products
- 13.2.6.3. SWOT Analysis
- 13.2.6.4. Recent Developments
- 13.2.6.5. Financials (Based on Availability)
- 13.2.7 Collins Bus Corporation
- 13.2.7.1. Overview
- 13.2.7.2. Products
- 13.2.7.3. SWOT Analysis
- 13.2.7.4. Recent Developments
- 13.2.7.5. Financials (Based on Availability)
- 13.2.8 Daimler AG (Thomas Built Buses)
- 13.2.8.1. Overview
- 13.2.8.2. Products
- 13.2.8.3. SWOT Analysis
- 13.2.8.4. Recent Developments
- 13.2.8.5. Financials (Based on Availability)
- 13.2.1 Navistar Inc
List of Figures
- Figure 1: North America School Bus Industry Revenue Breakdown (Million, %) by Product 2024 & 2032
- Figure 2: North America School Bus Industry Share (%) by Company 2024
List of Tables
- Table 1: North America School Bus Industry Revenue Million Forecast, by Region 2019 & 2032
- Table 2: North America School Bus Industry Revenue Million Forecast, by Powertrain 2019 & 2032
- Table 3: North America School Bus Industry Revenue Million Forecast, by Bus Type 2019 & 2032
- Table 4: North America School Bus Industry Revenue Million Forecast, by Geography 2019 & 2032
- Table 5: North America School Bus Industry Revenue Million Forecast, by Region 2019 & 2032
- Table 6: North America School Bus Industry Revenue Million Forecast, by Country 2019 & 2032
- Table 7: United States North America School Bus Industry Revenue (Million) Forecast, by Application 2019 & 2032
- Table 8: Canada North America School Bus Industry Revenue (Million) Forecast, by Application 2019 & 2032
- Table 9: Mexico North America School Bus Industry Revenue (Million) Forecast, by Application 2019 & 2032
- Table 10: Rest of North America North America School Bus Industry Revenue (Million) Forecast, by Application 2019 & 2032
- Table 11: North America School Bus Industry Revenue Million Forecast, by Powertrain 2019 & 2032
- Table 12: North America School Bus Industry Revenue Million Forecast, by Bus Type 2019 & 2032
- Table 13: North America School Bus Industry Revenue Million Forecast, by Geography 2019 & 2032
- Table 14: North America School Bus Industry Revenue Million Forecast, by Country 2019 & 2032
- Table 15: North America School Bus Industry Revenue Million Forecast, by Powertrain 2019 & 2032
- Table 16: North America School Bus Industry Revenue Million Forecast, by Bus Type 2019 & 2032
- Table 17: North America School Bus Industry Revenue Million Forecast, by Geography 2019 & 2032
- Table 18: North America School Bus Industry Revenue Million Forecast, by Country 2019 & 2032
- Table 19: North America School Bus Industry Revenue Million Forecast, by Powertrain 2019 & 2032
- Table 20: North America School Bus Industry Revenue Million Forecast, by Bus Type 2019 & 2032
- Table 21: North America School Bus Industry Revenue Million Forecast, by Geography 2019 & 2032
- Table 22: North America School Bus Industry Revenue Million Forecast, by Country 2019 & 2032
Frequently Asked Questions
1. What is the projected Compound Annual Growth Rate (CAGR) of the North America School Bus Industry?
The projected CAGR is approximately > 4.74%.
2. Which companies are prominent players in the North America School Bus Industry?
Key companies in the market include Navistar Inc, Lion Electric Compan, Blue Bird Corporation, Girardin Blue Bird, Starcraft Bus, Trans Tech, Collins Bus Corporation, Daimler AG (Thomas Built Buses).
3. What are the main segments of the North America School Bus Industry?
The market segments include Powertrain, Bus Type, Geography.
4. Can you provide details about the market size?
The market size is estimated to be USD 2.41 Million as of 2022.
5. What are some drivers contributing to market growth?
Increasing Demand For Electric School Buses.
6. What are the notable trends driving market growth?
The Industry’s Shift Toward the Adoption of Electric School Buses.
7. Are there any restraints impacting market growth?
Uncertainty of The Global Pandemic.
8. Can you provide examples of recent developments in the market?
October 2023: Blue Bird achieved a milestone by delivering its 1,500th electric, zero-emission school bus to Modesto City Schools in California. Recently, the company marked the inauguration of its Electric Vehicle (EV) Build-up Center in Georgia, aiming to boost its long-term production capacity to 5,000 electric school buses annually. This expansion underscores Blue Bird's commitment to advancing zero-emission school buses.
9. What pricing options are available for accessing the report?
Pricing options include single-user, multi-user, and enterprise licenses priced at USD 4750, USD 5250, and USD 8750 respectively.
10. Is the market size provided in terms of value or volume?
The market size is provided in terms of value, measured in Million.
11. Are there any specific market keywords associated with the report?
Yes, the market keyword associated with the report is "North America School Bus Industry," which aids in identifying and referencing the specific market segment covered.
12. How do I determine which pricing option suits my needs best?
The pricing options vary based on user requirements and access needs. Individual users may opt for single-user licenses, while businesses requiring broader access may choose multi-user or enterprise licenses for cost-effective access to the report.
13. Are there any additional resources or data provided in the North America School Bus Industry report?
While the report offers comprehensive insights, it's advisable to review the specific contents or supplementary materials provided to ascertain if additional resources or data are available.
14. How can I stay updated on further developments or reports in the North America School Bus Industry?
To stay informed about further developments, trends, and reports in the North America School Bus Industry, consider subscribing to industry newsletters, following relevant companies and organizations, or regularly checking reputable industry news sources and publications.
Methodology
Step 1 - Identification of Relevant Samples Size from Population Database


Step 2 - Approaches for Defining Global Market Size (Value, Volume* & Price*)

Note*: In applicable scenarios
Step 3 - Data Sources
Primary Research
- Web Analytics
- Survey Reports
- Research Institute
- Latest Research Reports
- Opinion Leaders
Secondary Research
- Annual Reports
- White Paper
- Latest Press Release
- Industry Association
- Paid Database
- Investor Presentations

Step 4 - Data Triangulation
Involves using different sources of information in order to increase the validity of a study
These sources are likely to be stakeholders in a program - participants, other researchers, program staff, other community members, and so on.
Then we put all data in single framework & apply various statistical tools to find out the dynamic on the market.
During the analysis stage, feedback from the stakeholder groups would be compared to determine areas of agreement as well as areas of divergence


