

Key Insights
The global bus market is projected for significant expansion, forecast to reach $268.68 billion by 2025 and grow at a Compound Annual Growth Rate (CAGR) of 7% through 2033. Key growth drivers include accelerating urbanization, increasing demand for sustainable public transportation, and government mandates for emission reduction. The shift towards cleaner mobility is paramount, with hybrid and electric buses (BEVs, FCEVs, HEVs, PHEVs) representing key growth segments due to their reduced operational costs and environmental advantages. Investment in public transport infrastructure in developing economies and fleet modernization in mature markets further fuel this positive market trajectory. The competitive landscape is dynamic, featuring established automotive manufacturers and emerging EV players focused on innovation and strategic alliances.
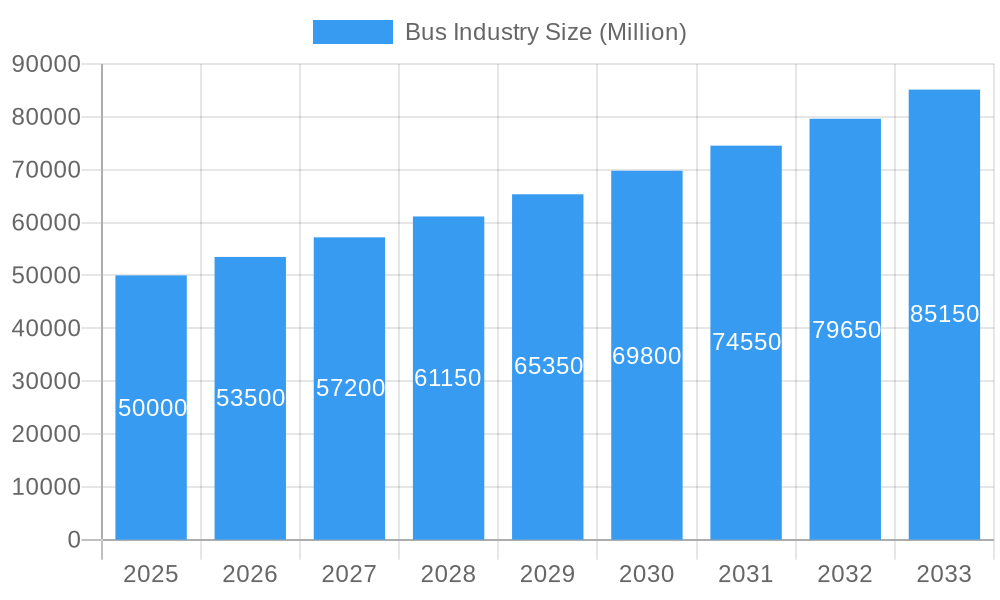
Bus Industry Market Size (In Billion)
Despite strong growth, the market faces challenges. High initial costs for electric and hybrid buses, alongside the necessity for extensive charging and refueling infrastructure, pose significant hurdles. Range anxiety and the availability of reliable charging solutions in varied geographies also demand ongoing attention. However, advancements in battery technology, government incentives, and smart charging solutions are actively addressing these concerns. The market is segmented by propulsion type and geography. Asia Pacific, led by China and India, is a volume leader due to large populations and public transport development. Europe and North America show substantial growth driven by emission reduction targets and consumer preference for sustainable transport. Leading companies such as BYD, Volvo Group, and Tata Motors are investing in R&D to meet evolving industry demands.
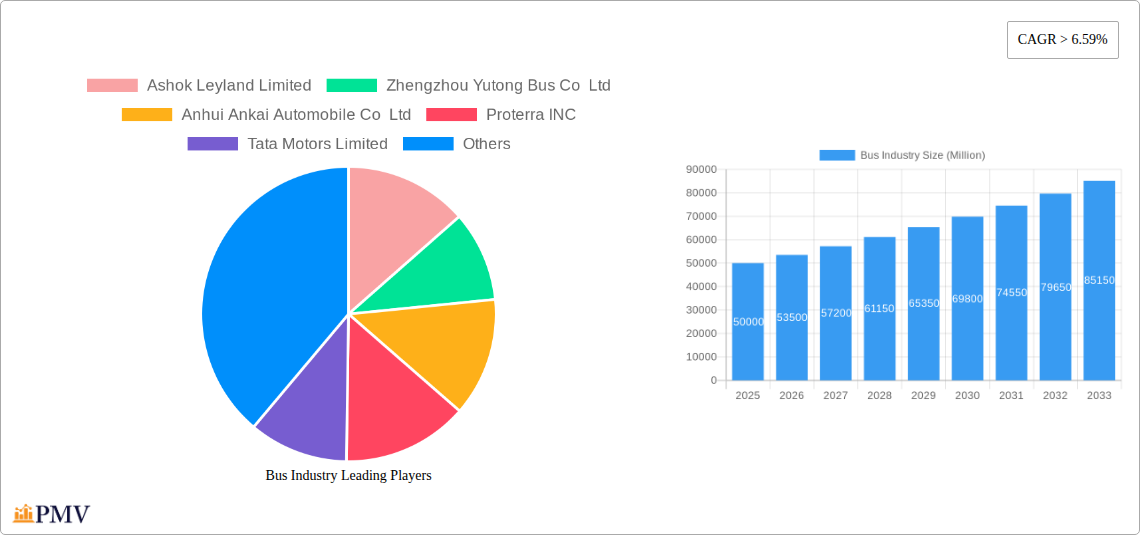
Bus Industry Company Market Share
This comprehensive report offers in-depth analysis of the global bus industry, providing critical insights into market dynamics, emerging trends, and strategic opportunities. Covering a detailed study period from 2019 to 2033, with a base year of 2025 and a forecast period from 2025–2033, this report is an essential resource for stakeholders seeking to understand and capitalize on the evolving bus market. The analysis examines various propulsion types, including Hybrid and Electric Vehicles (BEV, FCEV, HEV, PHEV) and Internal Combustion Engine (ICE) buses, evaluating their market penetration and growth. Extensive data from the historical period of 2019–2024 informs this analysis of the industry's evolution.
Bus Industry Market Structure & Competitive Dynamics
The bus industry exhibits a moderately concentrated market structure, with key players like Ashok Leyland Limited, Zhengzhou Yutong Bus Co Ltd, and Daimler Truck Holding AG holding significant market shares, estimated in the tens of billions of dollars annually. Innovation ecosystems are increasingly driven by the transition to electric buses and hydrogen fuel cell buses, fostering collaborations and R&D investments from major manufacturers. Regulatory frameworks worldwide are increasingly pushing for zero-emission public transportation, creating both opportunities and challenges. Product substitutes, such as ride-sharing services and advancements in autonomous vehicle technology, are influencing demand for traditional bus services. End-user trends reveal a growing preference for sustainable and cost-effective bus transportation solutions. Mergers and acquisitions (M&A) activities remain a strategic tool for market consolidation and technological integration, with deal values frequently reaching hundreds of millions of dollars, further shaping the competitive landscape.
- Market Concentration: Dominated by a few global manufacturers, with increasing fragmentation in the electric bus segment.
- Innovation Ecosystems: Rapid advancements in battery technology, charging infrastructure, and powertrain efficiency for green buses.
- Regulatory Frameworks: Government mandates and incentives for eco-friendly buses and sustainable mobility.
- Product Substitutes: Impact of ride-sharing, on-demand transit, and the nascent autonomous bus market.
- End-User Trends: Demand for comfort, safety, connectivity, and reduced environmental impact in passenger buses.
- M&A Activities: Strategic acquisitions to gain access to new technologies, markets, and customer bases.
Bus Industry Industry Trends & Insights
The bus industry is experiencing a transformative period characterized by robust market growth drivers, significant technological disruptions, evolving consumer preferences, and intensified competitive dynamics. A primary growth driver is the global push towards sustainable transportation, fueled by environmental concerns and stringent emission regulations. Governments worldwide are investing heavily in upgrading public transport fleets to electric buses and hybrid buses, leading to substantial market penetration increases, projected to reach over 30% for electric and hybrid segments combined by 2030. Technological disruptions, particularly in battery technology and charging infrastructure, are making electric bus models more viable and cost-effective. This trend is supported by a Compound Annual Growth Rate (CAGR) estimated at approximately 8% for the overall bus market, with the electric and hybrid bus segment exhibiting a much higher CAGR, potentially exceeding 15%. Consumer preferences are shifting towards cleaner, quieter, and more technologically advanced passenger buses, influencing fleet procurement decisions. Competitive dynamics are heating up as traditional manufacturers like Volvo Group and Tata Motors Limited compete with emerging electric vehicle pioneers such as Proterra INC and Byd Auto Industry Company Limited. The increasing focus on digitalization and connectivity within buses, offering real-time tracking, passenger information systems, and Wi-Fi, further shapes consumer expectations and manufacturer strategies. The ongoing development of autonomous bus technologies, though still in its nascent stages, represents a significant future disruption that could redefine public transit. Furthermore, the rising cost of fossil fuels and the desire for energy independence are compelling transit authorities and private operators to explore alternatives, with zero-emission buses at the forefront of this transition. The integration of smart city initiatives and the demand for efficient last-mile connectivity solutions are also contributing to the sustained growth and innovation within the global bus market.
Dominant Markets & Segments in Bus Industry
The bus industry is witnessing a significant shift towards Hybrid and Electric Vehicles (HEV, BEV, PHEV), particularly in regions with strong governmental support and a commitment to reducing carbon emissions. While Internal Combustion Engine (ICE) buses still hold a substantial market share, their dominance is steadily eroding.
Propulsion Type: Hybrid and Electric Vehicles is emerging as the dominant segment, driven by a confluence of factors.
- Economic Policies: Subsidies, tax incentives, and favorable financing options for electric bus purchases are instrumental in driving adoption in countries like China, the United States, and across the European Union. These policies directly reduce the upfront cost of zero-emission buses, making them competitive with ICE alternatives.
- Infrastructure Development: Significant investments in charging infrastructure, including dedicated charging depots and on-route charging solutions, are crucial for supporting widespread electric bus deployment. Cities are actively developing comprehensive charging networks to ensure operational efficiency and range reliability for electric fleets.
- Environmental Regulations: Stringent emission standards and mandates for sustainable public transport are compelling transit authorities to transition away from diesel and gasoline-powered buses. The European Union’s Green Deal and similar initiatives worldwide are setting ambitious targets for fleet electrification.
- Technological Advancements: Continuous improvements in battery energy density, charging speeds, and vehicle range are making electric buses increasingly practical for various operational needs, including long-haul routes. The development of efficient hybrid powertrains also offers a bridge technology for markets with developing charging infrastructure.
The BEV (Battery Electric Vehicle) sub-segment is experiencing the most rapid growth within the electric and hybrid category, driven by its zero-emission capability and lower operational costs compared to other fuel types. Countries like China, led by manufacturers such as Byd Auto Industry Company Limited and Zhengzhou Yutong Bus Co Ltd, have already established themselves as leaders in BEV bus manufacturing and deployment. The FCEV (Fuel Cell Electric Vehicle) segment, powered by hydrogen, is also gaining traction, particularly for longer-range applications and in regions with strong renewable hydrogen production capabilities, though its market penetration is currently lower than BEVs. HEV (Hybrid Electric Vehicle) and PHEV (Plug-in Hybrid Electric Vehicle) models serve as crucial transitional technologies, offering reduced emissions and improved fuel efficiency compared to traditional ICE buses, while bridging the gap to full electrification.
Geographically, Asia Pacific, particularly China, remains the largest market for buses due to its vast population and extensive public transportation networks. However, North America and Europe are experiencing the fastest growth rates in the electric bus market, propelled by aggressive climate action plans and substantial government funding for fleet electrification.
Bus Industry Product Innovations
The bus industry is witnessing a surge in product innovations focused on enhancing sustainability, passenger experience, and operational efficiency. Key developments include the continuous improvement of electric bus battery technology, leading to longer ranges and faster charging times, exemplified by advancements from companies like Proterra INC and Byd Auto Industry Company Limited. The integration of advanced driver-assistance systems (ADAS) and connectivity features is improving safety and passenger comfort. Innovations in lightweight materials are reducing vehicle weight, thereby improving energy efficiency. Furthermore, the development of modular bus platforms allows for greater customization to meet diverse urban and intercity transit needs. These innovations are driven by the imperative to reduce operational costs, minimize environmental impact, and meet evolving passenger expectations for modern public transportation.
Report Segmentation & Scope
This report meticulously segments the bus industry by Propulsion Type. The primary segmentation includes:
Hybrid and Electric Vehicles: This category encompasses:
- BEV (Battery Electric Vehicle): Fully electric buses powered solely by batteries. Growth projections indicate substantial market share increases driven by zero-emission mandates and falling battery costs.
- FCEV (Fuel Cell Electric Vehicle): Buses powered by hydrogen fuel cells, offering zero tailpipe emissions and longer refueling times compared to battery charging. This segment is projected for significant future growth as hydrogen infrastructure expands.
- HEV (Hybrid Electric Vehicle): Buses combining an internal combustion engine with an electric motor and battery. These offer improved fuel efficiency and reduced emissions over traditional ICE buses.
- PHEV (Plug-in Hybrid Electric Vehicle): Buses with both an internal combustion engine and a plug-in rechargeable battery, allowing for electric-only driving for shorter distances.
ICE (Internal Combustion Engine): Buses powered by traditional diesel or gasoline engines. While still a significant segment, its market share is projected to decline as electrification accelerates.
Key Drivers of Bus Industry Growth
Several key factors are propelling the bus industry forward:
- Government Initiatives and Regulations: Strong policy support, including subsidies for electric buses, stringent emission standards, and urban mobility plans, is a major catalyst. For example, the U.S. Bipartisan Infrastructure Law allocates significant funding for zero-emission transit buses.
- Environmental Concerns and Sustainability Goals: Growing awareness of climate change and the need for sustainable transportation are driving demand for cleaner bus solutions.
- Technological Advancements: Innovations in battery technology, charging infrastructure, and powertrain efficiency are making electric and hybrid buses more practical and cost-effective.
- Urbanization and Growing Public Transport Needs: Increasing urban populations necessitate efficient and accessible public transportation, with buses playing a crucial role.
- Fuel Cost Volatility and Operational Efficiency: The desire to reduce dependence on volatile fossil fuel prices and improve long-term operational costs drives interest in alternative fuel buses.
Challenges in the Bus Industry Sector
Despite robust growth, the bus industry faces several challenges:
- High Upfront Cost of Electric Buses: While operational costs are lower, the initial purchase price of electric buses and hydrogen buses remains a significant barrier for many transit authorities.
- Charging and Refueling Infrastructure Development: The widespread deployment of zero-emission buses is contingent on the availability of reliable and extensive charging and hydrogen refueling infrastructure, which requires substantial investment.
- Supply Chain Constraints for Batteries and Components: Disruptions in the global supply chain for critical components like batteries can impact production volumes and costs.
- Grid Capacity and Integration Issues: The increased demand from widespread bus charging can strain existing electrical grids, requiring significant upgrades and smart grid management solutions.
- Range Anxiety and Operational Flexibility: For certain routes, concerns about the range of electric buses and the time required for charging can still be a limiting factor, though this is rapidly diminishing with technological advancements.
Leading Players in the Bus Industry Market
- Ashok Leyland Limited
- Zhengzhou Yutong Bus Co Ltd
- Anhui Ankai Automobile Co Ltd
- Proterra INC
- Tata Motors Limited
- Daimler Truck Holding AG
- Volvo Group
- NFI Group Inc
- King Long United Automotive Industry Co Ltd
- Byd Auto Industry Company Limited
- Zhongtong Bus Holding Co Ltd
Key Developments in Bus Industry Sector
- September 2023: Volvo Energy signed a letter of intent with Connected Energy with the ambition to jointly develop a battery energy storage system (BESS). This development signals a strategic move towards energy solutions for the electric bus ecosystem.
- September 2023: Yutong announced that it held a shipping ceremony for 87 apron buses exported from China to Saudi Arabia in the Yutong New Energy Plant. This marks the largest batch of apron buses exported from China, highlighting Yutong's global reach in the new energy bus market.
- September 2023: Daimler Trucks & Buses US, PACCAR, and Accelera by Cummins, the zero-emissions business unit of Cummins Inc., announced they are partnering to localize battery cell production in the U.S. This collaboration is a crucial step towards bolstering the electric truck and bus supply chain in North America.
Strategic Bus Industry Market Outlook
The bus industry is poised for continued robust growth, driven by an accelerating global transition to sustainable and zero-emission transportation. The strategic outlook emphasizes continued innovation in battery technology, charging solutions, and hydrogen fuel cell capabilities. Investments in electric bus manufacturing, infrastructure development, and smart fleet management systems will be critical growth accelerators. Emerging markets are expected to see increased adoption of eco-friendly buses as government support mechanisms mature. Opportunities lie in developing integrated mobility solutions that combine public transport with other modes, enhancing passenger experience through digitalization, and exploring circular economy models for battery recycling. The industry's trajectory points towards a future dominated by cleaner, smarter, and more efficient passenger bus fleets, offering significant strategic opportunities for forward-thinking companies.
Bus Industry Segmentation
-
1. Propulsion Type
-
1.1. Hybrid and Electric Vehicles
-
1.1.1. By Fuel Category
- 1.1.1.1. BEV
- 1.1.1.2. FCEV
- 1.1.1.3. HEV
- 1.1.1.4. PHEV
-
1.1.1. By Fuel Category
- 1.2. ICE
-
1.1. Hybrid and Electric Vehicles
Bus Industry Segmentation By Geography
-
1. North America
- 1.1. United States
- 1.2. Canada
- 1.3. Mexico
-
2. South America
- 2.1. Brazil
- 2.2. Argentina
- 2.3. Rest of South America
-
3. Europe
- 3.1. United Kingdom
- 3.2. Germany
- 3.3. France
- 3.4. Italy
- 3.5. Spain
- 3.6. Russia
- 3.7. Benelux
- 3.8. Nordics
- 3.9. Rest of Europe
-
4. Middle East & Africa
- 4.1. Turkey
- 4.2. Israel
- 4.3. GCC
- 4.4. North Africa
- 4.5. South Africa
- 4.6. Rest of Middle East & Africa
-
5. Asia Pacific
- 5.1. China
- 5.2. India
- 5.3. Japan
- 5.4. South Korea
- 5.5. ASEAN
- 5.6. Oceania
- 5.7. Rest of Asia Pacific
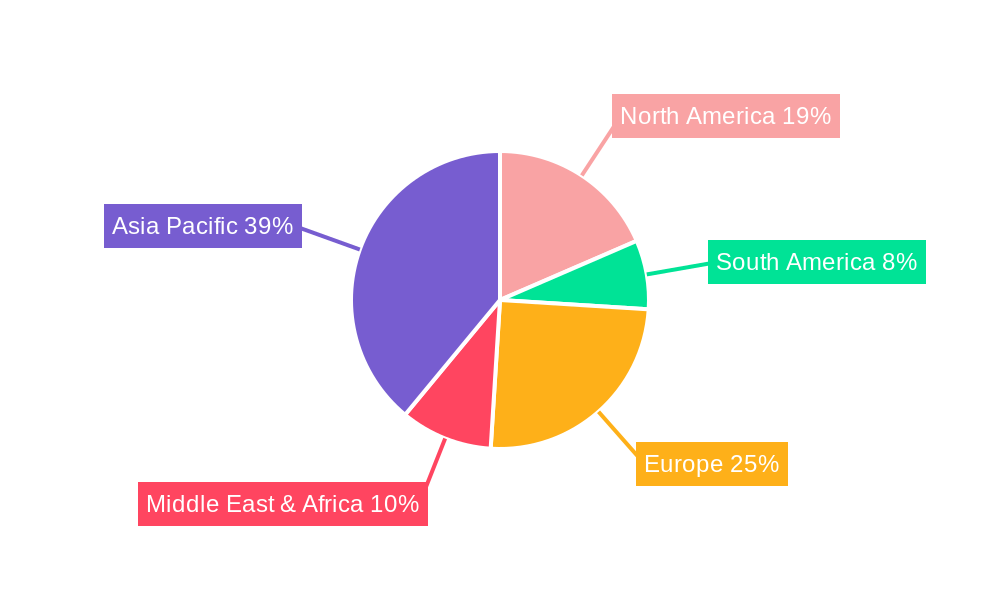
Bus Industry Regional Market Share
Geographic Coverage of Bus Industry
Bus Industry REPORT HIGHLIGHTS
| Aspects | Details |
|---|---|
| Study Period | 2020-2034 |
| Base Year | 2025 |
| Estimated Year | 2026 |
| Forecast Period | 2026-2034 |
| Historical Period | 2020-2025 |
| Growth Rate | CAGR of 7% from 2020-2034 |
| Segmentation |
|
Table of Contents
- 1. Introduction
- 1.1. Research Scope
- 1.2. Market Segmentation
- 1.3. Research Objective
- 1.4. Definitions and Assumptions
- 2. Executive Summary
- 2.1. Market Snapshot
- 3. Market Dynamics
- 3.1. Market Drivers
- 3.2. Market Restrains
- 3.3. Market Trends
- 3.4. Market Opportunities
- 4. Market Factor Analysis
- 4.1. Porters Five Forces
- 4.1.1. Bargaining Power of Suppliers
- 4.1.2. Bargaining Power of Buyers
- 4.1.3. Threat of New Entrants
- 4.1.4. Threat of Substitutes
- 4.1.5. Competitive Rivalry
- 4.2. PESTEL analysis
- 4.3. BCG Analysis
- 4.3.1. Stars (High Growth, High Market Share)
- 4.3.2. Cash Cows (Low Growth, High Market Share)
- 4.3.3. Question Mark (High Growth, Low Market Share)
- 4.3.4. Dogs (Low Growth, Low Market Share)
- 4.4. Ansoff Matrix Analysis
- 4.5. Supply Chain Analysis
- 4.6. Regulatory Landscape
- 4.7. Current Market Potential and Opportunity Assessment (TAM–SAM–SOM Framework)
- 4.8. PMV Analyst Note
- 4.1. Porters Five Forces
- 5. Market Analysis, Insights and Forecast 2021-2033
- 5.1. Market Analysis, Insights and Forecast - by Propulsion Type
- 5.1.1. Hybrid and Electric Vehicles
- 5.1.1.1. By Fuel Category
- 5.1.1.1.1. BEV
- 5.1.1.1.2. FCEV
- 5.1.1.1.3. HEV
- 5.1.1.1.4. PHEV
- 5.1.1.1. By Fuel Category
- 5.1.2. ICE
- 5.1.1. Hybrid and Electric Vehicles
- 5.2. Market Analysis, Insights and Forecast - by Region
- 5.2.1. North America
- 5.2.2. South America
- 5.2.3. Europe
- 5.2.4. Middle East & Africa
- 5.2.5. Asia Pacific
- 5.1. Market Analysis, Insights and Forecast - by Propulsion Type
- 6. Global Bus Industry Analysis, Insights and Forecast, 2021-2033
- 6.1. Market Analysis, Insights and Forecast - by Propulsion Type
- 6.1.1. Hybrid and Electric Vehicles
- 6.1.1.1. By Fuel Category
- 6.1.1.1.1. BEV
- 6.1.1.1.2. FCEV
- 6.1.1.1.3. HEV
- 6.1.1.1.4. PHEV
- 6.1.1.1. By Fuel Category
- 6.1.2. ICE
- 6.1.1. Hybrid and Electric Vehicles
- 6.1. Market Analysis, Insights and Forecast - by Propulsion Type
- 7. North America Bus Industry Analysis, Insights and Forecast, 2020-2032
- 7.1. Market Analysis, Insights and Forecast - by Propulsion Type
- 7.1.1. Hybrid and Electric Vehicles
- 7.1.1.1. By Fuel Category
- 7.1.1.1.1. BEV
- 7.1.1.1.2. FCEV
- 7.1.1.1.3. HEV
- 7.1.1.1.4. PHEV
- 7.1.1.1. By Fuel Category
- 7.1.2. ICE
- 7.1.1. Hybrid and Electric Vehicles
- 7.1. Market Analysis, Insights and Forecast - by Propulsion Type
- 8. South America Bus Industry Analysis, Insights and Forecast, 2020-2032
- 8.1. Market Analysis, Insights and Forecast - by Propulsion Type
- 8.1.1. Hybrid and Electric Vehicles
- 8.1.1.1. By Fuel Category
- 8.1.1.1.1. BEV
- 8.1.1.1.2. FCEV
- 8.1.1.1.3. HEV
- 8.1.1.1.4. PHEV
- 8.1.1.1. By Fuel Category
- 8.1.2. ICE
- 8.1.1. Hybrid and Electric Vehicles
- 8.1. Market Analysis, Insights and Forecast - by Propulsion Type
- 9. Europe Bus Industry Analysis, Insights and Forecast, 2020-2032
- 9.1. Market Analysis, Insights and Forecast - by Propulsion Type
- 9.1.1. Hybrid and Electric Vehicles
- 9.1.1.1. By Fuel Category
- 9.1.1.1.1. BEV
- 9.1.1.1.2. FCEV
- 9.1.1.1.3. HEV
- 9.1.1.1.4. PHEV
- 9.1.1.1. By Fuel Category
- 9.1.2. ICE
- 9.1.1. Hybrid and Electric Vehicles
- 9.1. Market Analysis, Insights and Forecast - by Propulsion Type
- 10. Middle East & Africa Bus Industry Analysis, Insights and Forecast, 2020-2032
- 10.1. Market Analysis, Insights and Forecast - by Propulsion Type
- 10.1.1. Hybrid and Electric Vehicles
- 10.1.1.1. By Fuel Category
- 10.1.1.1.1. BEV
- 10.1.1.1.2. FCEV
- 10.1.1.1.3. HEV
- 10.1.1.1.4. PHEV
- 10.1.1.1. By Fuel Category
- 10.1.2. ICE
- 10.1.1. Hybrid and Electric Vehicles
- 10.1. Market Analysis, Insights and Forecast - by Propulsion Type
- 11. Asia Pacific Bus Industry Analysis, Insights and Forecast, 2020-2032
- 11.1. Market Analysis, Insights and Forecast - by Propulsion Type
- 11.1.1. Hybrid and Electric Vehicles
- 11.1.1.1. By Fuel Category
- 11.1.1.1.1. BEV
- 11.1.1.1.2. FCEV
- 11.1.1.1.3. HEV
- 11.1.1.1.4. PHEV
- 11.1.1.1. By Fuel Category
- 11.1.2. ICE
- 11.1.1. Hybrid and Electric Vehicles
- 11.1. Market Analysis, Insights and Forecast - by Propulsion Type
- 12. Competitive Analysis
- 12.1. Company Profiles
- 12.1.1 Ashok Leyland Limited
- 12.1.1.1. Company Overview
- 12.1.1.2. Products
- 12.1.1.3. Company Financials
- 12.1.1.4. SWOT Analysis
- 12.1.2 Zhengzhou Yutong Bus Co Ltd
- 12.1.2.1. Company Overview
- 12.1.2.2. Products
- 12.1.2.3. Company Financials
- 12.1.2.4. SWOT Analysis
- 12.1.3 Anhui Ankai Automobile Co Ltd
- 12.1.3.1. Company Overview
- 12.1.3.2. Products
- 12.1.3.3. Company Financials
- 12.1.3.4. SWOT Analysis
- 12.1.4 Proterra INC
- 12.1.4.1. Company Overview
- 12.1.4.2. Products
- 12.1.4.3. Company Financials
- 12.1.4.4. SWOT Analysis
- 12.1.5 Tata Motors Limited
- 12.1.5.1. Company Overview
- 12.1.5.2. Products
- 12.1.5.3. Company Financials
- 12.1.5.4. SWOT Analysis
- 12.1.6 Daimler Truck Holding AG
- 12.1.6.1. Company Overview
- 12.1.6.2. Products
- 12.1.6.3. Company Financials
- 12.1.6.4. SWOT Analysis
- 12.1.7 Volvo Group
- 12.1.7.1. Company Overview
- 12.1.7.2. Products
- 12.1.7.3. Company Financials
- 12.1.7.4. SWOT Analysis
- 12.1.8 NFI Group Inc
- 12.1.8.1. Company Overview
- 12.1.8.2. Products
- 12.1.8.3. Company Financials
- 12.1.8.4. SWOT Analysis
- 12.1.9 King Long United Automotive Industry Co Ltd
- 12.1.9.1. Company Overview
- 12.1.9.2. Products
- 12.1.9.3. Company Financials
- 12.1.9.4. SWOT Analysis
- 12.1.10 Byd Auto Industry Company Limited
- 12.1.10.1. Company Overview
- 12.1.10.2. Products
- 12.1.10.3. Company Financials
- 12.1.10.4. SWOT Analysis
- 12.1.11 Zhongtong Bus Holding Co Ltd
- 12.1.11.1. Company Overview
- 12.1.11.2. Products
- 12.1.11.3. Company Financials
- 12.1.11.4. SWOT Analysis
- 12.1.1 Ashok Leyland Limited
- 12.2. Market Entropy
- 12.2.1 Company's Key Areas Served
- 12.2.2 Recent Developments
- 12.3. Company Market Share Analysis 2025
- 12.3.1 Top 5 Companies Market Share Analysis
- 12.3.2 Top 3 Companies Market Share Analysis
- 12.4. List of Potential Customers
- 13. Research Methodology
List of Figures
- Figure 1: Global Bus Industry Revenue Breakdown (billion, %) by Region 2025 & 2033
- Figure 2: North America Bus Industry Revenue (billion), by Propulsion Type 2025 & 2033
- Figure 3: North America Bus Industry Revenue Share (%), by Propulsion Type 2025 & 2033
- Figure 4: North America Bus Industry Revenue (billion), by Country 2025 & 2033
- Figure 5: North America Bus Industry Revenue Share (%), by Country 2025 & 2033
- Figure 6: South America Bus Industry Revenue (billion), by Propulsion Type 2025 & 2033
- Figure 7: South America Bus Industry Revenue Share (%), by Propulsion Type 2025 & 2033
- Figure 8: South America Bus Industry Revenue (billion), by Country 2025 & 2033
- Figure 9: South America Bus Industry Revenue Share (%), by Country 2025 & 2033
- Figure 10: Europe Bus Industry Revenue (billion), by Propulsion Type 2025 & 2033
- Figure 11: Europe Bus Industry Revenue Share (%), by Propulsion Type 2025 & 2033
- Figure 12: Europe Bus Industry Revenue (billion), by Country 2025 & 2033
- Figure 13: Europe Bus Industry Revenue Share (%), by Country 2025 & 2033
- Figure 14: Middle East & Africa Bus Industry Revenue (billion), by Propulsion Type 2025 & 2033
- Figure 15: Middle East & Africa Bus Industry Revenue Share (%), by Propulsion Type 2025 & 2033
- Figure 16: Middle East & Africa Bus Industry Revenue (billion), by Country 2025 & 2033
- Figure 17: Middle East & Africa Bus Industry Revenue Share (%), by Country 2025 & 2033
- Figure 18: Asia Pacific Bus Industry Revenue (billion), by Propulsion Type 2025 & 2033
- Figure 19: Asia Pacific Bus Industry Revenue Share (%), by Propulsion Type 2025 & 2033
- Figure 20: Asia Pacific Bus Industry Revenue (billion), by Country 2025 & 2033
- Figure 21: Asia Pacific Bus Industry Revenue Share (%), by Country 2025 & 2033
List of Tables
- Table 1: Global Bus Industry Revenue billion Forecast, by Propulsion Type 2020 & 2033
- Table 2: Global Bus Industry Revenue billion Forecast, by Region 2020 & 2033
- Table 3: Global Bus Industry Revenue billion Forecast, by Propulsion Type 2020 & 2033
- Table 4: Global Bus Industry Revenue billion Forecast, by Country 2020 & 2033
- Table 5: United States Bus Industry Revenue (billion) Forecast, by Application 2020 & 2033
- Table 6: Canada Bus Industry Revenue (billion) Forecast, by Application 2020 & 2033
- Table 7: Mexico Bus Industry Revenue (billion) Forecast, by Application 2020 & 2033
- Table 8: Global Bus Industry Revenue billion Forecast, by Propulsion Type 2020 & 2033
- Table 9: Global Bus Industry Revenue billion Forecast, by Country 2020 & 2033
- Table 10: Brazil Bus Industry Revenue (billion) Forecast, by Application 2020 & 2033
- Table 11: Argentina Bus Industry Revenue (billion) Forecast, by Application 2020 & 2033
- Table 12: Rest of South America Bus Industry Revenue (billion) Forecast, by Application 2020 & 2033
- Table 13: Global Bus Industry Revenue billion Forecast, by Propulsion Type 2020 & 2033
- Table 14: Global Bus Industry Revenue billion Forecast, by Country 2020 & 2033
- Table 15: United Kingdom Bus Industry Revenue (billion) Forecast, by Application 2020 & 2033
- Table 16: Germany Bus Industry Revenue (billion) Forecast, by Application 2020 & 2033
- Table 17: France Bus Industry Revenue (billion) Forecast, by Application 2020 & 2033
- Table 18: Italy Bus Industry Revenue (billion) Forecast, by Application 2020 & 2033
- Table 19: Spain Bus Industry Revenue (billion) Forecast, by Application 2020 & 2033
- Table 20: Russia Bus Industry Revenue (billion) Forecast, by Application 2020 & 2033
- Table 21: Benelux Bus Industry Revenue (billion) Forecast, by Application 2020 & 2033
- Table 22: Nordics Bus Industry Revenue (billion) Forecast, by Application 2020 & 2033
- Table 23: Rest of Europe Bus Industry Revenue (billion) Forecast, by Application 2020 & 2033
- Table 24: Global Bus Industry Revenue billion Forecast, by Propulsion Type 2020 & 2033
- Table 25: Global Bus Industry Revenue billion Forecast, by Country 2020 & 2033
- Table 26: Turkey Bus Industry Revenue (billion) Forecast, by Application 2020 & 2033
- Table 27: Israel Bus Industry Revenue (billion) Forecast, by Application 2020 & 2033
- Table 28: GCC Bus Industry Revenue (billion) Forecast, by Application 2020 & 2033
- Table 29: North Africa Bus Industry Revenue (billion) Forecast, by Application 2020 & 2033
- Table 30: South Africa Bus Industry Revenue (billion) Forecast, by Application 2020 & 2033
- Table 31: Rest of Middle East & Africa Bus Industry Revenue (billion) Forecast, by Application 2020 & 2033
- Table 32: Global Bus Industry Revenue billion Forecast, by Propulsion Type 2020 & 2033
- Table 33: Global Bus Industry Revenue billion Forecast, by Country 2020 & 2033
- Table 34: China Bus Industry Revenue (billion) Forecast, by Application 2020 & 2033
- Table 35: India Bus Industry Revenue (billion) Forecast, by Application 2020 & 2033
- Table 36: Japan Bus Industry Revenue (billion) Forecast, by Application 2020 & 2033
- Table 37: South Korea Bus Industry Revenue (billion) Forecast, by Application 2020 & 2033
- Table 38: ASEAN Bus Industry Revenue (billion) Forecast, by Application 2020 & 2033
- Table 39: Oceania Bus Industry Revenue (billion) Forecast, by Application 2020 & 2033
- Table 40: Rest of Asia Pacific Bus Industry Revenue (billion) Forecast, by Application 2020 & 2033
Frequently Asked Questions
1. What is the projected Compound Annual Growth Rate (CAGR) of the Bus Industry?
The projected CAGR is approximately 7%.
2. Which companies are prominent players in the Bus Industry?
Key companies in the market include Ashok Leyland Limited, Zhengzhou Yutong Bus Co Ltd, Anhui Ankai Automobile Co Ltd, Proterra INC, Tata Motors Limited, Daimler Truck Holding AG, Volvo Group, NFI Group Inc, King Long United Automotive Industry Co Ltd, Byd Auto Industry Company Limited, Zhongtong Bus Holding Co Ltd.
3. What are the main segments of the Bus Industry?
The market segments include Propulsion Type.
4. Can you provide details about the market size?
The market size is estimated to be USD 268.68 billion as of 2022.
5. What are some drivers contributing to market growth?
Increasing Air Pollution Awareness and Health Concern is Driving the Demand.
6. What are the notable trends driving market growth?
OTHER KEY INDUSTRY TRENDS COVERED IN THE REPORT.
7. Are there any restraints impacting market growth?
High Cost of Installation Related to Industrial Robots.
8. Can you provide examples of recent developments in the market?
September 2023: Volvo Energy signed a letter of intent with Connected Energy with the ambition to jointly develop a battery energy storage system (BESS).September 2023: Yutong announced that it held a shipping ceremony for 87 apron buses exported from China to Saudi Arabia in the Yutong New Energy Plant. It is the largest batch of apron buses exported from China.September 2023: Daimler Trucks & Buses US, PACCAR, and Accelera by Cummins, the zero-emissions business unit of Cummins Inc., announced they are partnering to localize battery cell production in the U.S.
9. What pricing options are available for accessing the report?
Pricing options include single-user, multi-user, and enterprise licenses priced at USD 3800, USD 4500, and USD 5800 respectively.
10. Is the market size provided in terms of value or volume?
The market size is provided in terms of value, measured in billion.
11. Are there any specific market keywords associated with the report?
Yes, the market keyword associated with the report is "Bus Industry," which aids in identifying and referencing the specific market segment covered.
12. How do I determine which pricing option suits my needs best?
The pricing options vary based on user requirements and access needs. Individual users may opt for single-user licenses, while businesses requiring broader access may choose multi-user or enterprise licenses for cost-effective access to the report.
13. Are there any additional resources or data provided in the Bus Industry report?
While the report offers comprehensive insights, it's advisable to review the specific contents or supplementary materials provided to ascertain if additional resources or data are available.
14. How can I stay updated on further developments or reports in the Bus Industry?
To stay informed about further developments, trends, and reports in the Bus Industry, consider subscribing to industry newsletters, following relevant companies and organizations, or regularly checking reputable industry news sources and publications.
Methodology
Step 1 - Identification of Relevant Samples Size from Population Database


Step 2 - Approaches for Defining Global Market Size (Value, Volume* & Price*)

Note*: In applicable scenarios
Step 3 - Data Sources
Primary Research
- Web Analytics
- Survey Reports
- Research Institute
- Latest Research Reports
- Opinion Leaders
Secondary Research
- Annual Reports
- White Paper
- Latest Press Release
- Industry Association
- Paid Database
- Investor Presentations

Step 4 - Data Triangulation
Involves using different sources of information in order to increase the validity of a study
These sources are likely to be stakeholders in a program - participants, other researchers, program staff, other community members, and so on.
Then we put all data in single framework & apply various statistical tools to find out the dynamic on the market.
During the analysis stage, feedback from the stakeholder groups would be compared to determine areas of agreement as well as areas of divergence