
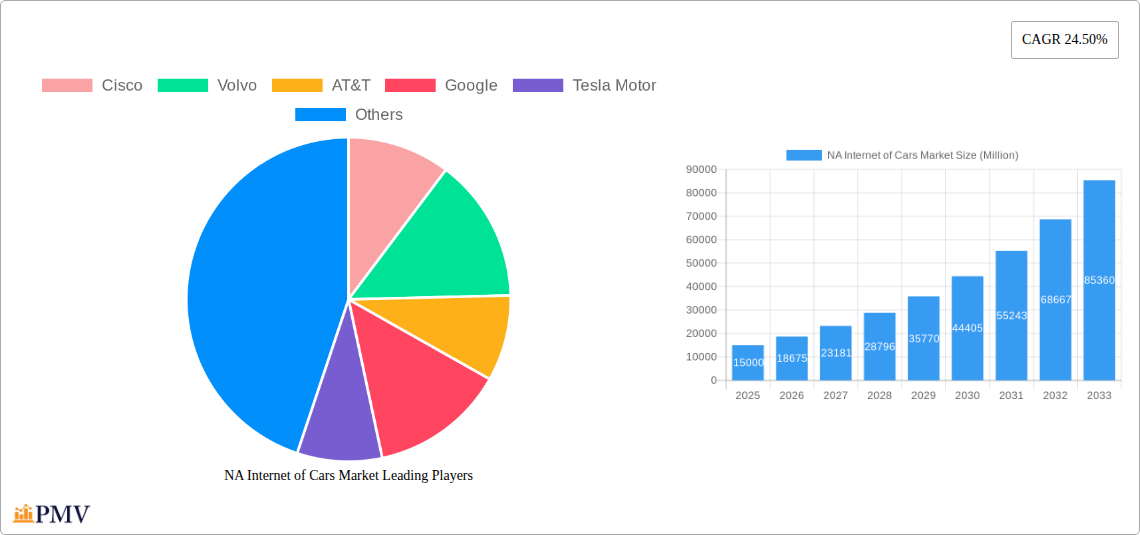
Key Insights
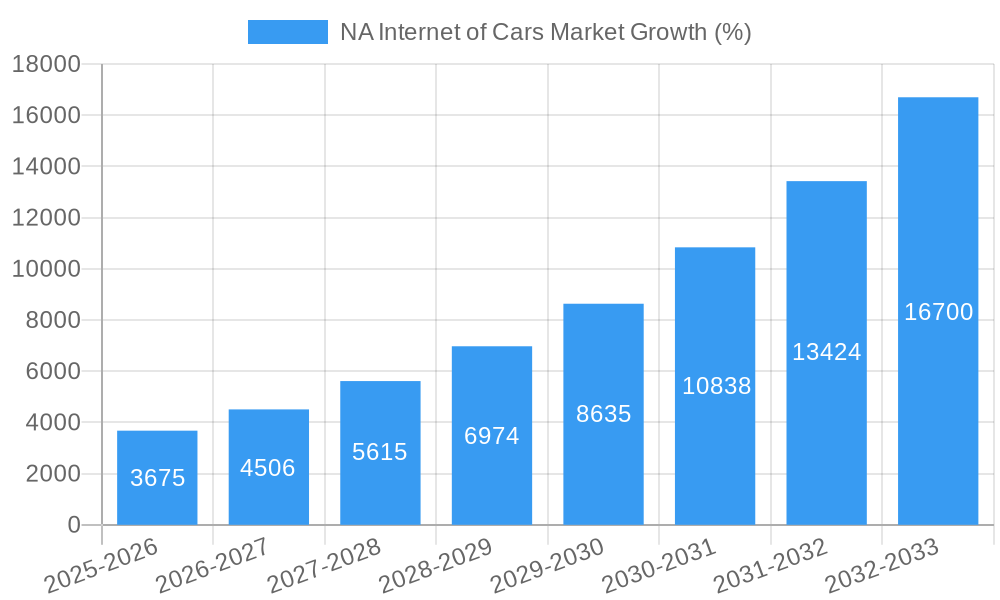
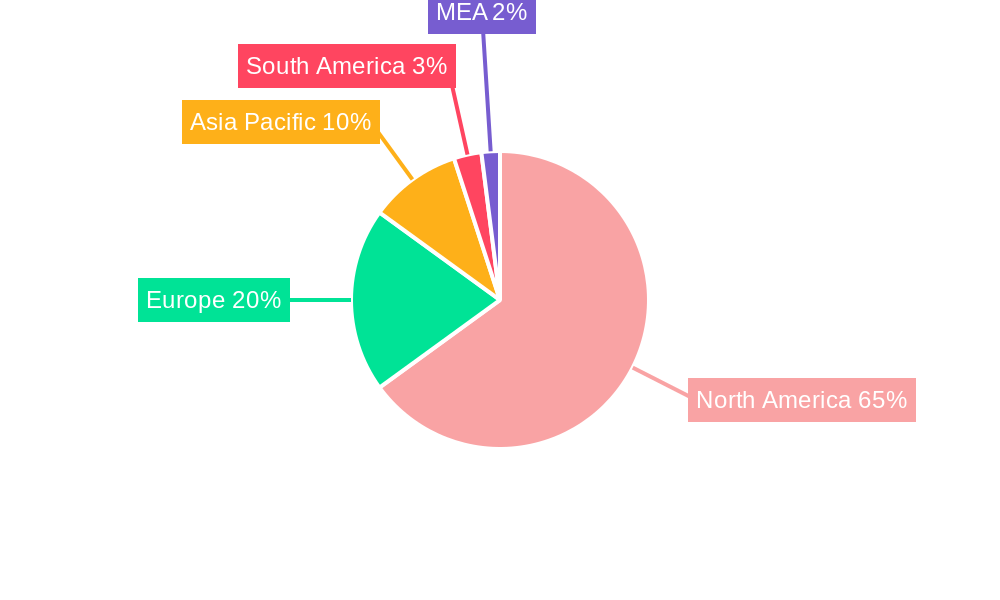
The North American Internet of Cars (IoC) market is experiencing robust growth, fueled by the increasing adoption of connected car technologies and the expanding infrastructure supporting vehicle connectivity. With a projected Compound Annual Growth Rate (CAGR) of 24.50% from 2025 to 2033, the market demonstrates significant potential for expansion. Key drivers include the rising demand for enhanced safety features, improved driver assistance systems (ADAS), and infotainment functionalities. The proliferation of smartphones and the increasing integration of mobile applications within vehicles are further boosting market growth. Technological advancements in areas like 5G connectivity, Wi-Fi, Bluetooth, and cellular networks are enabling faster data transmission speeds and more seamless integration of connected services. Segmentation reveals a strong emphasis on hardware components like telematics control units and embedded systems, alongside robust demand for software applications and services related to data analytics and fleet management. The Car-to-Infrastructure (C2I) segment is witnessing particularly strong growth, driven by initiatives to improve traffic management and enhance road safety. The United States, given its advanced technological infrastructure and high vehicle ownership rates, represents the largest market segment within North America, contributing significantly to overall market revenue.
Despite the considerable growth potential, certain challenges remain. High initial investment costs associated with implementing IoC technology, particularly for legacy vehicle integration, may hinder wider adoption in the short term. Furthermore, data security and privacy concerns associated with the collection and transmission of vast quantities of vehicle data necessitate the development of robust cybersecurity protocols. Competition among established players, including automotive manufacturers, telecommunication companies, and technology firms, is intensifying, leading to price pressures and the need for continuous innovation. Nevertheless, ongoing government initiatives supporting the development of smart transportation systems and the increasing consumer preference for connected vehicles are expected to alleviate these restraints and further propel the market toward continued, significant expansion.
North America Internet of Cars Market: A Comprehensive Report (2019-2033)
This in-depth report provides a comprehensive analysis of the North America Internet of Cars market, offering invaluable insights for businesses, investors, and industry stakeholders. Covering the period from 2019 to 2033, with a focus on 2025, this report dissects market dynamics, identifies key trends, and forecasts future growth. The report analyzes market segments by component (hardware, software, services), technology (Wi-Fi, Bluetooth, NFC, Cellular, others), communication equipment (car-to-car, car-to-infrastructure, others), and country (United States, Canada, others). Key players such as Cisco, Volvo, AT&T, Google, Tesla Motor, Verizon, Toyota, and IBM are thoroughly examined.
NA Internet of Cars Market Market Structure & Competitive Dynamics
This section analyzes the North American Internet of Cars market structure, highlighting competitive dynamics, innovation ecosystems, and regulatory landscapes. The market exhibits a moderately concentrated structure with a few major players holding significant market share. However, the presence of numerous smaller, innovative companies fosters a dynamic competitive environment. The market is characterized by continuous technological advancements, leading to frequent product innovation and upgrades. Regulatory frameworks, particularly concerning data privacy and cybersecurity, significantly impact market growth. Mergers and acquisitions (M&A) play a considerable role in shaping market dynamics; recent deals have been valued in the range of xx Million to xx Million, driven by the need for technological integration and expansion. End-user trends, particularly towards connected and autonomous vehicles, are creating immense growth opportunities.
- Market Concentration: The top 5 players account for approximately xx% of the market share in 2025.
- Innovation Ecosystems: Significant investments in R&D are driving the development of new technologies like 5G and V2X communication.
- Regulatory Frameworks: Stringent data privacy regulations and cybersecurity standards are influencing product development and market strategies.
- Product Substitutes: Alternative communication technologies present limited competition.
- End-User Trends: Increasing consumer preference for connected car features is a major growth driver.
- M&A Activities: The number of M&A deals is expected to rise with an average deal value of xx Million.
NA Internet of Cars Market Industry Trends & Insights
The North American Internet of Cars market is experiencing robust growth, fueled by several key trends. The rising adoption of connected car technologies, driven by increased consumer demand for infotainment, safety, and convenience features, is a primary growth driver. Technological disruptions, particularly the advancements in 5G connectivity, Artificial Intelligence (AI), and the Internet of Things (IoT), are transforming the industry landscape. Consumer preferences are shifting towards vehicles equipped with advanced connectivity features, leading to higher market penetration of connected car technologies. The competitive landscape is highly dynamic, with established automakers and technology companies vying for market share. The market is projected to achieve a CAGR of xx% during the forecast period (2025-2033), with market penetration expected to reach xx% by 2033.
Dominant Markets & Segments in NA Internet of Cars Market
The United States dominates the North American Internet of Cars market, driven by its advanced automotive industry, strong technological infrastructure, and high consumer adoption of connected car technologies. Canada also represents a significant market, albeit smaller than the US.
- By Component: The hardware segment currently holds the largest market share, followed by services and software.
- By Technology: Cellular technology is the dominant technology, owing to its extensive coverage and high data transfer speeds. However, the adoption of Wi-Fi and other short-range technologies is increasing steadily.
- By Communication Equipment: Car-to-infrastructure communication is currently more prevalent than car-to-car, driven by the rapid deployment of intelligent transportation systems.
- By Country:
- United States: High vehicle ownership, advanced infrastructure, and strong consumer demand for technology drive market dominance.
- Canada: Similar to the US but on a smaller scale, driven by government initiatives promoting technological innovation in the automotive sector.
- Others: This segment encompasses other North American countries with lower market penetration but potential for future growth.
Key Drivers:
- Economic factors: Rising disposable incomes and increased consumer spending on vehicles and connected technologies.
- Technological factors: 5G roll-out, advancements in AI and IoT technologies, and the development of autonomous driving capabilities.
- Government policies: Initiatives supporting the adoption of smart cities and connected vehicles.
NA Internet of Cars Market Product Innovations
Recent product innovations focus on enhancing the user experience and safety features of connected cars. These include advanced infotainment systems with improved voice control and seamless integration with smartphones, advanced driver-assistance systems (ADAS) using real-time data, and enhanced security features to protect against cyber threats. The integration of AI and machine learning is enhancing the functionality of these features, providing personalized experiences and optimizing vehicle performance. The market is witnessing a trend toward subscription-based services, offering flexible access to features and data.
Report Segmentation & Scope
This report provides a comprehensive segmentation of the North American Internet of Cars market across various parameters:
By Component: Hardware (e.g., telematics control units (TCUs), sensors), Software (e.g., operating systems, applications), and Services (e.g., data analytics, maintenance). Each segment's growth projection, market size, and competitive dynamics are detailed.
By Technology: Wi-Fi, Bluetooth, NFC, Cellular, and Other technologies. This section analyzes each technology's adoption rate, strengths, weaknesses and market outlook.
By Communication Equipment: Car-to-Car, Car-to-Infrastructure, and Others. This section looks at the various communication methods and infrastructure development.
By Country: The United States and Canada are individually analyzed with distinct market size projections, competitive landscapes, and growth factors. An ‘Others’ category includes remaining North American countries.
Key Drivers of NA Internet of Cars Market Growth
Several factors drive the growth of the North American Internet of Cars market. Technological advancements such as the development of 5G networks, improvements in artificial intelligence (AI), and the increasing sophistication of Internet of Things (IoT) devices are key catalysts. Strong government support and initiatives promoting smart city infrastructure, alongside improving vehicle safety and convenience features, further accelerate market expansion. The rising disposable income of consumers and a growing preference for feature-rich vehicles also contribute significantly to market growth.
Challenges in the NA Internet of Cars Market Sector
The NA Internet of Cars market faces challenges such as stringent data privacy regulations that necessitate robust security protocols, impacting development costs. Supply chain disruptions related to semiconductor shortages and the complexity of integrating diverse technologies can lead to production delays and increased costs. Moreover, intense competition among established automakers and technology companies intensifies the pressure to innovate and differentiate products. These factors influence the market growth and overall profitability.
Leading Players in the NA Internet of Cars Market Market
Key Developments in NA Internet of Cars Market Sector
- October 2021: Kia America rebrands its telematics system from "UVO" to "Kia Connect," highlighting the growing importance of connectivity. The company witnessed a 40-fold increase in connected cars, from 15,000 in 2018 to an estimated 600,000 by the end of 2021. This demonstrates the rapid adoption of connected car technology.
Strategic NA Internet of Cars Market Market Outlook
The North American Internet of Cars market presents significant growth potential driven by continued technological innovation, increasing consumer demand for connected car features, and supportive government policies. Strategic opportunities exist in developing advanced safety and security features, integrating AI-powered services, and expanding into new market segments such as autonomous vehicles and connected infrastructure. Investing in 5G infrastructure and enhancing cybersecurity measures are also key strategic priorities for market players.
NA Internet of Cars Market Segmentation
-
1. Component
- 1.1. Hardware
- 1.2. Software
- 1.3. Service
-
2. Technology
- 2.1. Wi-FI
- 2.2. Bluetooth
- 2.3. NFC
- 2.4. Cellular
- 2.5. Others
-
3. Communication Equipment
- 3.1. Car-to-Car
- 3.2. Car-to-Infrastructure
- 3.3. Others
NA Internet of Cars Market Segmentation By Geography
-
1. North America
- 1.1. United States
- 1.2. Canada
- 1.3. Mexico
-
2. South America
- 2.1. Brazil
- 2.2. Argentina
- 2.3. Rest of South America
-
3. Europe
- 3.1. United Kingdom
- 3.2. Germany
- 3.3. France
- 3.4. Italy
- 3.5. Spain
- 3.6. Russia
- 3.7. Benelux
- 3.8. Nordics
- 3.9. Rest of Europe
-
4. Middle East & Africa
- 4.1. Turkey
- 4.2. Israel
- 4.3. GCC
- 4.4. North Africa
- 4.5. South Africa
- 4.6. Rest of Middle East & Africa
-
5. Asia Pacific
- 5.1. China
- 5.2. India
- 5.3. Japan
- 5.4. South Korea
- 5.5. ASEAN
- 5.6. Oceania
- 5.7. Rest of Asia Pacific
NA Internet of Cars Market REPORT HIGHLIGHTS
| Aspects | Details |
|---|---|
| Study Period | 2019-2033 |
| Base Year | 2024 |
| Estimated Year | 2025 |
| Forecast Period | 2025-2033 |
| Historical Period | 2019-2024 |
| Growth Rate | CAGR of 24.50% from 2019-2033 |
| Segmentation |
|
Table of Contents
- 1. Introduction
- 1.1. Research Scope
- 1.2. Market Segmentation
- 1.3. Research Methodology
- 1.4. Definitions and Assumptions
- 2. Executive Summary
- 2.1. Introduction
- 3. Market Dynamics
- 3.1. Introduction
- 3.2. Market Drivers
- 3.2.1. Increasing Demand for Data Storage and Adoption of Cloud Computing; Need for High Speed Data Transfer; Increasing Demand of Fabric Switches
- 3.3. Market Restrains
- 3.3.1. Security issues
- 3.4. Market Trends
- 3.4.1. North American Market is expected to be driven by Vehicle Safety Norms
- 4. Market Factor Analysis
- 4.1. Porters Five Forces
- 4.2. Supply/Value Chain
- 4.3. PESTEL analysis
- 4.4. Market Entropy
- 4.5. Patent/Trademark Analysis
- 5. Global NA Internet of Cars Market Analysis, Insights and Forecast, 2019-2031
- 5.1. Market Analysis, Insights and Forecast - by Component
- 5.1.1. Hardware
- 5.1.2. Software
- 5.1.3. Service
- 5.2. Market Analysis, Insights and Forecast - by Technology
- 5.2.1. Wi-FI
- 5.2.2. Bluetooth
- 5.2.3. NFC
- 5.2.4. Cellular
- 5.2.5. Others
- 5.3. Market Analysis, Insights and Forecast - by Communication Equipment
- 5.3.1. Car-to-Car
- 5.3.2. Car-to-Infrastructure
- 5.3.3. Others
- 5.4. Market Analysis, Insights and Forecast - by Region
- 5.4.1. North America
- 5.4.2. South America
- 5.4.3. Europe
- 5.4.4. Middle East & Africa
- 5.4.5. Asia Pacific
- 5.1. Market Analysis, Insights and Forecast - by Component
- 6. North America NA Internet of Cars Market Analysis, Insights and Forecast, 2019-2031
- 6.1. Market Analysis, Insights and Forecast - by Component
- 6.1.1. Hardware
- 6.1.2. Software
- 6.1.3. Service
- 6.2. Market Analysis, Insights and Forecast - by Technology
- 6.2.1. Wi-FI
- 6.2.2. Bluetooth
- 6.2.3. NFC
- 6.2.4. Cellular
- 6.2.5. Others
- 6.3. Market Analysis, Insights and Forecast - by Communication Equipment
- 6.3.1. Car-to-Car
- 6.3.2. Car-to-Infrastructure
- 6.3.3. Others
- 6.1. Market Analysis, Insights and Forecast - by Component
- 7. South America NA Internet of Cars Market Analysis, Insights and Forecast, 2019-2031
- 7.1. Market Analysis, Insights and Forecast - by Component
- 7.1.1. Hardware
- 7.1.2. Software
- 7.1.3. Service
- 7.2. Market Analysis, Insights and Forecast - by Technology
- 7.2.1. Wi-FI
- 7.2.2. Bluetooth
- 7.2.3. NFC
- 7.2.4. Cellular
- 7.2.5. Others
- 7.3. Market Analysis, Insights and Forecast - by Communication Equipment
- 7.3.1. Car-to-Car
- 7.3.2. Car-to-Infrastructure
- 7.3.3. Others
- 7.1. Market Analysis, Insights and Forecast - by Component
- 8. Europe NA Internet of Cars Market Analysis, Insights and Forecast, 2019-2031
- 8.1. Market Analysis, Insights and Forecast - by Component
- 8.1.1. Hardware
- 8.1.2. Software
- 8.1.3. Service
- 8.2. Market Analysis, Insights and Forecast - by Technology
- 8.2.1. Wi-FI
- 8.2.2. Bluetooth
- 8.2.3. NFC
- 8.2.4. Cellular
- 8.2.5. Others
- 8.3. Market Analysis, Insights and Forecast - by Communication Equipment
- 8.3.1. Car-to-Car
- 8.3.2. Car-to-Infrastructure
- 8.3.3. Others
- 8.1. Market Analysis, Insights and Forecast - by Component
- 9. Middle East & Africa NA Internet of Cars Market Analysis, Insights and Forecast, 2019-2031
- 9.1. Market Analysis, Insights and Forecast - by Component
- 9.1.1. Hardware
- 9.1.2. Software
- 9.1.3. Service
- 9.2. Market Analysis, Insights and Forecast - by Technology
- 9.2.1. Wi-FI
- 9.2.2. Bluetooth
- 9.2.3. NFC
- 9.2.4. Cellular
- 9.2.5. Others
- 9.3. Market Analysis, Insights and Forecast - by Communication Equipment
- 9.3.1. Car-to-Car
- 9.3.2. Car-to-Infrastructure
- 9.3.3. Others
- 9.1. Market Analysis, Insights and Forecast - by Component
- 10. Asia Pacific NA Internet of Cars Market Analysis, Insights and Forecast, 2019-2031
- 10.1. Market Analysis, Insights and Forecast - by Component
- 10.1.1. Hardware
- 10.1.2. Software
- 10.1.3. Service
- 10.2. Market Analysis, Insights and Forecast - by Technology
- 10.2.1. Wi-FI
- 10.2.2. Bluetooth
- 10.2.3. NFC
- 10.2.4. Cellular
- 10.2.5. Others
- 10.3. Market Analysis, Insights and Forecast - by Communication Equipment
- 10.3.1. Car-to-Car
- 10.3.2. Car-to-Infrastructure
- 10.3.3. Others
- 10.1. Market Analysis, Insights and Forecast - by Component
- 11. North America NA Internet of Cars Market Analysis, Insights and Forecast, 2019-2031
- 11.1. Market Analysis, Insights and Forecast - By Country/Sub-region
- 11.1.1 United States
- 11.1.2 Canada
- 11.1.3 Mexico
- 12. Europe NA Internet of Cars Market Analysis, Insights and Forecast, 2019-2031
- 12.1. Market Analysis, Insights and Forecast - By Country/Sub-region
- 12.1.1 Germany
- 12.1.2 United Kingdom
- 12.1.3 France
- 12.1.4 Spain
- 12.1.5 Italy
- 12.1.6 Spain
- 12.1.7 Belgium
- 12.1.8 Netherland
- 12.1.9 Nordics
- 12.1.10 Rest of Europe
- 13. Asia Pacific NA Internet of Cars Market Analysis, Insights and Forecast, 2019-2031
- 13.1. Market Analysis, Insights and Forecast - By Country/Sub-region
- 13.1.1 China
- 13.1.2 Japan
- 13.1.3 India
- 13.1.4 South Korea
- 13.1.5 Southeast Asia
- 13.1.6 Australia
- 13.1.7 Indonesia
- 13.1.8 Phillipes
- 13.1.9 Singapore
- 13.1.10 Thailandc
- 13.1.11 Rest of Asia Pacific
- 14. South America NA Internet of Cars Market Analysis, Insights and Forecast, 2019-2031
- 14.1. Market Analysis, Insights and Forecast - By Country/Sub-region
- 14.1.1 Brazil
- 14.1.2 Argentina
- 14.1.3 Peru
- 14.1.4 Chile
- 14.1.5 Colombia
- 14.1.6 Ecuador
- 14.1.7 Venezuela
- 14.1.8 Rest of South America
- 15. North America NA Internet of Cars Market Analysis, Insights and Forecast, 2019-2031
- 15.1. Market Analysis, Insights and Forecast - By Country/Sub-region
- 15.1.1 United States
- 15.1.2 Canada
- 15.1.3 Mexico
- 16. MEA NA Internet of Cars Market Analysis, Insights and Forecast, 2019-2031
- 16.1. Market Analysis, Insights and Forecast - By Country/Sub-region
- 16.1.1 United Arab Emirates
- 16.1.2 Saudi Arabia
- 16.1.3 South Africa
- 16.1.4 Rest of Middle East and Africa
- 17. Competitive Analysis
- 17.1. Global Market Share Analysis 2024
- 17.2. Company Profiles
- 17.2.1 Cisco
- 17.2.1.1. Overview
- 17.2.1.2. Products
- 17.2.1.3. SWOT Analysis
- 17.2.1.4. Recent Developments
- 17.2.1.5. Financials (Based on Availability)
- 17.2.2 Volvo
- 17.2.2.1. Overview
- 17.2.2.2. Products
- 17.2.2.3. SWOT Analysis
- 17.2.2.4. Recent Developments
- 17.2.2.5. Financials (Based on Availability)
- 17.2.3 AT&T
- 17.2.3.1. Overview
- 17.2.3.2. Products
- 17.2.3.3. SWOT Analysis
- 17.2.3.4. Recent Developments
- 17.2.3.5. Financials (Based on Availability)
- 17.2.4 Google
- 17.2.4.1. Overview
- 17.2.4.2. Products
- 17.2.4.3. SWOT Analysis
- 17.2.4.4. Recent Developments
- 17.2.4.5. Financials (Based on Availability)
- 17.2.5 Tesla Motor
- 17.2.5.1. Overview
- 17.2.5.2. Products
- 17.2.5.3. SWOT Analysis
- 17.2.5.4. Recent Developments
- 17.2.5.5. Financials (Based on Availability)
- 17.2.6 Verizon
- 17.2.6.1. Overview
- 17.2.6.2. Products
- 17.2.6.3. SWOT Analysis
- 17.2.6.4. Recent Developments
- 17.2.6.5. Financials (Based on Availability)
- 17.2.7 Toyota
- 17.2.7.1. Overview
- 17.2.7.2. Products
- 17.2.7.3. SWOT Analysis
- 17.2.7.4. Recent Developments
- 17.2.7.5. Financials (Based on Availability)
- 17.2.8 IBM
- 17.2.8.1. Overview
- 17.2.8.2. Products
- 17.2.8.3. SWOT Analysis
- 17.2.8.4. Recent Developments
- 17.2.8.5. Financials (Based on Availability)
- 17.2.1 Cisco
List of Figures
- Figure 1: Global NA Internet of Cars Market Revenue Breakdown (Million, %) by Region 2024 & 2032
- Figure 2: North America NA Internet of Cars Market Revenue (Million), by Country 2024 & 2032
- Figure 3: North America NA Internet of Cars Market Revenue Share (%), by Country 2024 & 2032
- Figure 4: Europe NA Internet of Cars Market Revenue (Million), by Country 2024 & 2032
- Figure 5: Europe NA Internet of Cars Market Revenue Share (%), by Country 2024 & 2032
- Figure 6: Asia Pacific NA Internet of Cars Market Revenue (Million), by Country 2024 & 2032
- Figure 7: Asia Pacific NA Internet of Cars Market Revenue Share (%), by Country 2024 & 2032
- Figure 8: South America NA Internet of Cars Market Revenue (Million), by Country 2024 & 2032
- Figure 9: South America NA Internet of Cars Market Revenue Share (%), by Country 2024 & 2032
- Figure 10: North America NA Internet of Cars Market Revenue (Million), by Country 2024 & 2032
- Figure 11: North America NA Internet of Cars Market Revenue Share (%), by Country 2024 & 2032
- Figure 12: MEA NA Internet of Cars Market Revenue (Million), by Country 2024 & 2032
- Figure 13: MEA NA Internet of Cars Market Revenue Share (%), by Country 2024 & 2032
- Figure 14: North America NA Internet of Cars Market Revenue (Million), by Component 2024 & 2032
- Figure 15: North America NA Internet of Cars Market Revenue Share (%), by Component 2024 & 2032
- Figure 16: North America NA Internet of Cars Market Revenue (Million), by Technology 2024 & 2032
- Figure 17: North America NA Internet of Cars Market Revenue Share (%), by Technology 2024 & 2032
- Figure 18: North America NA Internet of Cars Market Revenue (Million), by Communication Equipment 2024 & 2032
- Figure 19: North America NA Internet of Cars Market Revenue Share (%), by Communication Equipment 2024 & 2032
- Figure 20: North America NA Internet of Cars Market Revenue (Million), by Country 2024 & 2032
- Figure 21: North America NA Internet of Cars Market Revenue Share (%), by Country 2024 & 2032
- Figure 22: South America NA Internet of Cars Market Revenue (Million), by Component 2024 & 2032
- Figure 23: South America NA Internet of Cars Market Revenue Share (%), by Component 2024 & 2032
- Figure 24: South America NA Internet of Cars Market Revenue (Million), by Technology 2024 & 2032
- Figure 25: South America NA Internet of Cars Market Revenue Share (%), by Technology 2024 & 2032
- Figure 26: South America NA Internet of Cars Market Revenue (Million), by Communication Equipment 2024 & 2032
- Figure 27: South America NA Internet of Cars Market Revenue Share (%), by Communication Equipment 2024 & 2032
- Figure 28: South America NA Internet of Cars Market Revenue (Million), by Country 2024 & 2032
- Figure 29: South America NA Internet of Cars Market Revenue Share (%), by Country 2024 & 2032
- Figure 30: Europe NA Internet of Cars Market Revenue (Million), by Component 2024 & 2032
- Figure 31: Europe NA Internet of Cars Market Revenue Share (%), by Component 2024 & 2032
- Figure 32: Europe NA Internet of Cars Market Revenue (Million), by Technology 2024 & 2032
- Figure 33: Europe NA Internet of Cars Market Revenue Share (%), by Technology 2024 & 2032
- Figure 34: Europe NA Internet of Cars Market Revenue (Million), by Communication Equipment 2024 & 2032
- Figure 35: Europe NA Internet of Cars Market Revenue Share (%), by Communication Equipment 2024 & 2032
- Figure 36: Europe NA Internet of Cars Market Revenue (Million), by Country 2024 & 2032
- Figure 37: Europe NA Internet of Cars Market Revenue Share (%), by Country 2024 & 2032
- Figure 38: Middle East & Africa NA Internet of Cars Market Revenue (Million), by Component 2024 & 2032
- Figure 39: Middle East & Africa NA Internet of Cars Market Revenue Share (%), by Component 2024 & 2032
- Figure 40: Middle East & Africa NA Internet of Cars Market Revenue (Million), by Technology 2024 & 2032
- Figure 41: Middle East & Africa NA Internet of Cars Market Revenue Share (%), by Technology 2024 & 2032
- Figure 42: Middle East & Africa NA Internet of Cars Market Revenue (Million), by Communication Equipment 2024 & 2032
- Figure 43: Middle East & Africa NA Internet of Cars Market Revenue Share (%), by Communication Equipment 2024 & 2032
- Figure 44: Middle East & Africa NA Internet of Cars Market Revenue (Million), by Country 2024 & 2032
- Figure 45: Middle East & Africa NA Internet of Cars Market Revenue Share (%), by Country 2024 & 2032
- Figure 46: Asia Pacific NA Internet of Cars Market Revenue (Million), by Component 2024 & 2032
- Figure 47: Asia Pacific NA Internet of Cars Market Revenue Share (%), by Component 2024 & 2032
- Figure 48: Asia Pacific NA Internet of Cars Market Revenue (Million), by Technology 2024 & 2032
- Figure 49: Asia Pacific NA Internet of Cars Market Revenue Share (%), by Technology 2024 & 2032
- Figure 50: Asia Pacific NA Internet of Cars Market Revenue (Million), by Communication Equipment 2024 & 2032
- Figure 51: Asia Pacific NA Internet of Cars Market Revenue Share (%), by Communication Equipment 2024 & 2032
- Figure 52: Asia Pacific NA Internet of Cars Market Revenue (Million), by Country 2024 & 2032
- Figure 53: Asia Pacific NA Internet of Cars Market Revenue Share (%), by Country 2024 & 2032
List of Tables
- Table 1: Global NA Internet of Cars Market Revenue Million Forecast, by Region 2019 & 2032
- Table 2: Global NA Internet of Cars Market Revenue Million Forecast, by Component 2019 & 2032
- Table 3: Global NA Internet of Cars Market Revenue Million Forecast, by Technology 2019 & 2032
- Table 4: Global NA Internet of Cars Market Revenue Million Forecast, by Communication Equipment 2019 & 2032
- Table 5: Global NA Internet of Cars Market Revenue Million Forecast, by Region 2019 & 2032
- Table 6: Global NA Internet of Cars Market Revenue Million Forecast, by Country 2019 & 2032
- Table 7: United States NA Internet of Cars Market Revenue (Million) Forecast, by Application 2019 & 2032
- Table 8: Canada NA Internet of Cars Market Revenue (Million) Forecast, by Application 2019 & 2032
- Table 9: Mexico NA Internet of Cars Market Revenue (Million) Forecast, by Application 2019 & 2032
- Table 10: Global NA Internet of Cars Market Revenue Million Forecast, by Country 2019 & 2032
- Table 11: Germany NA Internet of Cars Market Revenue (Million) Forecast, by Application 2019 & 2032
- Table 12: United Kingdom NA Internet of Cars Market Revenue (Million) Forecast, by Application 2019 & 2032
- Table 13: France NA Internet of Cars Market Revenue (Million) Forecast, by Application 2019 & 2032
- Table 14: Spain NA Internet of Cars Market Revenue (Million) Forecast, by Application 2019 & 2032
- Table 15: Italy NA Internet of Cars Market Revenue (Million) Forecast, by Application 2019 & 2032
- Table 16: Spain NA Internet of Cars Market Revenue (Million) Forecast, by Application 2019 & 2032
- Table 17: Belgium NA Internet of Cars Market Revenue (Million) Forecast, by Application 2019 & 2032
- Table 18: Netherland NA Internet of Cars Market Revenue (Million) Forecast, by Application 2019 & 2032
- Table 19: Nordics NA Internet of Cars Market Revenue (Million) Forecast, by Application 2019 & 2032
- Table 20: Rest of Europe NA Internet of Cars Market Revenue (Million) Forecast, by Application 2019 & 2032
- Table 21: Global NA Internet of Cars Market Revenue Million Forecast, by Country 2019 & 2032
- Table 22: China NA Internet of Cars Market Revenue (Million) Forecast, by Application 2019 & 2032
- Table 23: Japan NA Internet of Cars Market Revenue (Million) Forecast, by Application 2019 & 2032
- Table 24: India NA Internet of Cars Market Revenue (Million) Forecast, by Application 2019 & 2032
- Table 25: South Korea NA Internet of Cars Market Revenue (Million) Forecast, by Application 2019 & 2032
- Table 26: Southeast Asia NA Internet of Cars Market Revenue (Million) Forecast, by Application 2019 & 2032
- Table 27: Australia NA Internet of Cars Market Revenue (Million) Forecast, by Application 2019 & 2032
- Table 28: Indonesia NA Internet of Cars Market Revenue (Million) Forecast, by Application 2019 & 2032
- Table 29: Phillipes NA Internet of Cars Market Revenue (Million) Forecast, by Application 2019 & 2032
- Table 30: Singapore NA Internet of Cars Market Revenue (Million) Forecast, by Application 2019 & 2032
- Table 31: Thailandc NA Internet of Cars Market Revenue (Million) Forecast, by Application 2019 & 2032
- Table 32: Rest of Asia Pacific NA Internet of Cars Market Revenue (Million) Forecast, by Application 2019 & 2032
- Table 33: Global NA Internet of Cars Market Revenue Million Forecast, by Country 2019 & 2032
- Table 34: Brazil NA Internet of Cars Market Revenue (Million) Forecast, by Application 2019 & 2032
- Table 35: Argentina NA Internet of Cars Market Revenue (Million) Forecast, by Application 2019 & 2032
- Table 36: Peru NA Internet of Cars Market Revenue (Million) Forecast, by Application 2019 & 2032
- Table 37: Chile NA Internet of Cars Market Revenue (Million) Forecast, by Application 2019 & 2032
- Table 38: Colombia NA Internet of Cars Market Revenue (Million) Forecast, by Application 2019 & 2032
- Table 39: Ecuador NA Internet of Cars Market Revenue (Million) Forecast, by Application 2019 & 2032
- Table 40: Venezuela NA Internet of Cars Market Revenue (Million) Forecast, by Application 2019 & 2032
- Table 41: Rest of South America NA Internet of Cars Market Revenue (Million) Forecast, by Application 2019 & 2032
- Table 42: Global NA Internet of Cars Market Revenue Million Forecast, by Country 2019 & 2032
- Table 43: United States NA Internet of Cars Market Revenue (Million) Forecast, by Application 2019 & 2032
- Table 44: Canada NA Internet of Cars Market Revenue (Million) Forecast, by Application 2019 & 2032
- Table 45: Mexico NA Internet of Cars Market Revenue (Million) Forecast, by Application 2019 & 2032
- Table 46: Global NA Internet of Cars Market Revenue Million Forecast, by Country 2019 & 2032
- Table 47: United Arab Emirates NA Internet of Cars Market Revenue (Million) Forecast, by Application 2019 & 2032
- Table 48: Saudi Arabia NA Internet of Cars Market Revenue (Million) Forecast, by Application 2019 & 2032
- Table 49: South Africa NA Internet of Cars Market Revenue (Million) Forecast, by Application 2019 & 2032
- Table 50: Rest of Middle East and Africa NA Internet of Cars Market Revenue (Million) Forecast, by Application 2019 & 2032
- Table 51: Global NA Internet of Cars Market Revenue Million Forecast, by Component 2019 & 2032
- Table 52: Global NA Internet of Cars Market Revenue Million Forecast, by Technology 2019 & 2032
- Table 53: Global NA Internet of Cars Market Revenue Million Forecast, by Communication Equipment 2019 & 2032
- Table 54: Global NA Internet of Cars Market Revenue Million Forecast, by Country 2019 & 2032
- Table 55: United States NA Internet of Cars Market Revenue (Million) Forecast, by Application 2019 & 2032
- Table 56: Canada NA Internet of Cars Market Revenue (Million) Forecast, by Application 2019 & 2032
- Table 57: Mexico NA Internet of Cars Market Revenue (Million) Forecast, by Application 2019 & 2032
- Table 58: Global NA Internet of Cars Market Revenue Million Forecast, by Component 2019 & 2032
- Table 59: Global NA Internet of Cars Market Revenue Million Forecast, by Technology 2019 & 2032
- Table 60: Global NA Internet of Cars Market Revenue Million Forecast, by Communication Equipment 2019 & 2032
- Table 61: Global NA Internet of Cars Market Revenue Million Forecast, by Country 2019 & 2032
- Table 62: Brazil NA Internet of Cars Market Revenue (Million) Forecast, by Application 2019 & 2032
- Table 63: Argentina NA Internet of Cars Market Revenue (Million) Forecast, by Application 2019 & 2032
- Table 64: Rest of South America NA Internet of Cars Market Revenue (Million) Forecast, by Application 2019 & 2032
- Table 65: Global NA Internet of Cars Market Revenue Million Forecast, by Component 2019 & 2032
- Table 66: Global NA Internet of Cars Market Revenue Million Forecast, by Technology 2019 & 2032
- Table 67: Global NA Internet of Cars Market Revenue Million Forecast, by Communication Equipment 2019 & 2032
- Table 68: Global NA Internet of Cars Market Revenue Million Forecast, by Country 2019 & 2032
- Table 69: United Kingdom NA Internet of Cars Market Revenue (Million) Forecast, by Application 2019 & 2032
- Table 70: Germany NA Internet of Cars Market Revenue (Million) Forecast, by Application 2019 & 2032
- Table 71: France NA Internet of Cars Market Revenue (Million) Forecast, by Application 2019 & 2032
- Table 72: Italy NA Internet of Cars Market Revenue (Million) Forecast, by Application 2019 & 2032
- Table 73: Spain NA Internet of Cars Market Revenue (Million) Forecast, by Application 2019 & 2032
- Table 74: Russia NA Internet of Cars Market Revenue (Million) Forecast, by Application 2019 & 2032
- Table 75: Benelux NA Internet of Cars Market Revenue (Million) Forecast, by Application 2019 & 2032
- Table 76: Nordics NA Internet of Cars Market Revenue (Million) Forecast, by Application 2019 & 2032
- Table 77: Rest of Europe NA Internet of Cars Market Revenue (Million) Forecast, by Application 2019 & 2032
- Table 78: Global NA Internet of Cars Market Revenue Million Forecast, by Component 2019 & 2032
- Table 79: Global NA Internet of Cars Market Revenue Million Forecast, by Technology 2019 & 2032
- Table 80: Global NA Internet of Cars Market Revenue Million Forecast, by Communication Equipment 2019 & 2032
- Table 81: Global NA Internet of Cars Market Revenue Million Forecast, by Country 2019 & 2032
- Table 82: Turkey NA Internet of Cars Market Revenue (Million) Forecast, by Application 2019 & 2032
- Table 83: Israel NA Internet of Cars Market Revenue (Million) Forecast, by Application 2019 & 2032
- Table 84: GCC NA Internet of Cars Market Revenue (Million) Forecast, by Application 2019 & 2032
- Table 85: North Africa NA Internet of Cars Market Revenue (Million) Forecast, by Application 2019 & 2032
- Table 86: South Africa NA Internet of Cars Market Revenue (Million) Forecast, by Application 2019 & 2032
- Table 87: Rest of Middle East & Africa NA Internet of Cars Market Revenue (Million) Forecast, by Application 2019 & 2032
- Table 88: Global NA Internet of Cars Market Revenue Million Forecast, by Component 2019 & 2032
- Table 89: Global NA Internet of Cars Market Revenue Million Forecast, by Technology 2019 & 2032
- Table 90: Global NA Internet of Cars Market Revenue Million Forecast, by Communication Equipment 2019 & 2032
- Table 91: Global NA Internet of Cars Market Revenue Million Forecast, by Country 2019 & 2032
- Table 92: China NA Internet of Cars Market Revenue (Million) Forecast, by Application 2019 & 2032
- Table 93: India NA Internet of Cars Market Revenue (Million) Forecast, by Application 2019 & 2032
- Table 94: Japan NA Internet of Cars Market Revenue (Million) Forecast, by Application 2019 & 2032
- Table 95: South Korea NA Internet of Cars Market Revenue (Million) Forecast, by Application 2019 & 2032
- Table 96: ASEAN NA Internet of Cars Market Revenue (Million) Forecast, by Application 2019 & 2032
- Table 97: Oceania NA Internet of Cars Market Revenue (Million) Forecast, by Application 2019 & 2032
- Table 98: Rest of Asia Pacific NA Internet of Cars Market Revenue (Million) Forecast, by Application 2019 & 2032
Frequently Asked Questions
1. What is the projected Compound Annual Growth Rate (CAGR) of the NA Internet of Cars Market?
The projected CAGR is approximately 24.50%.
2. Which companies are prominent players in the NA Internet of Cars Market?
Key companies in the market include Cisco, Volvo, AT&T, Google, Tesla Motor, Verizon, Toyota, IBM.
3. What are the main segments of the NA Internet of Cars Market?
The market segments include Component, Technology, Communication Equipment.
4. Can you provide details about the market size?
The market size is estimated to be USD XX Million as of 2022.
5. What are some drivers contributing to market growth?
Increasing Demand for Data Storage and Adoption of Cloud Computing; Need for High Speed Data Transfer; Increasing Demand of Fabric Switches.
6. What are the notable trends driving market growth?
North American Market is expected to be driven by Vehicle Safety Norms.
7. Are there any restraints impacting market growth?
Security issues.
8. Can you provide examples of recent developments in the market?
October 2021 - Kia America has rebranded its long-standing in-vehicle and app-based telematics system from "UVO" to "Kia Connect" in line with the direction of the new future-oriented brand of automakers centered on electrification. The renaming emphasizes the importance of connectivity. Since the 2022 model, one or more configurations of each Kia vehicle will have access to Kia Connect. The brand has increased the number of connected cars 40-fold from 15,000 in 2018 to an estimated 600,000 by the end of 2021.
9. What pricing options are available for accessing the report?
Pricing options include single-user, multi-user, and enterprise licenses priced at USD 4750, USD 5250, and USD 8750 respectively.
10. Is the market size provided in terms of value or volume?
The market size is provided in terms of value, measured in Million.
11. Are there any specific market keywords associated with the report?
Yes, the market keyword associated with the report is "NA Internet of Cars Market," which aids in identifying and referencing the specific market segment covered.
12. How do I determine which pricing option suits my needs best?
The pricing options vary based on user requirements and access needs. Individual users may opt for single-user licenses, while businesses requiring broader access may choose multi-user or enterprise licenses for cost-effective access to the report.
13. Are there any additional resources or data provided in the NA Internet of Cars Market report?
While the report offers comprehensive insights, it's advisable to review the specific contents or supplementary materials provided to ascertain if additional resources or data are available.
14. How can I stay updated on further developments or reports in the NA Internet of Cars Market?
To stay informed about further developments, trends, and reports in the NA Internet of Cars Market, consider subscribing to industry newsletters, following relevant companies and organizations, or regularly checking reputable industry news sources and publications.
Methodology
Step 1 - Identification of Relevant Samples Size from Population Database


Step 2 - Approaches for Defining Global Market Size (Value, Volume* & Price*)

Note*: In applicable scenarios
Step 3 - Data Sources
Primary Research
- Web Analytics
- Survey Reports
- Research Institute
- Latest Research Reports
- Opinion Leaders
Secondary Research
- Annual Reports
- White Paper
- Latest Press Release
- Industry Association
- Paid Database
- Investor Presentations

Step 4 - Data Triangulation
Involves using different sources of information in order to increase the validity of a study
These sources are likely to be stakeholders in a program - participants, other researchers, program staff, other community members, and so on.
Then we put all data in single framework & apply various statistical tools to find out the dynamic on the market.
During the analysis stage, feedback from the stakeholder groups would be compared to determine areas of agreement as well as areas of divergence


