
Key Insights
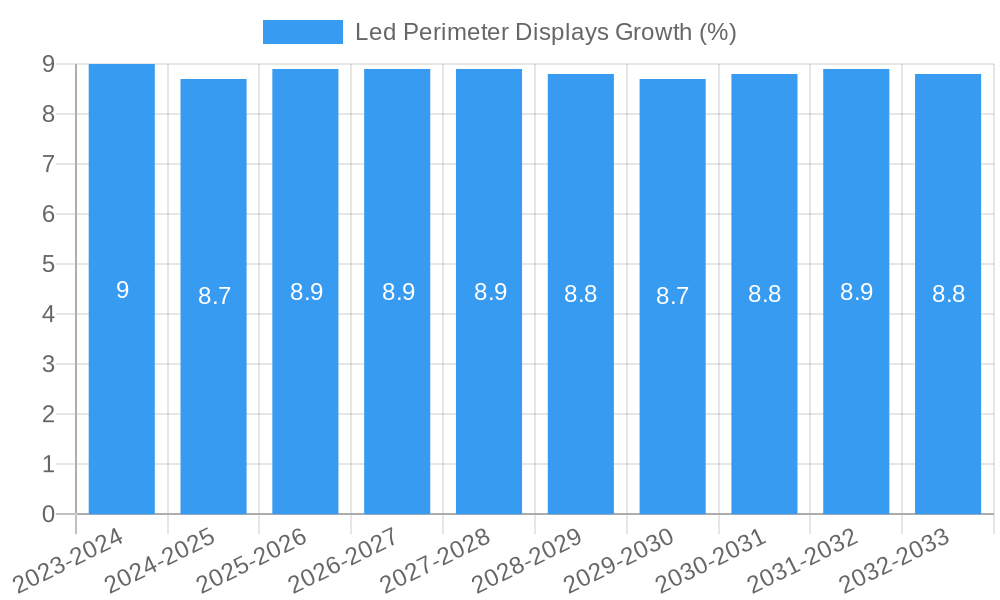
The global LED perimeter display market is poised for robust expansion, projected to reach an estimated market size of approximately USD 2.5 billion by 2025, with a significant Compound Annual Growth Rate (CAGR) of around 8.5% expected throughout the forecast period of 2025-2033. This dynamic growth is primarily fueled by the increasing adoption of these displays in sports stadiums and arenas for enhanced fan engagement, real-time scoring, and dynamic advertising. The escalating demand for immersive visual experiences in leisure facilities, visitor attractions, and exhibition halls further bolsters market prospects. Advancements in LED technology, leading to brighter, more energy-efficient, and higher-resolution displays, are also key drivers. The integration of these displays into outdoor advertising infrastructure, offering flexibility and impact, is another significant growth contributor, especially in urban environments.
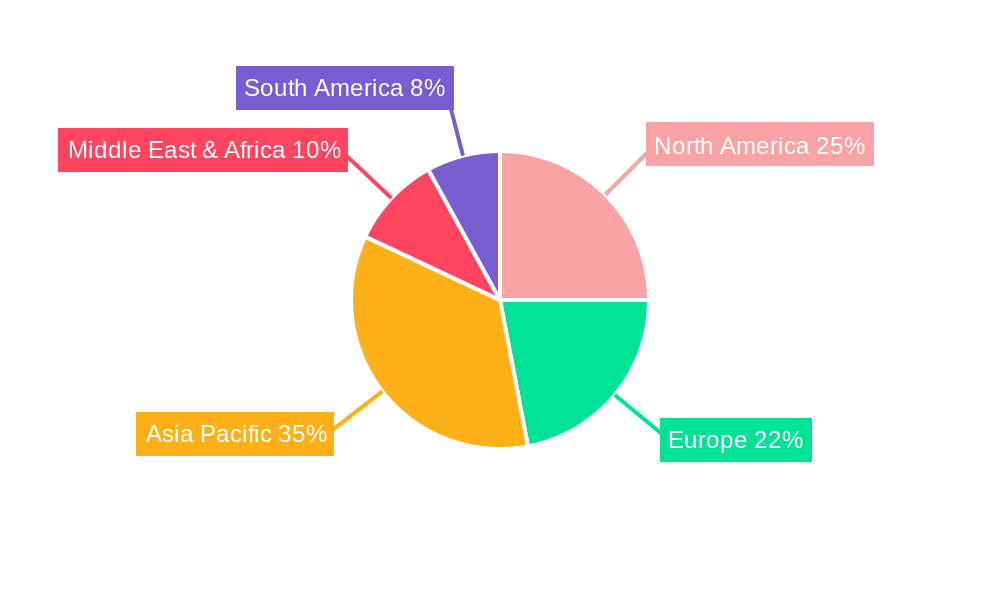
Despite the promising outlook, certain factors could temper growth. The high initial investment cost associated with sophisticated LED perimeter display systems and the ongoing maintenance requirements present a considerable restraint. Furthermore, the complexity of integration with existing broadcast and control systems can pose challenges for widespread adoption. However, these challenges are being addressed by technological innovations aimed at reducing costs and simplifying implementation. The market is segmented into indoor and outdoor applications, with outdoor applications, particularly in stadiums and advertising, currently dominating revenue streams due to their visibility and impact. Key players like Daktronics, LG, Samsung, and Panasonic are actively investing in research and development to introduce innovative solutions and expand their global footprint. The Asia Pacific region, led by China, is anticipated to be a significant growth engine due to rapid infrastructure development and a burgeoning sports and entertainment industry.
This in-depth report provides a granular analysis of the global LED Perimeter Displays market, offering invaluable insights for industry stakeholders. Covering a study period from 2019 to 2033, with a base and estimated year of 2025, this report delves into market dynamics, growth trajectories, dominant segments, technological innovations, and competitive landscapes. With a forecast period spanning from 2025 to 2033, it equips businesses with actionable intelligence to navigate this rapidly evolving sector. The report meticulously examines key segments such as Sports Stadiums & Arenas, Outdoor Billboards & Advertising, Exhibition & Conference Halls, Leisure Facilities & Visitor Attractions, and Other applications, as well as Indoor and Outdoor display types.
Led Perimeter Displays Market Structure & Competitive Dynamics
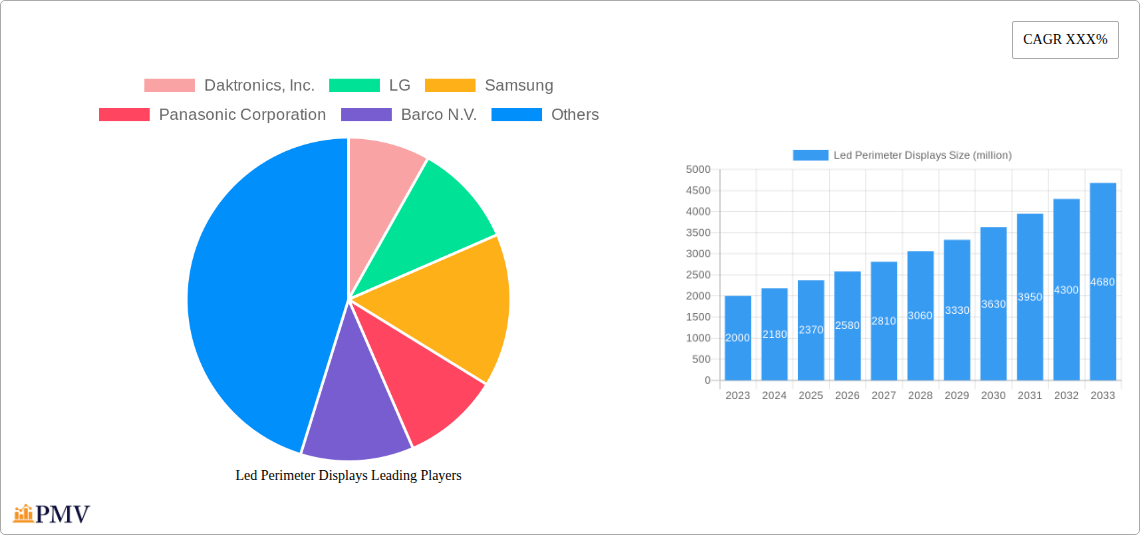
The LED Perimeter Displays market exhibits a moderately concentrated structure, with a few dominant players like Daktronics, Inc., LG, and Samsung holding significant market share, estimated in the hundreds of millions of dollars. However, a robust ecosystem of regional and specialized manufacturers, including Vegas LED Screens, Euro Display Srl, and Focono Optoelectronics Co., Ltd., fosters healthy competition and innovation. The industry's innovation ecosystem is characterized by continuous advancements in pixel pitch, brightness, energy efficiency, and interactive capabilities, driving substantial R&D investments, projected to reach over a billion dollars annually. Regulatory frameworks, while generally supportive of digital signage adoption, can vary by region, impacting deployment timelines and costs. Product substitutes, primarily traditional static signage and other digital display technologies, are being increasingly displaced by the superior visual impact and flexibility of LED perimeter displays. End-user trends reveal a strong demand for immersive fan experiences in sports venues and dynamic advertising solutions in urban centers, fueling market growth. Mergers and acquisitions (M&A) activity is a significant aspect of market consolidation, with deal values frequently exceeding fifty million dollars as larger companies acquire innovative smaller firms to expand their technological portfolios and market reach. The total M&A value in the historical period reached approximately two hundred million dollars.
Led Perimeter Displays Industry Trends & Insights
The global LED Perimeter Displays market is experiencing a remarkable growth trajectory, driven by escalating demand for dynamic and engaging visual communication across various sectors. This market is projected to witness a Compound Annual Growth Rate (CAGR) of approximately 15% over the forecast period. Key growth drivers include the increasing adoption of LED perimeter displays in professional sports stadiums and arenas to enhance fan engagement through real-time replays, dynamic advertising, and interactive content. The proliferation of smart cities and the growing emphasis on out-of-home (OOH) advertising also contribute significantly to market expansion, with outdoor billboard applications seeing substantial investment, estimated in the billions of dollars. Technological disruptions are at the forefront, with continuous improvements in LED chip technology leading to higher resolutions, increased brightness, enhanced energy efficiency, and lower operational costs. The development of modular and flexible LED panels allows for greater design versatility, enabling custom installations that cater to unique venue architectures. Consumer preferences are shifting towards richer, more interactive visual experiences, which LED perimeter displays are uniquely positioned to deliver. Competitive dynamics are intensifying, with manufacturers focusing on product differentiation through advanced features, software integration for content management, and comprehensive service offerings. The market penetration of LED perimeter displays is steadily increasing, moving beyond niche applications to become a standard feature in modern venues and advertising spaces. The total market size in the estimated year is projected to be in the range of ten billion dollars.
Dominant Markets & Segments in Led Perimeter Displays
The Sports Stadiums & Arenas segment stands out as the dominant market within the LED Perimeter Displays industry, driven by a confluence of factors that make it a prime area for deployment. The sheer scale of these venues, coupled with the imperative to provide an unparalleled fan experience, necessitates the integration of high-impact visual solutions.
- Key Drivers in Sports Stadiums & Arenas:
- Fan Engagement & Experience Enhancement: Live replays, instant statistics, interactive polls, and dynamic advertisements create an immersive atmosphere. The value of enhanced fan experience is incalculable but translates to increased ticket sales and merchandise revenue, indirectly boosting display investment.
- Revenue Generation: Perimeter LED screens are a crucial platform for lucrative advertising opportunities, generating hundreds of millions of dollars annually for stadiums. Sponsorship deals are directly tied to the visibility provided by these displays.
- Technological Advancements: The continuous evolution of LED technology, including higher pixel densities and brighter displays, allows for sharper, more vibrant content that captivates audiences.
- Global Sporting Event Hosting: Major international sporting events often spur significant investment in stadium infrastructure, including LED perimeter displays, with billions of dollars poured into upgrades.
The Outdoor Billboards & Advertising segment also commands a substantial share of the market. The increasing urbanization and the need for impactful, attention-grabbing advertisements in public spaces are fueling its growth. The ability to display dynamic content, rotate advertisements, and target specific demographics makes LED perimeter billboards highly attractive to advertisers.
- Key Drivers in Outdoor Billboards & Advertising:
- High Visibility & Reach: Prime urban locations ensure maximum audience exposure, with advertising revenues often reaching tens of millions of dollars per major location annually.
- Dynamic Content Capabilities: Ability to display video, animations, and real-time updates far surpasses static billboards.
- Cost-Effectiveness Over Time: Despite higher initial investment, the flexibility and revenue potential often make them more cost-effective than traditional methods over their lifespan.
- Digital Transformation in Advertising: A broader industry shift towards digital OOH advertising.
The Type: Outdoor segment generally leads due to the widespread application in stadiums and advertising, although Type: Indoor displays are gaining traction in exhibition halls and leisure facilities. The Application: Exhibition & Conference Halls is witnessing robust growth due to the increasing need for visually engaging product showcases and presentations, with investments in this area projected to reach hundreds of millions of dollars. Leisure Facilities & Visitor Attractions are also adopting these displays to enhance visitor engagement and provide informative content, contributing significantly to market expansion.
Led Perimeter Displays Product Innovations
Recent product innovations in LED perimeter displays focus on enhancing visual quality, operational efficiency, and user interactivity. Manufacturers are pushing the boundaries of ultra-fine pixel pitch technology, enabling clearer and more detailed imagery, particularly crucial for close-proximity viewing in indoor applications. Advancements in brightness and contrast ratios ensure exceptional visibility even in direct sunlight or high-ambient light conditions, critical for outdoor stadium and advertising deployments. The integration of advanced content management software allows for seamless scheduling, real-time updates, and personalized advertising campaigns, adding significant value. Furthermore, the development of energy-efficient LED chips and power supplies is reducing operational costs and environmental impact, making these solutions more sustainable. Modular and flexible design options are also a key trend, enabling custom-fit installations for diverse architectural requirements, from curved stadium perimeters to intricate exhibition booth designs. These innovations collectively enhance competitive advantages by offering superior performance, greater flexibility, and improved return on investment for clients, with the total market value of these innovations estimated in the billions of dollars.
Report Segmentation & Scope
This report segment includes a comprehensive analysis of the LED Perimeter Displays market across various categories. The Application segments include Sports Stadiums & Arenas, Outdoor Billboards & Advertising, Exhibition & Conference Halls, Leisure Facilities & Visitor Attractions, and Other applications, each with distinct growth projections and market sizes, estimated in the billions for sports and advertising, and hundreds of millions for others. The Type segments are Indoor and Outdoor displays. For Sports Stadiums & Arenas, the market is projected to grow significantly, driven by fan engagement and revenue generation. Outdoor Billboards & Advertising is expected to see sustained growth due to its high visibility and advertising potential. Exhibition & Conference Halls are growing rapidly as businesses seek more dynamic presentation tools. Leisure Facilities & Visitor Attractions are increasingly adopting these displays for enhanced visitor experiences. The Other category encompasses diverse niche applications. Both Indoor and Outdoor types contribute to the overall market, with outdoor applications currently holding a larger share due to stadium and advertising demands, though indoor segment growth is accelerating with advancements in pixel pitch and applications.
Key Drivers of Led Perimeter Displays Growth
The growth of the LED Perimeter Displays sector is propelled by a synergistic interplay of technological, economic, and regulatory factors. Technologically, the continuous evolution of LED chip efficiency, resolution, and brightness is a primary driver, making displays more visually impactful and cost-effective to operate. Economically, the increasing investment in sports infrastructure globally and the rising demand for effective out-of-home advertising are significant catalysts. For instance, major sporting events often lead to billions of dollars in stadium upgrades, a substantial portion of which is allocated to visual technologies. Regulatory factors, such as government initiatives promoting digital infrastructure and smart city development, also play a role by creating a favorable environment for the adoption of advanced display solutions. The growing M&A activities indicate a healthy market with substantial investment potential, with deal values often in the tens of millions of dollars.
Challenges in the Led Perimeter Displays Sector
Despite its robust growth, the LED Perimeter Displays sector faces several challenges that could impede its expansion. High initial capital investment remains a significant barrier for some potential adopters, especially smaller venues or businesses, with system costs frequently running into hundreds of thousands to millions of dollars. Supply chain disruptions, as experienced in recent years, can lead to increased component costs and extended lead times, impacting project timelines. Intense competition from established players and emerging manufacturers can put pressure on profit margins and necessitate continuous innovation. Technical complexities in installation and maintenance, particularly for large-scale outdoor deployments, require specialized expertise. Furthermore, evolving regulations regarding outdoor advertising and digital signage content can introduce compliance challenges. The estimated financial impact of supply chain issues has been in the tens of millions of dollars globally.
Leading Players in the Led Perimeter Displays Market
- Daktronics, Inc.
- LG
- Samsung
- Panasonic Corporation
- Barco N.V.
- Sony Corporation
- Vegas LED Screens
- Mitsubishi Electric Corporation
- Leyard Optoelectronic Co., Ltd.
- Euro Display Srl
- Focono Optoelectronics Co., Ltd.
- Pro Display
- Bodet Sport
- Kabuki-scifi
- Xiamen Qiangli Jucai Opto-Electronic Technology Co., Ltd.
- Shenzhen EASTAR Electronic Co., Ltd.
- Shenzhen Dicolor Optoelectronics Co., Ltd.
- Shenzhen YUCHIP Lighting Co.,LTD
- Shenzhen LCF Technology Co.,LTD
- Stadium LED Screens.
- Liantronics CO.,LTD.
- Lyson Optoelectronics Co.,Limited
- Jie Yu Industrial Company
Key Developments in Led Perimeter Displays Sector
- 2023 January: LG launches its new generation of outdoor LED signage with enhanced brightness and energy efficiency, aiming to capture a larger share of the advertising market.
- 2023 April: Daktronics, Inc. announces a significant expansion of its manufacturing capabilities to meet growing demand for high-resolution LED displays in sports venues, with an investment of over fifty million dollars.
- 2023 June: Samsung introduces a new line of transparent LED displays for creative architectural and retail applications, opening up new market segments.
- 2024 February: Barco N.V. acquires a specialized LED integration firm to strengthen its portfolio in large-scale event and broadcast solutions.
- 2024 May: Leyard Optoelectronic Co., Ltd. announces a strategic partnership with a leading content management software provider to offer integrated display solutions.
- 2024 October: Euro Display Srl unveils innovative modular LED panels designed for rapid deployment and flexibility in exhibition settings.
- 2025 March: The European Union proposes new regulations for digital advertising, potentially impacting outdoor LED billboard deployments and requiring significant adjustments, estimated to cost hundreds of millions of euros in compliance across the continent.
Strategic Led Perimeter Displays Market Outlook
The strategic outlook for the LED Perimeter Displays market is exceptionally positive, driven by sustained innovation and expanding application horizons. The ongoing advancements in pixel pitch, brightness, and energy efficiency will continue to make these displays more attractive for both new installations and upgrades. Growth accelerators include the increasing global appetite for immersive entertainment experiences in sports and leisure, coupled with the unstoppable shift towards digital out-of-home advertising. Strategic opportunities lie in developing integrated solutions that combine hardware with advanced software for content management, data analytics, and interactive functionalities. The global expansion of smart city initiatives will also present significant potential for public display deployments. Furthermore, a focus on sustainability and reduced TCO will be crucial for market leadership. The market is poised for continued expansion, with projections indicating a doubling of its current market size within the next seven years, reaching well over twenty billion dollars.
Led Perimeter Displays Segmentation
-
1. Application
- 1.1. Sports Stadiums & Arenas
- 1.2. Outdoor Billboards & Advertising
- 1.3. Exhibition & Conference Halls
- 1.4. Leisure Facilities & Visitor Attractions
- 1.5. Other
-
2. Type
- 2.1. Indoor
- 2.2. Outdoor
Led Perimeter Displays Segmentation By Geography
-
1. North America
- 1.1. United States
- 1.2. Canada
- 1.3. Mexico
-
2. South America
- 2.1. Brazil
- 2.2. Argentina
- 2.3. Rest of South America
-
3. Europe
- 3.1. United Kingdom
- 3.2. Germany
- 3.3. France
- 3.4. Italy
- 3.5. Spain
- 3.6. Russia
- 3.7. Benelux
- 3.8. Nordics
- 3.9. Rest of Europe
-
4. Middle East & Africa
- 4.1. Turkey
- 4.2. Israel
- 4.3. GCC
- 4.4. North Africa
- 4.5. South Africa
- 4.6. Rest of Middle East & Africa
-
5. Asia Pacific
- 5.1. China
- 5.2. India
- 5.3. Japan
- 5.4. South Korea
- 5.5. ASEAN
- 5.6. Oceania
- 5.7. Rest of Asia Pacific
Led Perimeter Displays REPORT HIGHLIGHTS
| Aspects | Details |
|---|---|
| Study Period | 2019-2033 |
| Base Year | 2024 |
| Estimated Year | 2025 |
| Forecast Period | 2025-2033 |
| Historical Period | 2019-2024 |
| Growth Rate | CAGR of XXX% from 2019-2033 |
| Segmentation |
|
Table of Contents
- 1. Introduction
- 1.1. Research Scope
- 1.2. Market Segmentation
- 1.3. Research Methodology
- 1.4. Definitions and Assumptions
- 2. Executive Summary
- 2.1. Introduction
- 3. Market Dynamics
- 3.1. Introduction
- 3.2. Market Drivers
- 3.3. Market Restrains
- 3.4. Market Trends
- 4. Market Factor Analysis
- 4.1. Porters Five Forces
- 4.2. Supply/Value Chain
- 4.3. PESTEL analysis
- 4.4. Market Entropy
- 4.5. Patent/Trademark Analysis
- 5. Global Led Perimeter Displays Analysis, Insights and Forecast, 2019-2031
- 5.1. Market Analysis, Insights and Forecast - by Application
- 5.1.1. Sports Stadiums & Arenas
- 5.1.2. Outdoor Billboards & Advertising
- 5.1.3. Exhibition & Conference Halls
- 5.1.4. Leisure Facilities & Visitor Attractions
- 5.1.5. Other
- 5.2. Market Analysis, Insights and Forecast - by Type
- 5.2.1. Indoor
- 5.2.2. Outdoor
- 5.3. Market Analysis, Insights and Forecast - by Region
- 5.3.1. North America
- 5.3.2. South America
- 5.3.3. Europe
- 5.3.4. Middle East & Africa
- 5.3.5. Asia Pacific
- 5.1. Market Analysis, Insights and Forecast - by Application
- 6. North America Led Perimeter Displays Analysis, Insights and Forecast, 2019-2031
- 6.1. Market Analysis, Insights and Forecast - by Application
- 6.1.1. Sports Stadiums & Arenas
- 6.1.2. Outdoor Billboards & Advertising
- 6.1.3. Exhibition & Conference Halls
- 6.1.4. Leisure Facilities & Visitor Attractions
- 6.1.5. Other
- 6.2. Market Analysis, Insights and Forecast - by Type
- 6.2.1. Indoor
- 6.2.2. Outdoor
- 6.1. Market Analysis, Insights and Forecast - by Application
- 7. South America Led Perimeter Displays Analysis, Insights and Forecast, 2019-2031
- 7.1. Market Analysis, Insights and Forecast - by Application
- 7.1.1. Sports Stadiums & Arenas
- 7.1.2. Outdoor Billboards & Advertising
- 7.1.3. Exhibition & Conference Halls
- 7.1.4. Leisure Facilities & Visitor Attractions
- 7.1.5. Other
- 7.2. Market Analysis, Insights and Forecast - by Type
- 7.2.1. Indoor
- 7.2.2. Outdoor
- 7.1. Market Analysis, Insights and Forecast - by Application
- 8. Europe Led Perimeter Displays Analysis, Insights and Forecast, 2019-2031
- 8.1. Market Analysis, Insights and Forecast - by Application
- 8.1.1. Sports Stadiums & Arenas
- 8.1.2. Outdoor Billboards & Advertising
- 8.1.3. Exhibition & Conference Halls
- 8.1.4. Leisure Facilities & Visitor Attractions
- 8.1.5. Other
- 8.2. Market Analysis, Insights and Forecast - by Type
- 8.2.1. Indoor
- 8.2.2. Outdoor
- 8.1. Market Analysis, Insights and Forecast - by Application
- 9. Middle East & Africa Led Perimeter Displays Analysis, Insights and Forecast, 2019-2031
- 9.1. Market Analysis, Insights and Forecast - by Application
- 9.1.1. Sports Stadiums & Arenas
- 9.1.2. Outdoor Billboards & Advertising
- 9.1.3. Exhibition & Conference Halls
- 9.1.4. Leisure Facilities & Visitor Attractions
- 9.1.5. Other
- 9.2. Market Analysis, Insights and Forecast - by Type
- 9.2.1. Indoor
- 9.2.2. Outdoor
- 9.1. Market Analysis, Insights and Forecast - by Application
- 10. Asia Pacific Led Perimeter Displays Analysis, Insights and Forecast, 2019-2031
- 10.1. Market Analysis, Insights and Forecast - by Application
- 10.1.1. Sports Stadiums & Arenas
- 10.1.2. Outdoor Billboards & Advertising
- 10.1.3. Exhibition & Conference Halls
- 10.1.4. Leisure Facilities & Visitor Attractions
- 10.1.5. Other
- 10.2. Market Analysis, Insights and Forecast - by Type
- 10.2.1. Indoor
- 10.2.2. Outdoor
- 10.1. Market Analysis, Insights and Forecast - by Application
- 11. Competitive Analysis
- 11.1. Global Market Share Analysis 2024
- 11.2. Company Profiles
- 11.2.1 Daktronics Inc.
- 11.2.1.1. Overview
- 11.2.1.2. Products
- 11.2.1.3. SWOT Analysis
- 11.2.1.4. Recent Developments
- 11.2.1.5. Financials (Based on Availability)
- 11.2.2 LG
- 11.2.2.1. Overview
- 11.2.2.2. Products
- 11.2.2.3. SWOT Analysis
- 11.2.2.4. Recent Developments
- 11.2.2.5. Financials (Based on Availability)
- 11.2.3 Samsung
- 11.2.3.1. Overview
- 11.2.3.2. Products
- 11.2.3.3. SWOT Analysis
- 11.2.3.4. Recent Developments
- 11.2.3.5. Financials (Based on Availability)
- 11.2.4 Panasonic Corporation
- 11.2.4.1. Overview
- 11.2.4.2. Products
- 11.2.4.3. SWOT Analysis
- 11.2.4.4. Recent Developments
- 11.2.4.5. Financials (Based on Availability)
- 11.2.5 Barco N.V.
- 11.2.5.1. Overview
- 11.2.5.2. Products
- 11.2.5.3. SWOT Analysis
- 11.2.5.4. Recent Developments
- 11.2.5.5. Financials (Based on Availability)
- 11.2.6 Sony Corporation
- 11.2.6.1. Overview
- 11.2.6.2. Products
- 11.2.6.3. SWOT Analysis
- 11.2.6.4. Recent Developments
- 11.2.6.5. Financials (Based on Availability)
- 11.2.7 Vegas LED Screens
- 11.2.7.1. Overview
- 11.2.7.2. Products
- 11.2.7.3. SWOT Analysis
- 11.2.7.4. Recent Developments
- 11.2.7.5. Financials (Based on Availability)
- 11.2.8 Mitsubishi Electric Corporation
- 11.2.8.1. Overview
- 11.2.8.2. Products
- 11.2.8.3. SWOT Analysis
- 11.2.8.4. Recent Developments
- 11.2.8.5. Financials (Based on Availability)
- 11.2.9 Leyard Optoelectronic Co. Ltd.
- 11.2.9.1. Overview
- 11.2.9.2. Products
- 11.2.9.3. SWOT Analysis
- 11.2.9.4. Recent Developments
- 11.2.9.5. Financials (Based on Availability)
- 11.2.10 Euro Display Srl
- 11.2.10.1. Overview
- 11.2.10.2. Products
- 11.2.10.3. SWOT Analysis
- 11.2.10.4. Recent Developments
- 11.2.10.5. Financials (Based on Availability)
- 11.2.11 Focono Optoelectronics Co. Ltd.
- 11.2.11.1. Overview
- 11.2.11.2. Products
- 11.2.11.3. SWOT Analysis
- 11.2.11.4. Recent Developments
- 11.2.11.5. Financials (Based on Availability)
- 11.2.12 Pro Display
- 11.2.12.1. Overview
- 11.2.12.2. Products
- 11.2.12.3. SWOT Analysis
- 11.2.12.4. Recent Developments
- 11.2.12.5. Financials (Based on Availability)
- 11.2.13 Bodet Sport
- 11.2.13.1. Overview
- 11.2.13.2. Products
- 11.2.13.3. SWOT Analysis
- 11.2.13.4. Recent Developments
- 11.2.13.5. Financials (Based on Availability)
- 11.2.14 Kabuki-scifi
- 11.2.14.1. Overview
- 11.2.14.2. Products
- 11.2.14.3. SWOT Analysis
- 11.2.14.4. Recent Developments
- 11.2.14.5. Financials (Based on Availability)
- 11.2.15 Xiamen Qiangli Jucai Opto-Electronic Technology Co. Ltd.
- 11.2.15.1. Overview
- 11.2.15.2. Products
- 11.2.15.3. SWOT Analysis
- 11.2.15.4. Recent Developments
- 11.2.15.5. Financials (Based on Availability)
- 11.2.16 Shenzhen EASTAR Electronic Co. Ltd.
- 11.2.16.1. Overview
- 11.2.16.2. Products
- 11.2.16.3. SWOT Analysis
- 11.2.16.4. Recent Developments
- 11.2.16.5. Financials (Based on Availability)
- 11.2.17 Shenzhen Dicolor Optoelectronics Co. Ltd.
- 11.2.17.1. Overview
- 11.2.17.2. Products
- 11.2.17.3. SWOT Analysis
- 11.2.17.4. Recent Developments
- 11.2.17.5. Financials (Based on Availability)
- 11.2.18 Shenzhen YUCHIP Lighting Co.LTD
- 11.2.18.1. Overview
- 11.2.18.2. Products
- 11.2.18.3. SWOT Analysis
- 11.2.18.4. Recent Developments
- 11.2.18.5. Financials (Based on Availability)
- 11.2.19 Shenzhen LCF Technology Co.LTD
- 11.2.19.1. Overview
- 11.2.19.2. Products
- 11.2.19.3. SWOT Analysis
- 11.2.19.4. Recent Developments
- 11.2.19.5. Financials (Based on Availability)
- 11.2.20 Stadium LED Screens.
- 11.2.20.1. Overview
- 11.2.20.2. Products
- 11.2.20.3. SWOT Analysis
- 11.2.20.4. Recent Developments
- 11.2.20.5. Financials (Based on Availability)
- 11.2.21 Liantronics CO.LTD.
- 11.2.21.1. Overview
- 11.2.21.2. Products
- 11.2.21.3. SWOT Analysis
- 11.2.21.4. Recent Developments
- 11.2.21.5. Financials (Based on Availability)
- 11.2.22 Lyson Optoelectronics Co.Limited
- 11.2.22.1. Overview
- 11.2.22.2. Products
- 11.2.22.3. SWOT Analysis
- 11.2.22.4. Recent Developments
- 11.2.22.5. Financials (Based on Availability)
- 11.2.23 Jie Yu Industrial Company
- 11.2.23.1. Overview
- 11.2.23.2. Products
- 11.2.23.3. SWOT Analysis
- 11.2.23.4. Recent Developments
- 11.2.23.5. Financials (Based on Availability)
- 11.2.1 Daktronics Inc.
List of Figures
- Figure 1: Global Led Perimeter Displays Revenue Breakdown (million, %) by Region 2024 & 2032
- Figure 2: Global Led Perimeter Displays Volume Breakdown (K, %) by Region 2024 & 2032
- Figure 3: North America Led Perimeter Displays Revenue (million), by Application 2024 & 2032
- Figure 4: North America Led Perimeter Displays Volume (K), by Application 2024 & 2032
- Figure 5: North America Led Perimeter Displays Revenue Share (%), by Application 2024 & 2032
- Figure 6: North America Led Perimeter Displays Volume Share (%), by Application 2024 & 2032
- Figure 7: North America Led Perimeter Displays Revenue (million), by Type 2024 & 2032
- Figure 8: North America Led Perimeter Displays Volume (K), by Type 2024 & 2032
- Figure 9: North America Led Perimeter Displays Revenue Share (%), by Type 2024 & 2032
- Figure 10: North America Led Perimeter Displays Volume Share (%), by Type 2024 & 2032
- Figure 11: North America Led Perimeter Displays Revenue (million), by Country 2024 & 2032
- Figure 12: North America Led Perimeter Displays Volume (K), by Country 2024 & 2032
- Figure 13: North America Led Perimeter Displays Revenue Share (%), by Country 2024 & 2032
- Figure 14: North America Led Perimeter Displays Volume Share (%), by Country 2024 & 2032
- Figure 15: South America Led Perimeter Displays Revenue (million), by Application 2024 & 2032
- Figure 16: South America Led Perimeter Displays Volume (K), by Application 2024 & 2032
- Figure 17: South America Led Perimeter Displays Revenue Share (%), by Application 2024 & 2032
- Figure 18: South America Led Perimeter Displays Volume Share (%), by Application 2024 & 2032
- Figure 19: South America Led Perimeter Displays Revenue (million), by Type 2024 & 2032
- Figure 20: South America Led Perimeter Displays Volume (K), by Type 2024 & 2032
- Figure 21: South America Led Perimeter Displays Revenue Share (%), by Type 2024 & 2032
- Figure 22: South America Led Perimeter Displays Volume Share (%), by Type 2024 & 2032
- Figure 23: South America Led Perimeter Displays Revenue (million), by Country 2024 & 2032
- Figure 24: South America Led Perimeter Displays Volume (K), by Country 2024 & 2032
- Figure 25: South America Led Perimeter Displays Revenue Share (%), by Country 2024 & 2032
- Figure 26: South America Led Perimeter Displays Volume Share (%), by Country 2024 & 2032
- Figure 27: Europe Led Perimeter Displays Revenue (million), by Application 2024 & 2032
- Figure 28: Europe Led Perimeter Displays Volume (K), by Application 2024 & 2032
- Figure 29: Europe Led Perimeter Displays Revenue Share (%), by Application 2024 & 2032
- Figure 30: Europe Led Perimeter Displays Volume Share (%), by Application 2024 & 2032
- Figure 31: Europe Led Perimeter Displays Revenue (million), by Type 2024 & 2032
- Figure 32: Europe Led Perimeter Displays Volume (K), by Type 2024 & 2032
- Figure 33: Europe Led Perimeter Displays Revenue Share (%), by Type 2024 & 2032
- Figure 34: Europe Led Perimeter Displays Volume Share (%), by Type 2024 & 2032
- Figure 35: Europe Led Perimeter Displays Revenue (million), by Country 2024 & 2032
- Figure 36: Europe Led Perimeter Displays Volume (K), by Country 2024 & 2032
- Figure 37: Europe Led Perimeter Displays Revenue Share (%), by Country 2024 & 2032
- Figure 38: Europe Led Perimeter Displays Volume Share (%), by Country 2024 & 2032
- Figure 39: Middle East & Africa Led Perimeter Displays Revenue (million), by Application 2024 & 2032
- Figure 40: Middle East & Africa Led Perimeter Displays Volume (K), by Application 2024 & 2032
- Figure 41: Middle East & Africa Led Perimeter Displays Revenue Share (%), by Application 2024 & 2032
- Figure 42: Middle East & Africa Led Perimeter Displays Volume Share (%), by Application 2024 & 2032
- Figure 43: Middle East & Africa Led Perimeter Displays Revenue (million), by Type 2024 & 2032
- Figure 44: Middle East & Africa Led Perimeter Displays Volume (K), by Type 2024 & 2032
- Figure 45: Middle East & Africa Led Perimeter Displays Revenue Share (%), by Type 2024 & 2032
- Figure 46: Middle East & Africa Led Perimeter Displays Volume Share (%), by Type 2024 & 2032
- Figure 47: Middle East & Africa Led Perimeter Displays Revenue (million), by Country 2024 & 2032
- Figure 48: Middle East & Africa Led Perimeter Displays Volume (K), by Country 2024 & 2032
- Figure 49: Middle East & Africa Led Perimeter Displays Revenue Share (%), by Country 2024 & 2032
- Figure 50: Middle East & Africa Led Perimeter Displays Volume Share (%), by Country 2024 & 2032
- Figure 51: Asia Pacific Led Perimeter Displays Revenue (million), by Application 2024 & 2032
- Figure 52: Asia Pacific Led Perimeter Displays Volume (K), by Application 2024 & 2032
- Figure 53: Asia Pacific Led Perimeter Displays Revenue Share (%), by Application 2024 & 2032
- Figure 54: Asia Pacific Led Perimeter Displays Volume Share (%), by Application 2024 & 2032
- Figure 55: Asia Pacific Led Perimeter Displays Revenue (million), by Type 2024 & 2032
- Figure 56: Asia Pacific Led Perimeter Displays Volume (K), by Type 2024 & 2032
- Figure 57: Asia Pacific Led Perimeter Displays Revenue Share (%), by Type 2024 & 2032
- Figure 58: Asia Pacific Led Perimeter Displays Volume Share (%), by Type 2024 & 2032
- Figure 59: Asia Pacific Led Perimeter Displays Revenue (million), by Country 2024 & 2032
- Figure 60: Asia Pacific Led Perimeter Displays Volume (K), by Country 2024 & 2032
- Figure 61: Asia Pacific Led Perimeter Displays Revenue Share (%), by Country 2024 & 2032
- Figure 62: Asia Pacific Led Perimeter Displays Volume Share (%), by Country 2024 & 2032
List of Tables
- Table 1: Global Led Perimeter Displays Revenue million Forecast, by Region 2019 & 2032
- Table 2: Global Led Perimeter Displays Volume K Forecast, by Region 2019 & 2032
- Table 3: Global Led Perimeter Displays Revenue million Forecast, by Application 2019 & 2032
- Table 4: Global Led Perimeter Displays Volume K Forecast, by Application 2019 & 2032
- Table 5: Global Led Perimeter Displays Revenue million Forecast, by Type 2019 & 2032
- Table 6: Global Led Perimeter Displays Volume K Forecast, by Type 2019 & 2032
- Table 7: Global Led Perimeter Displays Revenue million Forecast, by Region 2019 & 2032
- Table 8: Global Led Perimeter Displays Volume K Forecast, by Region 2019 & 2032
- Table 9: Global Led Perimeter Displays Revenue million Forecast, by Application 2019 & 2032
- Table 10: Global Led Perimeter Displays Volume K Forecast, by Application 2019 & 2032
- Table 11: Global Led Perimeter Displays Revenue million Forecast, by Type 2019 & 2032
- Table 12: Global Led Perimeter Displays Volume K Forecast, by Type 2019 & 2032
- Table 13: Global Led Perimeter Displays Revenue million Forecast, by Country 2019 & 2032
- Table 14: Global Led Perimeter Displays Volume K Forecast, by Country 2019 & 2032
- Table 15: United States Led Perimeter Displays Revenue (million) Forecast, by Application 2019 & 2032
- Table 16: United States Led Perimeter Displays Volume (K) Forecast, by Application 2019 & 2032
- Table 17: Canada Led Perimeter Displays Revenue (million) Forecast, by Application 2019 & 2032
- Table 18: Canada Led Perimeter Displays Volume (K) Forecast, by Application 2019 & 2032
- Table 19: Mexico Led Perimeter Displays Revenue (million) Forecast, by Application 2019 & 2032
- Table 20: Mexico Led Perimeter Displays Volume (K) Forecast, by Application 2019 & 2032
- Table 21: Global Led Perimeter Displays Revenue million Forecast, by Application 2019 & 2032
- Table 22: Global Led Perimeter Displays Volume K Forecast, by Application 2019 & 2032
- Table 23: Global Led Perimeter Displays Revenue million Forecast, by Type 2019 & 2032
- Table 24: Global Led Perimeter Displays Volume K Forecast, by Type 2019 & 2032
- Table 25: Global Led Perimeter Displays Revenue million Forecast, by Country 2019 & 2032
- Table 26: Global Led Perimeter Displays Volume K Forecast, by Country 2019 & 2032
- Table 27: Brazil Led Perimeter Displays Revenue (million) Forecast, by Application 2019 & 2032
- Table 28: Brazil Led Perimeter Displays Volume (K) Forecast, by Application 2019 & 2032
- Table 29: Argentina Led Perimeter Displays Revenue (million) Forecast, by Application 2019 & 2032
- Table 30: Argentina Led Perimeter Displays Volume (K) Forecast, by Application 2019 & 2032
- Table 31: Rest of South America Led Perimeter Displays Revenue (million) Forecast, by Application 2019 & 2032
- Table 32: Rest of South America Led Perimeter Displays Volume (K) Forecast, by Application 2019 & 2032
- Table 33: Global Led Perimeter Displays Revenue million Forecast, by Application 2019 & 2032
- Table 34: Global Led Perimeter Displays Volume K Forecast, by Application 2019 & 2032
- Table 35: Global Led Perimeter Displays Revenue million Forecast, by Type 2019 & 2032
- Table 36: Global Led Perimeter Displays Volume K Forecast, by Type 2019 & 2032
- Table 37: Global Led Perimeter Displays Revenue million Forecast, by Country 2019 & 2032
- Table 38: Global Led Perimeter Displays Volume K Forecast, by Country 2019 & 2032
- Table 39: United Kingdom Led Perimeter Displays Revenue (million) Forecast, by Application 2019 & 2032
- Table 40: United Kingdom Led Perimeter Displays Volume (K) Forecast, by Application 2019 & 2032
- Table 41: Germany Led Perimeter Displays Revenue (million) Forecast, by Application 2019 & 2032
- Table 42: Germany Led Perimeter Displays Volume (K) Forecast, by Application 2019 & 2032
- Table 43: France Led Perimeter Displays Revenue (million) Forecast, by Application 2019 & 2032
- Table 44: France Led Perimeter Displays Volume (K) Forecast, by Application 2019 & 2032
- Table 45: Italy Led Perimeter Displays Revenue (million) Forecast, by Application 2019 & 2032
- Table 46: Italy Led Perimeter Displays Volume (K) Forecast, by Application 2019 & 2032
- Table 47: Spain Led Perimeter Displays Revenue (million) Forecast, by Application 2019 & 2032
- Table 48: Spain Led Perimeter Displays Volume (K) Forecast, by Application 2019 & 2032
- Table 49: Russia Led Perimeter Displays Revenue (million) Forecast, by Application 2019 & 2032
- Table 50: Russia Led Perimeter Displays Volume (K) Forecast, by Application 2019 & 2032
- Table 51: Benelux Led Perimeter Displays Revenue (million) Forecast, by Application 2019 & 2032
- Table 52: Benelux Led Perimeter Displays Volume (K) Forecast, by Application 2019 & 2032
- Table 53: Nordics Led Perimeter Displays Revenue (million) Forecast, by Application 2019 & 2032
- Table 54: Nordics Led Perimeter Displays Volume (K) Forecast, by Application 2019 & 2032
- Table 55: Rest of Europe Led Perimeter Displays Revenue (million) Forecast, by Application 2019 & 2032
- Table 56: Rest of Europe Led Perimeter Displays Volume (K) Forecast, by Application 2019 & 2032
- Table 57: Global Led Perimeter Displays Revenue million Forecast, by Application 2019 & 2032
- Table 58: Global Led Perimeter Displays Volume K Forecast, by Application 2019 & 2032
- Table 59: Global Led Perimeter Displays Revenue million Forecast, by Type 2019 & 2032
- Table 60: Global Led Perimeter Displays Volume K Forecast, by Type 2019 & 2032
- Table 61: Global Led Perimeter Displays Revenue million Forecast, by Country 2019 & 2032
- Table 62: Global Led Perimeter Displays Volume K Forecast, by Country 2019 & 2032
- Table 63: Turkey Led Perimeter Displays Revenue (million) Forecast, by Application 2019 & 2032
- Table 64: Turkey Led Perimeter Displays Volume (K) Forecast, by Application 2019 & 2032
- Table 65: Israel Led Perimeter Displays Revenue (million) Forecast, by Application 2019 & 2032
- Table 66: Israel Led Perimeter Displays Volume (K) Forecast, by Application 2019 & 2032
- Table 67: GCC Led Perimeter Displays Revenue (million) Forecast, by Application 2019 & 2032
- Table 68: GCC Led Perimeter Displays Volume (K) Forecast, by Application 2019 & 2032
- Table 69: North Africa Led Perimeter Displays Revenue (million) Forecast, by Application 2019 & 2032
- Table 70: North Africa Led Perimeter Displays Volume (K) Forecast, by Application 2019 & 2032
- Table 71: South Africa Led Perimeter Displays Revenue (million) Forecast, by Application 2019 & 2032
- Table 72: South Africa Led Perimeter Displays Volume (K) Forecast, by Application 2019 & 2032
- Table 73: Rest of Middle East & Africa Led Perimeter Displays Revenue (million) Forecast, by Application 2019 & 2032
- Table 74: Rest of Middle East & Africa Led Perimeter Displays Volume (K) Forecast, by Application 2019 & 2032
- Table 75: Global Led Perimeter Displays Revenue million Forecast, by Application 2019 & 2032
- Table 76: Global Led Perimeter Displays Volume K Forecast, by Application 2019 & 2032
- Table 77: Global Led Perimeter Displays Revenue million Forecast, by Type 2019 & 2032
- Table 78: Global Led Perimeter Displays Volume K Forecast, by Type 2019 & 2032
- Table 79: Global Led Perimeter Displays Revenue million Forecast, by Country 2019 & 2032
- Table 80: Global Led Perimeter Displays Volume K Forecast, by Country 2019 & 2032
- Table 81: China Led Perimeter Displays Revenue (million) Forecast, by Application 2019 & 2032
- Table 82: China Led Perimeter Displays Volume (K) Forecast, by Application 2019 & 2032
- Table 83: India Led Perimeter Displays Revenue (million) Forecast, by Application 2019 & 2032
- Table 84: India Led Perimeter Displays Volume (K) Forecast, by Application 2019 & 2032
- Table 85: Japan Led Perimeter Displays Revenue (million) Forecast, by Application 2019 & 2032
- Table 86: Japan Led Perimeter Displays Volume (K) Forecast, by Application 2019 & 2032
- Table 87: South Korea Led Perimeter Displays Revenue (million) Forecast, by Application 2019 & 2032
- Table 88: South Korea Led Perimeter Displays Volume (K) Forecast, by Application 2019 & 2032
- Table 89: ASEAN Led Perimeter Displays Revenue (million) Forecast, by Application 2019 & 2032
- Table 90: ASEAN Led Perimeter Displays Volume (K) Forecast, by Application 2019 & 2032
- Table 91: Oceania Led Perimeter Displays Revenue (million) Forecast, by Application 2019 & 2032
- Table 92: Oceania Led Perimeter Displays Volume (K) Forecast, by Application 2019 & 2032
- Table 93: Rest of Asia Pacific Led Perimeter Displays Revenue (million) Forecast, by Application 2019 & 2032
- Table 94: Rest of Asia Pacific Led Perimeter Displays Volume (K) Forecast, by Application 2019 & 2032
Frequently Asked Questions
1. What is the projected Compound Annual Growth Rate (CAGR) of the Led Perimeter Displays?
The projected CAGR is approximately XXX%.
2. Which companies are prominent players in the Led Perimeter Displays?
Key companies in the market include Daktronics, Inc., LG, Samsung, Panasonic Corporation, Barco N.V., Sony Corporation, Vegas LED Screens, Mitsubishi Electric Corporation, Leyard Optoelectronic Co., Ltd., Euro Display Srl, Focono Optoelectronics Co., Ltd., Pro Display, Bodet Sport, Kabuki-scifi, Xiamen Qiangli Jucai Opto-Electronic Technology Co., Ltd., Shenzhen EASTAR Electronic Co., Ltd., Shenzhen Dicolor Optoelectronics Co., Ltd., Shenzhen YUCHIP Lighting Co.,LTD, Shenzhen LCF Technology Co.,LTD, Stadium LED Screens., Liantronics CO.,LTD., Lyson Optoelectronics Co.,Limited, Jie Yu Industrial Company.
3. What are the main segments of the Led Perimeter Displays?
The market segments include Application, Type.
4. Can you provide details about the market size?
The market size is estimated to be USD XXX million as of 2022.
5. What are some drivers contributing to market growth?
N/A
6. What are the notable trends driving market growth?
N/A
7. Are there any restraints impacting market growth?
N/A
8. Can you provide examples of recent developments in the market?
N/A
9. What pricing options are available for accessing the report?
Pricing options include single-user, multi-user, and enterprise licenses priced at USD 3950.00, USD 5925.00, and USD 7900.00 respectively.
10. Is the market size provided in terms of value or volume?
The market size is provided in terms of value, measured in million and volume, measured in K.
11. Are there any specific market keywords associated with the report?
Yes, the market keyword associated with the report is "Led Perimeter Displays," which aids in identifying and referencing the specific market segment covered.
12. How do I determine which pricing option suits my needs best?
The pricing options vary based on user requirements and access needs. Individual users may opt for single-user licenses, while businesses requiring broader access may choose multi-user or enterprise licenses for cost-effective access to the report.
13. Are there any additional resources or data provided in the Led Perimeter Displays report?
While the report offers comprehensive insights, it's advisable to review the specific contents or supplementary materials provided to ascertain if additional resources or data are available.
14. How can I stay updated on further developments or reports in the Led Perimeter Displays?
To stay informed about further developments, trends, and reports in the Led Perimeter Displays, consider subscribing to industry newsletters, following relevant companies and organizations, or regularly checking reputable industry news sources and publications.
Methodology
Step 1 - Identification of Relevant Samples Size from Population Database


Step 2 - Approaches for Defining Global Market Size (Value, Volume* & Price*)

Note*: In applicable scenarios
Step 3 - Data Sources
Primary Research
- Web Analytics
- Survey Reports
- Research Institute
- Latest Research Reports
- Opinion Leaders
Secondary Research
- Annual Reports
- White Paper
- Latest Press Release
- Industry Association
- Paid Database
- Investor Presentations

Step 4 - Data Triangulation
Involves using different sources of information in order to increase the validity of a study
These sources are likely to be stakeholders in a program - participants, other researchers, program staff, other community members, and so on.
Then we put all data in single framework & apply various statistical tools to find out the dynamic on the market.
During the analysis stage, feedback from the stakeholder groups would be compared to determine areas of agreement as well as areas of divergence


