
Key Insights
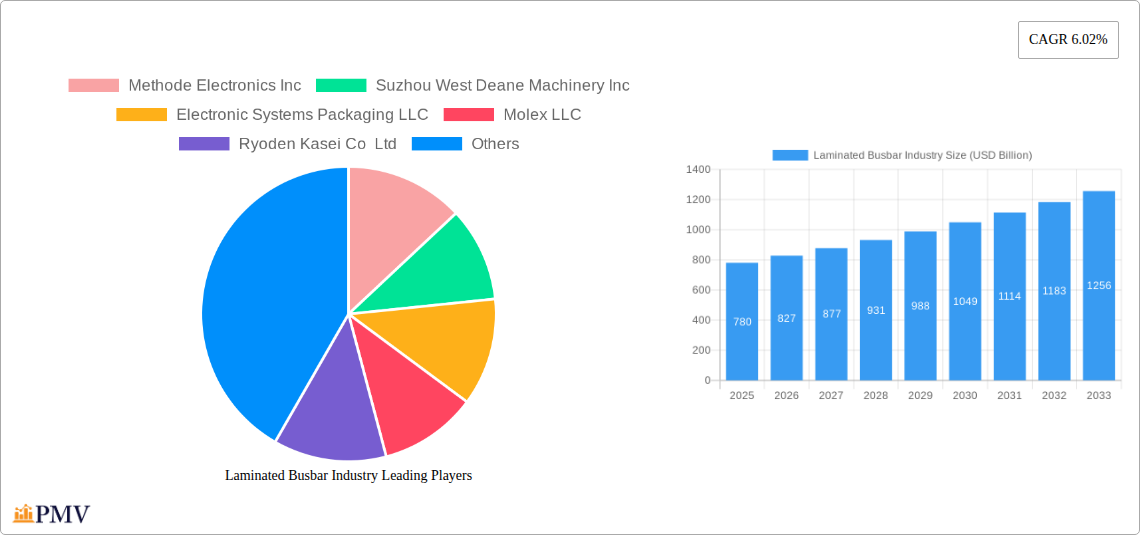
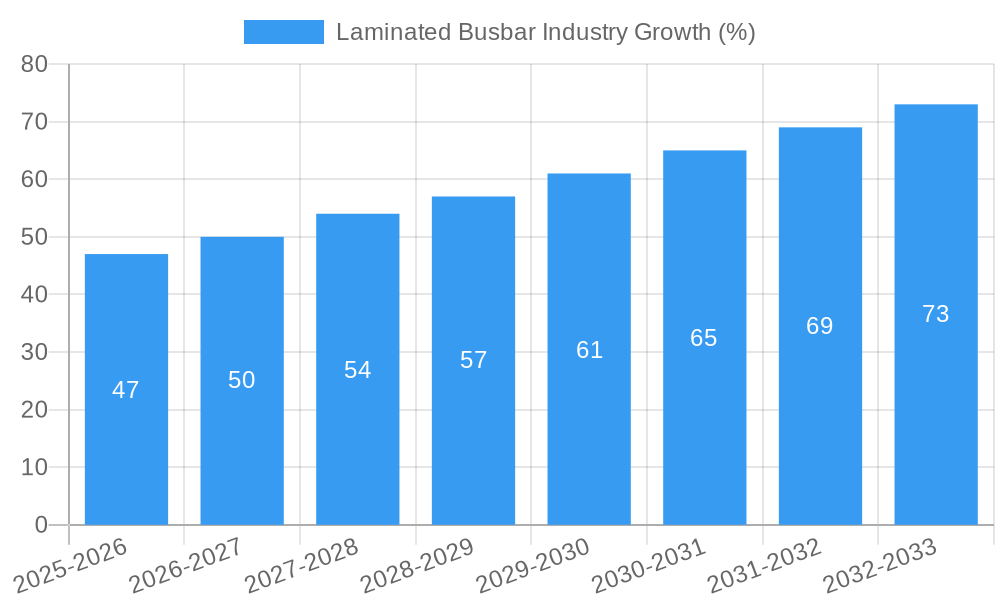
The laminated busbar market, valued at $0.78 billion in 2025, is projected to experience robust growth, driven by the increasing demand for efficient power transmission and distribution systems across diverse sectors. The Compound Annual Growth Rate (CAGR) of 6.02% from 2025 to 2033 indicates a significant expansion, fueled by several key factors. The rising adoption of renewable energy sources, necessitating efficient power handling, is a major driver. Furthermore, the expanding industrial sector, particularly in developing economies like China and India, is creating substantial demand for reliable and high-capacity busbars. Technological advancements leading to lighter, more compact, and thermally efficient designs are also contributing to market growth. The automotive industry's shift towards electric vehicles (EVs) further boosts demand for laminated busbars due to their superior current-carrying capacity and reduced weight. However, the market faces challenges such as fluctuating raw material prices (copper and aluminum) and the potential for substitution by alternative technologies in specific niche applications. Segmentation analysis reveals that the power utilities sector holds the largest market share among end-users, followed by the industrial sector. Aluminum remains the dominant material due to its cost-effectiveness and excellent conductivity. Growth is expected to be geographically diverse, with Asia-Pacific, particularly China, experiencing the most significant expansion due to its robust industrial growth and investment in infrastructure development. North America and Europe are also anticipated to demonstrate healthy growth, albeit at a slightly slower pace compared to Asia-Pacific.
The competitive landscape is characterized by a mix of established multinational corporations and regional players. Key players are focusing on strategic partnerships, acquisitions, and technological innovations to enhance their market position. The focus is on developing advanced materials and designs to meet the evolving needs of diverse end-users. The market's future trajectory strongly depends on the continued growth of renewable energy, industrial expansion, advancements in EV technology, and the overall global economic environment. While challenges related to material costs and technological competition exist, the long-term outlook remains positive, projecting substantial market expansion over the forecast period. The diverse applications and the inherent advantages of laminated busbars ensure their continued relevance in power transmission and distribution systems across various sectors.
Laminated Busbar Industry: A Comprehensive Market Report (2019-2033)
This comprehensive report provides a detailed analysis of the global laminated busbar industry, offering invaluable insights for stakeholders across the value chain. With a study period spanning 2019-2033, a base year of 2025, and a forecast period of 2025-2033, this report offers a robust understanding of historical trends and future growth projections. The market is valued at USD xx Billion in 2025 and is projected to reach USD xx Billion by 2033, exhibiting a CAGR of xx%. This in-depth analysis covers key market segments, leading players, and emerging trends, equipping businesses with the knowledge to make informed strategic decisions.
Laminated Busbar Industry Market Structure & Competitive Dynamics
The laminated busbar market exhibits a moderately consolidated structure, with a few key players holding significant market share. Market concentration is influenced by factors including technological advancements, economies of scale, and geographical presence. The industry’s innovation ecosystem is dynamic, characterized by continuous R&D efforts focused on improving efficiency, enhancing safety, and expanding applications. Regulatory frameworks governing electrical safety and environmental standards play a crucial role in shaping market dynamics. Product substitutes, such as conventional busbars, pose a degree of competitive pressure, but the advantages of laminated busbars in terms of space saving, weight reduction, and improved performance are driving market growth. End-user trends, particularly in the renewable energy and electric vehicle sectors, are significantly impacting demand. M&A activities have been observed, with deal values reaching USD xx Billion in recent years, primarily aimed at consolidating market share and expanding product portfolios.
- Market Share: Top 5 players hold approximately xx% of the global market share.
- M&A Activity: Significant consolidation observed in the last 5 years, driven by strategic expansion and technological integration. Total M&A deal value estimated at USD xx Billion.
- Regulatory Landscape: Stringent safety and environmental regulations are driving innovation towards more efficient and sustainable solutions.
Laminated Busbar Industry Industry Trends & Insights
The laminated busbar industry is witnessing robust growth, driven by several key factors. The increasing demand for reliable power transmission and distribution systems across various sectors, including power utilities, industrial automation, and transportation, is a major growth driver. Technological advancements, such as the development of advanced insulation materials and improved manufacturing processes, are enhancing the performance and efficiency of laminated busbars. Consumer preferences are shifting towards energy-efficient and compact solutions, which aligns well with the advantages offered by laminated busbars. Competitive dynamics are shaped by factors such as pricing strategies, product differentiation, and technological innovation, creating a dynamic and evolving landscape. The market's CAGR during the forecast period is projected to be xx%, reflecting strong growth prospects. Market penetration of laminated busbars is gradually increasing across different end-user segments, particularly in developing economies experiencing rapid infrastructure development.
Dominant Markets & Segments in Laminated Busbar Industry
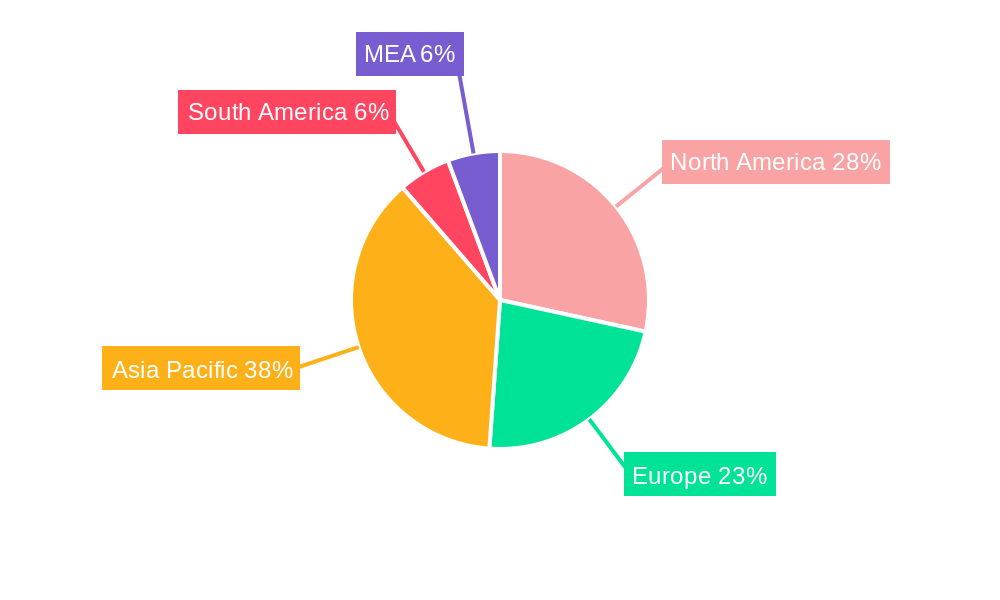
The Asia-Pacific region dominates the laminated busbar market, driven by strong economic growth, rapid industrialization, and significant investments in infrastructure projects. China, in particular, is a leading market due to its extensive power grid expansion and the burgeoning electric vehicle industry.
- Leading Regions: Asia-Pacific, North America, Europe
- Dominant End-User Segments: Power Utilities (driving the largest demand), Industrial, Transportation (significant growth due to EV adoption)
- Key Material: Copper (widely used for its superior conductivity), followed by Aluminum (cost-effective alternative).
- Insulation Material: Epoxy powder coating currently holds the largest market share due to its cost-effectiveness and robust properties.
Key Drivers in Dominant Regions:
- Asia-Pacific: Rapid urbanization, expanding power grids, and significant investments in renewable energy infrastructure.
- North America: Growth in renewable energy projects and upgrades to existing power infrastructure.
- Europe: Stringent environmental regulations driving adoption of energy-efficient solutions.
Laminated Busbar Industry Product Innovations
Recent innovations in laminated busbar technology focus on enhancing efficiency, safety, and miniaturization. The integration of advanced materials, such as high-performance polymers and composites, has led to the development of lighter, more compact, and durable busbars. These innovations are expanding the applications of laminated busbars in various sectors, including electric vehicles, renewable energy systems, and high-speed rail. The competitive advantage lies in offering improved electrical performance, reduced weight, and enhanced safety features compared to traditional busbar designs.
Report Segmentation & Scope
This report segments the laminated busbar market based on insulation material (Epoxy Powder Coating, Polyvinyl Fluoride Film, Polyester, Heat-Resistant Fiber, Other Insulation Materials), end-user (Power Utilities, Industrial, Transportation, Residential and Commercial), and material (Aluminum, Copper). Each segment is analyzed in terms of its market size, growth projections, and competitive dynamics. For instance, the epoxy powder coating segment is expected to witness significant growth due to its cost-effectiveness and good insulating properties. Similarly, the Power Utilities segment is expected to dominate the end-user market driven by the need for reliable power transmission and distribution. The growth in the electric vehicle sector is a significant driver for copper usage in the material segment.
Key Drivers of Laminated Busbar Industry Growth
The growth of the laminated busbar industry is propelled by several key factors:
- Rising Demand for Renewable Energy: The shift towards renewable energy sources fuels the need for efficient power transmission and distribution solutions.
- Growth in the Electric Vehicle Sector: The increasing adoption of electric vehicles requires advanced and reliable power systems.
- Infrastructure Development: Investment in modernizing power grids and infrastructure projects drives demand.
- Technological Advancements: Innovation in materials and manufacturing processes leads to improved performance and efficiency.
Challenges in the Laminated Busbar Industry Sector
The laminated busbar industry faces several challenges:
- Fluctuations in Raw Material Prices: Price volatility in copper and aluminum affects production costs.
- Stringent Regulatory Compliance: Meeting safety and environmental standards adds complexity to operations.
- Intense Competition: The presence of numerous players creates a competitive landscape.
- Supply Chain Disruptions: Global supply chain vulnerabilities can impact production and delivery.
Leading Players in the Laminated Busbar Industry Market
- Methode Electronics Inc
- Suzhou West Deane Machinery Inc
- Electronic Systems Packaging LLC
- Molex LLC
- Ryoden Kasei Co Ltd
- Rogers Corporation
- Shanghai Eagtop Electronic Technology Co Ltd
- Eaton Corporation PLC
- Amphenol Corporation
- Segue Electronics Inc
- Zhejiang RHI ELectric Co Ltd
- Mersen SA
- Zhuzhou CRRC Times Electric Co Ltd
- Sun King Power Electronics Group Ltd
- Raychem RPG Private Limited
- EMS Industrial & Service Company
- Storm Power Components
Key Developments in Laminated Busbar Industry Sector
- February 2020: ABB Ltd. announced the introduction of laminated bus plate technology for low-voltage switchgear, enhancing reliability, efficiency, and safety.
- March 2020: BRAR successfully completed factory cold tests of busbars and Aluminum Power Conducting Arms for SMS Group, signifying advancement in manufacturing capabilities.
Strategic Laminated Busbar Industry Market Outlook
The laminated busbar industry is poised for sustained growth, driven by the increasing demand for efficient and reliable power solutions across various sectors. Strategic opportunities exist in developing innovative products tailored to specific end-user needs, focusing on areas such as miniaturization, enhanced safety, and integration with smart grid technologies. Expansion into emerging markets, especially in developing economies, presents significant potential for growth. The focus on sustainable manufacturing practices and environmentally friendly materials will also play a key role in shaping the future of the industry.
Laminated Busbar Industry Segmentation
-
1. Material
- 1.1. Aluminum
- 1.2. Copper
-
2. Insulation Material
- 2.1. Epoxy Powder Coating
- 2.2. Polyvinyl Fluoride Film
- 2.3. Polyester
- 2.4. Heat-Resistant Fiber
- 2.5. Other Insulation Materials
-
3. End-User
- 3.1. Power Utilities
- 3.2. Industrial
- 3.3. Transportation
- 3.4. Residential and Commercial
Laminated Busbar Industry Segmentation By Geography
- 1. North America
- 2. Europe
- 3. Asia Pacific
- 4. South America
- 5. Middle East
Laminated Busbar Industry REPORT HIGHLIGHTS
| Aspects | Details |
|---|---|
| Study Period | 2019-2033 |
| Base Year | 2024 |
| Estimated Year | 2025 |
| Forecast Period | 2025-2033 |
| Historical Period | 2019-2024 |
| Growth Rate | CAGR of 6.02% from 2019-2033 |
| Segmentation |
|
Table of Contents
- 1. Introduction
- 1.1. Research Scope
- 1.2. Market Segmentation
- 1.3. Research Methodology
- 1.4. Definitions and Assumptions
- 2. Executive Summary
- 2.1. Introduction
- 3. Market Dynamics
- 3.1. Introduction
- 3.2. Market Drivers
- 3.2.1. 4.; Growing Energy Demand4.; Renewable Energy Transition
- 3.3. Market Restrains
- 3.3.1. 4.; Phasing out of Conventional Sources of Electricity
- 3.4. Market Trends
- 3.4.1. Power Utility Sub-sector to Dominate the Market
- 4. Market Factor Analysis
- 4.1. Porters Five Forces
- 4.2. Supply/Value Chain
- 4.3. PESTEL analysis
- 4.4. Market Entropy
- 4.5. Patent/Trademark Analysis
- 5. Global Laminated Busbar Industry Analysis, Insights and Forecast, 2019-2031
- 5.1. Market Analysis, Insights and Forecast - by Material
- 5.1.1. Aluminum
- 5.1.2. Copper
- 5.2. Market Analysis, Insights and Forecast - by Insulation Material
- 5.2.1. Epoxy Powder Coating
- 5.2.2. Polyvinyl Fluoride Film
- 5.2.3. Polyester
- 5.2.4. Heat-Resistant Fiber
- 5.2.5. Other Insulation Materials
- 5.3. Market Analysis, Insights and Forecast - by End-User
- 5.3.1. Power Utilities
- 5.3.2. Industrial
- 5.3.3. Transportation
- 5.3.4. Residential and Commercial
- 5.4. Market Analysis, Insights and Forecast - by Region
- 5.4.1. North America
- 5.4.2. Europe
- 5.4.3. Asia Pacific
- 5.4.4. South America
- 5.4.5. Middle East
- 5.1. Market Analysis, Insights and Forecast - by Material
- 6. North America Laminated Busbar Industry Analysis, Insights and Forecast, 2019-2031
- 6.1. Market Analysis, Insights and Forecast - by Material
- 6.1.1. Aluminum
- 6.1.2. Copper
- 6.2. Market Analysis, Insights and Forecast - by Insulation Material
- 6.2.1. Epoxy Powder Coating
- 6.2.2. Polyvinyl Fluoride Film
- 6.2.3. Polyester
- 6.2.4. Heat-Resistant Fiber
- 6.2.5. Other Insulation Materials
- 6.3. Market Analysis, Insights and Forecast - by End-User
- 6.3.1. Power Utilities
- 6.3.2. Industrial
- 6.3.3. Transportation
- 6.3.4. Residential and Commercial
- 6.1. Market Analysis, Insights and Forecast - by Material
- 7. Europe Laminated Busbar Industry Analysis, Insights and Forecast, 2019-2031
- 7.1. Market Analysis, Insights and Forecast - by Material
- 7.1.1. Aluminum
- 7.1.2. Copper
- 7.2. Market Analysis, Insights and Forecast - by Insulation Material
- 7.2.1. Epoxy Powder Coating
- 7.2.2. Polyvinyl Fluoride Film
- 7.2.3. Polyester
- 7.2.4. Heat-Resistant Fiber
- 7.2.5. Other Insulation Materials
- 7.3. Market Analysis, Insights and Forecast - by End-User
- 7.3.1. Power Utilities
- 7.3.2. Industrial
- 7.3.3. Transportation
- 7.3.4. Residential and Commercial
- 7.1. Market Analysis, Insights and Forecast - by Material
- 8. Asia Pacific Laminated Busbar Industry Analysis, Insights and Forecast, 2019-2031
- 8.1. Market Analysis, Insights and Forecast - by Material
- 8.1.1. Aluminum
- 8.1.2. Copper
- 8.2. Market Analysis, Insights and Forecast - by Insulation Material
- 8.2.1. Epoxy Powder Coating
- 8.2.2. Polyvinyl Fluoride Film
- 8.2.3. Polyester
- 8.2.4. Heat-Resistant Fiber
- 8.2.5. Other Insulation Materials
- 8.3. Market Analysis, Insights and Forecast - by End-User
- 8.3.1. Power Utilities
- 8.3.2. Industrial
- 8.3.3. Transportation
- 8.3.4. Residential and Commercial
- 8.1. Market Analysis, Insights and Forecast - by Material
- 9. South America Laminated Busbar Industry Analysis, Insights and Forecast, 2019-2031
- 9.1. Market Analysis, Insights and Forecast - by Material
- 9.1.1. Aluminum
- 9.1.2. Copper
- 9.2. Market Analysis, Insights and Forecast - by Insulation Material
- 9.2.1. Epoxy Powder Coating
- 9.2.2. Polyvinyl Fluoride Film
- 9.2.3. Polyester
- 9.2.4. Heat-Resistant Fiber
- 9.2.5. Other Insulation Materials
- 9.3. Market Analysis, Insights and Forecast - by End-User
- 9.3.1. Power Utilities
- 9.3.2. Industrial
- 9.3.3. Transportation
- 9.3.4. Residential and Commercial
- 9.1. Market Analysis, Insights and Forecast - by Material
- 10. Middle East Laminated Busbar Industry Analysis, Insights and Forecast, 2019-2031
- 10.1. Market Analysis, Insights and Forecast - by Material
- 10.1.1. Aluminum
- 10.1.2. Copper
- 10.2. Market Analysis, Insights and Forecast - by Insulation Material
- 10.2.1. Epoxy Powder Coating
- 10.2.2. Polyvinyl Fluoride Film
- 10.2.3. Polyester
- 10.2.4. Heat-Resistant Fiber
- 10.2.5. Other Insulation Materials
- 10.3. Market Analysis, Insights and Forecast - by End-User
- 10.3.1. Power Utilities
- 10.3.2. Industrial
- 10.3.3. Transportation
- 10.3.4. Residential and Commercial
- 10.1. Market Analysis, Insights and Forecast - by Material
- 11. North America Laminated Busbar Industry Analysis, Insights and Forecast, 2019-2031
- 11.1. Market Analysis, Insights and Forecast - By Country/Sub-region
- 11.1.1 United States
- 11.1.2 Canada
- 11.1.3 Mexico
- 12. Europe Laminated Busbar Industry Analysis, Insights and Forecast, 2019-2031
- 12.1. Market Analysis, Insights and Forecast - By Country/Sub-region
- 12.1.1 Germany
- 12.1.2 United Kingdom
- 12.1.3 France
- 12.1.4 Spain
- 12.1.5 Italy
- 12.1.6 Spain
- 12.1.7 Belgium
- 12.1.8 Netherland
- 12.1.9 Nordics
- 12.1.10 Rest of Europe
- 13. Asia Pacific Laminated Busbar Industry Analysis, Insights and Forecast, 2019-2031
- 13.1. Market Analysis, Insights and Forecast - By Country/Sub-region
- 13.1.1 China
- 13.1.2 Japan
- 13.1.3 India
- 13.1.4 South Korea
- 13.1.5 Southeast Asia
- 13.1.6 Australia
- 13.1.7 Indonesia
- 13.1.8 Phillipes
- 13.1.9 Singapore
- 13.1.10 Thailandc
- 13.1.11 Rest of Asia Pacific
- 14. South America Laminated Busbar Industry Analysis, Insights and Forecast, 2019-2031
- 14.1. Market Analysis, Insights and Forecast - By Country/Sub-region
- 14.1.1 Brazil
- 14.1.2 Argentina
- 14.1.3 Peru
- 14.1.4 Chile
- 14.1.5 Colombia
- 14.1.6 Ecuador
- 14.1.7 Venezuela
- 14.1.8 Rest of South America
- 15. North America Laminated Busbar Industry Analysis, Insights and Forecast, 2019-2031
- 15.1. Market Analysis, Insights and Forecast - By Country/Sub-region
- 15.1.1 United States
- 15.1.2 Canada
- 15.1.3 Mexico
- 16. MEA Laminated Busbar Industry Analysis, Insights and Forecast, 2019-2031
- 16.1. Market Analysis, Insights and Forecast - By Country/Sub-region
- 16.1.1 United Arab Emirates
- 16.1.2 Saudi Arabia
- 16.1.3 South Africa
- 16.1.4 Rest of Middle East and Africa
- 17. Competitive Analysis
- 17.1. Global Market Share Analysis 2024
- 17.2. Company Profiles
- 17.2.1 Methode Electronics Inc
- 17.2.1.1. Overview
- 17.2.1.2. Products
- 17.2.1.3. SWOT Analysis
- 17.2.1.4. Recent Developments
- 17.2.1.5. Financials (Based on Availability)
- 17.2.2 Suzhou West Deane Machinery Inc
- 17.2.2.1. Overview
- 17.2.2.2. Products
- 17.2.2.3. SWOT Analysis
- 17.2.2.4. Recent Developments
- 17.2.2.5. Financials (Based on Availability)
- 17.2.3 Electronic Systems Packaging LLC
- 17.2.3.1. Overview
- 17.2.3.2. Products
- 17.2.3.3. SWOT Analysis
- 17.2.3.4. Recent Developments
- 17.2.3.5. Financials (Based on Availability)
- 17.2.4 Molex LLC
- 17.2.4.1. Overview
- 17.2.4.2. Products
- 17.2.4.3. SWOT Analysis
- 17.2.4.4. Recent Developments
- 17.2.4.5. Financials (Based on Availability)
- 17.2.5 Ryoden Kasei Co Ltd
- 17.2.5.1. Overview
- 17.2.5.2. Products
- 17.2.5.3. SWOT Analysis
- 17.2.5.4. Recent Developments
- 17.2.5.5. Financials (Based on Availability)
- 17.2.6 Rogers Corporation
- 17.2.6.1. Overview
- 17.2.6.2. Products
- 17.2.6.3. SWOT Analysis
- 17.2.6.4. Recent Developments
- 17.2.6.5. Financials (Based on Availability)
- 17.2.7 Shanghai Eagtop Electronic Technology Co Ltd
- 17.2.7.1. Overview
- 17.2.7.2. Products
- 17.2.7.3. SWOT Analysis
- 17.2.7.4. Recent Developments
- 17.2.7.5. Financials (Based on Availability)
- 17.2.8 Eaton Corporation PLC
- 17.2.8.1. Overview
- 17.2.8.2. Products
- 17.2.8.3. SWOT Analysis
- 17.2.8.4. Recent Developments
- 17.2.8.5. Financials (Based on Availability)
- 17.2.9 Amphenol Corporation
- 17.2.9.1. Overview
- 17.2.9.2. Products
- 17.2.9.3. SWOT Analysis
- 17.2.9.4. Recent Developments
- 17.2.9.5. Financials (Based on Availability)
- 17.2.10 Segue Electronics Inc *List Not Exhaustive
- 17.2.10.1. Overview
- 17.2.10.2. Products
- 17.2.10.3. SWOT Analysis
- 17.2.10.4. Recent Developments
- 17.2.10.5. Financials (Based on Availability)
- 17.2.11 Zhejiang RHI ELectric Co Ltd
- 17.2.11.1. Overview
- 17.2.11.2. Products
- 17.2.11.3. SWOT Analysis
- 17.2.11.4. Recent Developments
- 17.2.11.5. Financials (Based on Availability)
- 17.2.12 Mersen SA
- 17.2.12.1. Overview
- 17.2.12.2. Products
- 17.2.12.3. SWOT Analysis
- 17.2.12.4. Recent Developments
- 17.2.12.5. Financials (Based on Availability)
- 17.2.13 Zhuzhou CRRC Times Electric Co Ltd
- 17.2.13.1. Overview
- 17.2.13.2. Products
- 17.2.13.3. SWOT Analysis
- 17.2.13.4. Recent Developments
- 17.2.13.5. Financials (Based on Availability)
- 17.2.14 Sun King Power Electronics Group Ltd
- 17.2.14.1. Overview
- 17.2.14.2. Products
- 17.2.14.3. SWOT Analysis
- 17.2.14.4. Recent Developments
- 17.2.14.5. Financials (Based on Availability)
- 17.2.15 Raychem RPG Private Limited
- 17.2.15.1. Overview
- 17.2.15.2. Products
- 17.2.15.3. SWOT Analysis
- 17.2.15.4. Recent Developments
- 17.2.15.5. Financials (Based on Availability)
- 17.2.16 EMS Industrial & Service Company
- 17.2.16.1. Overview
- 17.2.16.2. Products
- 17.2.16.3. SWOT Analysis
- 17.2.16.4. Recent Developments
- 17.2.16.5. Financials (Based on Availability)
- 17.2.17 Storm Power Components
- 17.2.17.1. Overview
- 17.2.17.2. Products
- 17.2.17.3. SWOT Analysis
- 17.2.17.4. Recent Developments
- 17.2.17.5. Financials (Based on Availability)
- 17.2.1 Methode Electronics Inc
List of Figures
- Figure 1: Global Laminated Busbar Industry Revenue Breakdown (USD Billion, %) by Region 2024 & 2032
- Figure 2: Global Laminated Busbar Industry Volume Breakdown (K Units, %) by Region 2024 & 2032
- Figure 3: North America Laminated Busbar Industry Revenue (USD Billion), by Country 2024 & 2032
- Figure 4: North America Laminated Busbar Industry Volume (K Units), by Country 2024 & 2032
- Figure 5: North America Laminated Busbar Industry Revenue Share (%), by Country 2024 & 2032
- Figure 6: North America Laminated Busbar Industry Volume Share (%), by Country 2024 & 2032
- Figure 7: Europe Laminated Busbar Industry Revenue (USD Billion), by Country 2024 & 2032
- Figure 8: Europe Laminated Busbar Industry Volume (K Units), by Country 2024 & 2032
- Figure 9: Europe Laminated Busbar Industry Revenue Share (%), by Country 2024 & 2032
- Figure 10: Europe Laminated Busbar Industry Volume Share (%), by Country 2024 & 2032
- Figure 11: Asia Pacific Laminated Busbar Industry Revenue (USD Billion), by Country 2024 & 2032
- Figure 12: Asia Pacific Laminated Busbar Industry Volume (K Units), by Country 2024 & 2032
- Figure 13: Asia Pacific Laminated Busbar Industry Revenue Share (%), by Country 2024 & 2032
- Figure 14: Asia Pacific Laminated Busbar Industry Volume Share (%), by Country 2024 & 2032
- Figure 15: South America Laminated Busbar Industry Revenue (USD Billion), by Country 2024 & 2032
- Figure 16: South America Laminated Busbar Industry Volume (K Units), by Country 2024 & 2032
- Figure 17: South America Laminated Busbar Industry Revenue Share (%), by Country 2024 & 2032
- Figure 18: South America Laminated Busbar Industry Volume Share (%), by Country 2024 & 2032
- Figure 19: North America Laminated Busbar Industry Revenue (USD Billion), by Country 2024 & 2032
- Figure 20: North America Laminated Busbar Industry Volume (K Units), by Country 2024 & 2032
- Figure 21: North America Laminated Busbar Industry Revenue Share (%), by Country 2024 & 2032
- Figure 22: North America Laminated Busbar Industry Volume Share (%), by Country 2024 & 2032
- Figure 23: MEA Laminated Busbar Industry Revenue (USD Billion), by Country 2024 & 2032
- Figure 24: MEA Laminated Busbar Industry Volume (K Units), by Country 2024 & 2032
- Figure 25: MEA Laminated Busbar Industry Revenue Share (%), by Country 2024 & 2032
- Figure 26: MEA Laminated Busbar Industry Volume Share (%), by Country 2024 & 2032
- Figure 27: North America Laminated Busbar Industry Revenue (USD Billion), by Material 2024 & 2032
- Figure 28: North America Laminated Busbar Industry Volume (K Units), by Material 2024 & 2032
- Figure 29: North America Laminated Busbar Industry Revenue Share (%), by Material 2024 & 2032
- Figure 30: North America Laminated Busbar Industry Volume Share (%), by Material 2024 & 2032
- Figure 31: North America Laminated Busbar Industry Revenue (USD Billion), by Insulation Material 2024 & 2032
- Figure 32: North America Laminated Busbar Industry Volume (K Units), by Insulation Material 2024 & 2032
- Figure 33: North America Laminated Busbar Industry Revenue Share (%), by Insulation Material 2024 & 2032
- Figure 34: North America Laminated Busbar Industry Volume Share (%), by Insulation Material 2024 & 2032
- Figure 35: North America Laminated Busbar Industry Revenue (USD Billion), by End-User 2024 & 2032
- Figure 36: North America Laminated Busbar Industry Volume (K Units), by End-User 2024 & 2032
- Figure 37: North America Laminated Busbar Industry Revenue Share (%), by End-User 2024 & 2032
- Figure 38: North America Laminated Busbar Industry Volume Share (%), by End-User 2024 & 2032
- Figure 39: North America Laminated Busbar Industry Revenue (USD Billion), by Country 2024 & 2032
- Figure 40: North America Laminated Busbar Industry Volume (K Units), by Country 2024 & 2032
- Figure 41: North America Laminated Busbar Industry Revenue Share (%), by Country 2024 & 2032
- Figure 42: North America Laminated Busbar Industry Volume Share (%), by Country 2024 & 2032
- Figure 43: Europe Laminated Busbar Industry Revenue (USD Billion), by Material 2024 & 2032
- Figure 44: Europe Laminated Busbar Industry Volume (K Units), by Material 2024 & 2032
- Figure 45: Europe Laminated Busbar Industry Revenue Share (%), by Material 2024 & 2032
- Figure 46: Europe Laminated Busbar Industry Volume Share (%), by Material 2024 & 2032
- Figure 47: Europe Laminated Busbar Industry Revenue (USD Billion), by Insulation Material 2024 & 2032
- Figure 48: Europe Laminated Busbar Industry Volume (K Units), by Insulation Material 2024 & 2032
- Figure 49: Europe Laminated Busbar Industry Revenue Share (%), by Insulation Material 2024 & 2032
- Figure 50: Europe Laminated Busbar Industry Volume Share (%), by Insulation Material 2024 & 2032
- Figure 51: Europe Laminated Busbar Industry Revenue (USD Billion), by End-User 2024 & 2032
- Figure 52: Europe Laminated Busbar Industry Volume (K Units), by End-User 2024 & 2032
- Figure 53: Europe Laminated Busbar Industry Revenue Share (%), by End-User 2024 & 2032
- Figure 54: Europe Laminated Busbar Industry Volume Share (%), by End-User 2024 & 2032
- Figure 55: Europe Laminated Busbar Industry Revenue (USD Billion), by Country 2024 & 2032
- Figure 56: Europe Laminated Busbar Industry Volume (K Units), by Country 2024 & 2032
- Figure 57: Europe Laminated Busbar Industry Revenue Share (%), by Country 2024 & 2032
- Figure 58: Europe Laminated Busbar Industry Volume Share (%), by Country 2024 & 2032
- Figure 59: Asia Pacific Laminated Busbar Industry Revenue (USD Billion), by Material 2024 & 2032
- Figure 60: Asia Pacific Laminated Busbar Industry Volume (K Units), by Material 2024 & 2032
- Figure 61: Asia Pacific Laminated Busbar Industry Revenue Share (%), by Material 2024 & 2032
- Figure 62: Asia Pacific Laminated Busbar Industry Volume Share (%), by Material 2024 & 2032
- Figure 63: Asia Pacific Laminated Busbar Industry Revenue (USD Billion), by Insulation Material 2024 & 2032
- Figure 64: Asia Pacific Laminated Busbar Industry Volume (K Units), by Insulation Material 2024 & 2032
- Figure 65: Asia Pacific Laminated Busbar Industry Revenue Share (%), by Insulation Material 2024 & 2032
- Figure 66: Asia Pacific Laminated Busbar Industry Volume Share (%), by Insulation Material 2024 & 2032
- Figure 67: Asia Pacific Laminated Busbar Industry Revenue (USD Billion), by End-User 2024 & 2032
- Figure 68: Asia Pacific Laminated Busbar Industry Volume (K Units), by End-User 2024 & 2032
- Figure 69: Asia Pacific Laminated Busbar Industry Revenue Share (%), by End-User 2024 & 2032
- Figure 70: Asia Pacific Laminated Busbar Industry Volume Share (%), by End-User 2024 & 2032
- Figure 71: Asia Pacific Laminated Busbar Industry Revenue (USD Billion), by Country 2024 & 2032
- Figure 72: Asia Pacific Laminated Busbar Industry Volume (K Units), by Country 2024 & 2032
- Figure 73: Asia Pacific Laminated Busbar Industry Revenue Share (%), by Country 2024 & 2032
- Figure 74: Asia Pacific Laminated Busbar Industry Volume Share (%), by Country 2024 & 2032
- Figure 75: South America Laminated Busbar Industry Revenue (USD Billion), by Material 2024 & 2032
- Figure 76: South America Laminated Busbar Industry Volume (K Units), by Material 2024 & 2032
- Figure 77: South America Laminated Busbar Industry Revenue Share (%), by Material 2024 & 2032
- Figure 78: South America Laminated Busbar Industry Volume Share (%), by Material 2024 & 2032
- Figure 79: South America Laminated Busbar Industry Revenue (USD Billion), by Insulation Material 2024 & 2032
- Figure 80: South America Laminated Busbar Industry Volume (K Units), by Insulation Material 2024 & 2032
- Figure 81: South America Laminated Busbar Industry Revenue Share (%), by Insulation Material 2024 & 2032
- Figure 82: South America Laminated Busbar Industry Volume Share (%), by Insulation Material 2024 & 2032
- Figure 83: South America Laminated Busbar Industry Revenue (USD Billion), by End-User 2024 & 2032
- Figure 84: South America Laminated Busbar Industry Volume (K Units), by End-User 2024 & 2032
- Figure 85: South America Laminated Busbar Industry Revenue Share (%), by End-User 2024 & 2032
- Figure 86: South America Laminated Busbar Industry Volume Share (%), by End-User 2024 & 2032
- Figure 87: South America Laminated Busbar Industry Revenue (USD Billion), by Country 2024 & 2032
- Figure 88: South America Laminated Busbar Industry Volume (K Units), by Country 2024 & 2032
- Figure 89: South America Laminated Busbar Industry Revenue Share (%), by Country 2024 & 2032
- Figure 90: South America Laminated Busbar Industry Volume Share (%), by Country 2024 & 2032
- Figure 91: Middle East Laminated Busbar Industry Revenue (USD Billion), by Material 2024 & 2032
- Figure 92: Middle East Laminated Busbar Industry Volume (K Units), by Material 2024 & 2032
- Figure 93: Middle East Laminated Busbar Industry Revenue Share (%), by Material 2024 & 2032
- Figure 94: Middle East Laminated Busbar Industry Volume Share (%), by Material 2024 & 2032
- Figure 95: Middle East Laminated Busbar Industry Revenue (USD Billion), by Insulation Material 2024 & 2032
- Figure 96: Middle East Laminated Busbar Industry Volume (K Units), by Insulation Material 2024 & 2032
- Figure 97: Middle East Laminated Busbar Industry Revenue Share (%), by Insulation Material 2024 & 2032
- Figure 98: Middle East Laminated Busbar Industry Volume Share (%), by Insulation Material 2024 & 2032
- Figure 99: Middle East Laminated Busbar Industry Revenue (USD Billion), by End-User 2024 & 2032
- Figure 100: Middle East Laminated Busbar Industry Volume (K Units), by End-User 2024 & 2032
- Figure 101: Middle East Laminated Busbar Industry Revenue Share (%), by End-User 2024 & 2032
- Figure 102: Middle East Laminated Busbar Industry Volume Share (%), by End-User 2024 & 2032
- Figure 103: Middle East Laminated Busbar Industry Revenue (USD Billion), by Country 2024 & 2032
- Figure 104: Middle East Laminated Busbar Industry Volume (K Units), by Country 2024 & 2032
- Figure 105: Middle East Laminated Busbar Industry Revenue Share (%), by Country 2024 & 2032
- Figure 106: Middle East Laminated Busbar Industry Volume Share (%), by Country 2024 & 2032
List of Tables
- Table 1: Global Laminated Busbar Industry Revenue USD Billion Forecast, by Region 2019 & 2032
- Table 2: Global Laminated Busbar Industry Volume K Units Forecast, by Region 2019 & 2032
- Table 3: Global Laminated Busbar Industry Revenue USD Billion Forecast, by Material 2019 & 2032
- Table 4: Global Laminated Busbar Industry Volume K Units Forecast, by Material 2019 & 2032
- Table 5: Global Laminated Busbar Industry Revenue USD Billion Forecast, by Insulation Material 2019 & 2032
- Table 6: Global Laminated Busbar Industry Volume K Units Forecast, by Insulation Material 2019 & 2032
- Table 7: Global Laminated Busbar Industry Revenue USD Billion Forecast, by End-User 2019 & 2032
- Table 8: Global Laminated Busbar Industry Volume K Units Forecast, by End-User 2019 & 2032
- Table 9: Global Laminated Busbar Industry Revenue USD Billion Forecast, by Region 2019 & 2032
- Table 10: Global Laminated Busbar Industry Volume K Units Forecast, by Region 2019 & 2032
- Table 11: Global Laminated Busbar Industry Revenue USD Billion Forecast, by Country 2019 & 2032
- Table 12: Global Laminated Busbar Industry Volume K Units Forecast, by Country 2019 & 2032
- Table 13: United States Laminated Busbar Industry Revenue (USD Billion) Forecast, by Application 2019 & 2032
- Table 14: United States Laminated Busbar Industry Volume (K Units) Forecast, by Application 2019 & 2032
- Table 15: Canada Laminated Busbar Industry Revenue (USD Billion) Forecast, by Application 2019 & 2032
- Table 16: Canada Laminated Busbar Industry Volume (K Units) Forecast, by Application 2019 & 2032
- Table 17: Mexico Laminated Busbar Industry Revenue (USD Billion) Forecast, by Application 2019 & 2032
- Table 18: Mexico Laminated Busbar Industry Volume (K Units) Forecast, by Application 2019 & 2032
- Table 19: Global Laminated Busbar Industry Revenue USD Billion Forecast, by Country 2019 & 2032
- Table 20: Global Laminated Busbar Industry Volume K Units Forecast, by Country 2019 & 2032
- Table 21: Germany Laminated Busbar Industry Revenue (USD Billion) Forecast, by Application 2019 & 2032
- Table 22: Germany Laminated Busbar Industry Volume (K Units) Forecast, by Application 2019 & 2032
- Table 23: United Kingdom Laminated Busbar Industry Revenue (USD Billion) Forecast, by Application 2019 & 2032
- Table 24: United Kingdom Laminated Busbar Industry Volume (K Units) Forecast, by Application 2019 & 2032
- Table 25: France Laminated Busbar Industry Revenue (USD Billion) Forecast, by Application 2019 & 2032
- Table 26: France Laminated Busbar Industry Volume (K Units) Forecast, by Application 2019 & 2032
- Table 27: Spain Laminated Busbar Industry Revenue (USD Billion) Forecast, by Application 2019 & 2032
- Table 28: Spain Laminated Busbar Industry Volume (K Units) Forecast, by Application 2019 & 2032
- Table 29: Italy Laminated Busbar Industry Revenue (USD Billion) Forecast, by Application 2019 & 2032
- Table 30: Italy Laminated Busbar Industry Volume (K Units) Forecast, by Application 2019 & 2032
- Table 31: Spain Laminated Busbar Industry Revenue (USD Billion) Forecast, by Application 2019 & 2032
- Table 32: Spain Laminated Busbar Industry Volume (K Units) Forecast, by Application 2019 & 2032
- Table 33: Belgium Laminated Busbar Industry Revenue (USD Billion) Forecast, by Application 2019 & 2032
- Table 34: Belgium Laminated Busbar Industry Volume (K Units) Forecast, by Application 2019 & 2032
- Table 35: Netherland Laminated Busbar Industry Revenue (USD Billion) Forecast, by Application 2019 & 2032
- Table 36: Netherland Laminated Busbar Industry Volume (K Units) Forecast, by Application 2019 & 2032
- Table 37: Nordics Laminated Busbar Industry Revenue (USD Billion) Forecast, by Application 2019 & 2032
- Table 38: Nordics Laminated Busbar Industry Volume (K Units) Forecast, by Application 2019 & 2032
- Table 39: Rest of Europe Laminated Busbar Industry Revenue (USD Billion) Forecast, by Application 2019 & 2032
- Table 40: Rest of Europe Laminated Busbar Industry Volume (K Units) Forecast, by Application 2019 & 2032
- Table 41: Global Laminated Busbar Industry Revenue USD Billion Forecast, by Country 2019 & 2032
- Table 42: Global Laminated Busbar Industry Volume K Units Forecast, by Country 2019 & 2032
- Table 43: China Laminated Busbar Industry Revenue (USD Billion) Forecast, by Application 2019 & 2032
- Table 44: China Laminated Busbar Industry Volume (K Units) Forecast, by Application 2019 & 2032
- Table 45: Japan Laminated Busbar Industry Revenue (USD Billion) Forecast, by Application 2019 & 2032
- Table 46: Japan Laminated Busbar Industry Volume (K Units) Forecast, by Application 2019 & 2032
- Table 47: India Laminated Busbar Industry Revenue (USD Billion) Forecast, by Application 2019 & 2032
- Table 48: India Laminated Busbar Industry Volume (K Units) Forecast, by Application 2019 & 2032
- Table 49: South Korea Laminated Busbar Industry Revenue (USD Billion) Forecast, by Application 2019 & 2032
- Table 50: South Korea Laminated Busbar Industry Volume (K Units) Forecast, by Application 2019 & 2032
- Table 51: Southeast Asia Laminated Busbar Industry Revenue (USD Billion) Forecast, by Application 2019 & 2032
- Table 52: Southeast Asia Laminated Busbar Industry Volume (K Units) Forecast, by Application 2019 & 2032
- Table 53: Australia Laminated Busbar Industry Revenue (USD Billion) Forecast, by Application 2019 & 2032
- Table 54: Australia Laminated Busbar Industry Volume (K Units) Forecast, by Application 2019 & 2032
- Table 55: Indonesia Laminated Busbar Industry Revenue (USD Billion) Forecast, by Application 2019 & 2032
- Table 56: Indonesia Laminated Busbar Industry Volume (K Units) Forecast, by Application 2019 & 2032
- Table 57: Phillipes Laminated Busbar Industry Revenue (USD Billion) Forecast, by Application 2019 & 2032
- Table 58: Phillipes Laminated Busbar Industry Volume (K Units) Forecast, by Application 2019 & 2032
- Table 59: Singapore Laminated Busbar Industry Revenue (USD Billion) Forecast, by Application 2019 & 2032
- Table 60: Singapore Laminated Busbar Industry Volume (K Units) Forecast, by Application 2019 & 2032
- Table 61: Thailandc Laminated Busbar Industry Revenue (USD Billion) Forecast, by Application 2019 & 2032
- Table 62: Thailandc Laminated Busbar Industry Volume (K Units) Forecast, by Application 2019 & 2032
- Table 63: Rest of Asia Pacific Laminated Busbar Industry Revenue (USD Billion) Forecast, by Application 2019 & 2032
- Table 64: Rest of Asia Pacific Laminated Busbar Industry Volume (K Units) Forecast, by Application 2019 & 2032
- Table 65: Global Laminated Busbar Industry Revenue USD Billion Forecast, by Country 2019 & 2032
- Table 66: Global Laminated Busbar Industry Volume K Units Forecast, by Country 2019 & 2032
- Table 67: Brazil Laminated Busbar Industry Revenue (USD Billion) Forecast, by Application 2019 & 2032
- Table 68: Brazil Laminated Busbar Industry Volume (K Units) Forecast, by Application 2019 & 2032
- Table 69: Argentina Laminated Busbar Industry Revenue (USD Billion) Forecast, by Application 2019 & 2032
- Table 70: Argentina Laminated Busbar Industry Volume (K Units) Forecast, by Application 2019 & 2032
- Table 71: Peru Laminated Busbar Industry Revenue (USD Billion) Forecast, by Application 2019 & 2032
- Table 72: Peru Laminated Busbar Industry Volume (K Units) Forecast, by Application 2019 & 2032
- Table 73: Chile Laminated Busbar Industry Revenue (USD Billion) Forecast, by Application 2019 & 2032
- Table 74: Chile Laminated Busbar Industry Volume (K Units) Forecast, by Application 2019 & 2032
- Table 75: Colombia Laminated Busbar Industry Revenue (USD Billion) Forecast, by Application 2019 & 2032
- Table 76: Colombia Laminated Busbar Industry Volume (K Units) Forecast, by Application 2019 & 2032
- Table 77: Ecuador Laminated Busbar Industry Revenue (USD Billion) Forecast, by Application 2019 & 2032
- Table 78: Ecuador Laminated Busbar Industry Volume (K Units) Forecast, by Application 2019 & 2032
- Table 79: Venezuela Laminated Busbar Industry Revenue (USD Billion) Forecast, by Application 2019 & 2032
- Table 80: Venezuela Laminated Busbar Industry Volume (K Units) Forecast, by Application 2019 & 2032
- Table 81: Rest of South America Laminated Busbar Industry Revenue (USD Billion) Forecast, by Application 2019 & 2032
- Table 82: Rest of South America Laminated Busbar Industry Volume (K Units) Forecast, by Application 2019 & 2032
- Table 83: Global Laminated Busbar Industry Revenue USD Billion Forecast, by Country 2019 & 2032
- Table 84: Global Laminated Busbar Industry Volume K Units Forecast, by Country 2019 & 2032
- Table 85: United States Laminated Busbar Industry Revenue (USD Billion) Forecast, by Application 2019 & 2032
- Table 86: United States Laminated Busbar Industry Volume (K Units) Forecast, by Application 2019 & 2032
- Table 87: Canada Laminated Busbar Industry Revenue (USD Billion) Forecast, by Application 2019 & 2032
- Table 88: Canada Laminated Busbar Industry Volume (K Units) Forecast, by Application 2019 & 2032
- Table 89: Mexico Laminated Busbar Industry Revenue (USD Billion) Forecast, by Application 2019 & 2032
- Table 90: Mexico Laminated Busbar Industry Volume (K Units) Forecast, by Application 2019 & 2032
- Table 91: Global Laminated Busbar Industry Revenue USD Billion Forecast, by Country 2019 & 2032
- Table 92: Global Laminated Busbar Industry Volume K Units Forecast, by Country 2019 & 2032
- Table 93: United Arab Emirates Laminated Busbar Industry Revenue (USD Billion) Forecast, by Application 2019 & 2032
- Table 94: United Arab Emirates Laminated Busbar Industry Volume (K Units) Forecast, by Application 2019 & 2032
- Table 95: Saudi Arabia Laminated Busbar Industry Revenue (USD Billion) Forecast, by Application 2019 & 2032
- Table 96: Saudi Arabia Laminated Busbar Industry Volume (K Units) Forecast, by Application 2019 & 2032
- Table 97: South Africa Laminated Busbar Industry Revenue (USD Billion) Forecast, by Application 2019 & 2032
- Table 98: South Africa Laminated Busbar Industry Volume (K Units) Forecast, by Application 2019 & 2032
- Table 99: Rest of Middle East and Africa Laminated Busbar Industry Revenue (USD Billion) Forecast, by Application 2019 & 2032
- Table 100: Rest of Middle East and Africa Laminated Busbar Industry Volume (K Units) Forecast, by Application 2019 & 2032
- Table 101: Global Laminated Busbar Industry Revenue USD Billion Forecast, by Material 2019 & 2032
- Table 102: Global Laminated Busbar Industry Volume K Units Forecast, by Material 2019 & 2032
- Table 103: Global Laminated Busbar Industry Revenue USD Billion Forecast, by Insulation Material 2019 & 2032
- Table 104: Global Laminated Busbar Industry Volume K Units Forecast, by Insulation Material 2019 & 2032
- Table 105: Global Laminated Busbar Industry Revenue USD Billion Forecast, by End-User 2019 & 2032
- Table 106: Global Laminated Busbar Industry Volume K Units Forecast, by End-User 2019 & 2032
- Table 107: Global Laminated Busbar Industry Revenue USD Billion Forecast, by Country 2019 & 2032
- Table 108: Global Laminated Busbar Industry Volume K Units Forecast, by Country 2019 & 2032
- Table 109: Global Laminated Busbar Industry Revenue USD Billion Forecast, by Material 2019 & 2032
- Table 110: Global Laminated Busbar Industry Volume K Units Forecast, by Material 2019 & 2032
- Table 111: Global Laminated Busbar Industry Revenue USD Billion Forecast, by Insulation Material 2019 & 2032
- Table 112: Global Laminated Busbar Industry Volume K Units Forecast, by Insulation Material 2019 & 2032
- Table 113: Global Laminated Busbar Industry Revenue USD Billion Forecast, by End-User 2019 & 2032
- Table 114: Global Laminated Busbar Industry Volume K Units Forecast, by End-User 2019 & 2032
- Table 115: Global Laminated Busbar Industry Revenue USD Billion Forecast, by Country 2019 & 2032
- Table 116: Global Laminated Busbar Industry Volume K Units Forecast, by Country 2019 & 2032
- Table 117: Global Laminated Busbar Industry Revenue USD Billion Forecast, by Material 2019 & 2032
- Table 118: Global Laminated Busbar Industry Volume K Units Forecast, by Material 2019 & 2032
- Table 119: Global Laminated Busbar Industry Revenue USD Billion Forecast, by Insulation Material 2019 & 2032
- Table 120: Global Laminated Busbar Industry Volume K Units Forecast, by Insulation Material 2019 & 2032
- Table 121: Global Laminated Busbar Industry Revenue USD Billion Forecast, by End-User 2019 & 2032
- Table 122: Global Laminated Busbar Industry Volume K Units Forecast, by End-User 2019 & 2032
- Table 123: Global Laminated Busbar Industry Revenue USD Billion Forecast, by Country 2019 & 2032
- Table 124: Global Laminated Busbar Industry Volume K Units Forecast, by Country 2019 & 2032
- Table 125: Global Laminated Busbar Industry Revenue USD Billion Forecast, by Material 2019 & 2032
- Table 126: Global Laminated Busbar Industry Volume K Units Forecast, by Material 2019 & 2032
- Table 127: Global Laminated Busbar Industry Revenue USD Billion Forecast, by Insulation Material 2019 & 2032
- Table 128: Global Laminated Busbar Industry Volume K Units Forecast, by Insulation Material 2019 & 2032
- Table 129: Global Laminated Busbar Industry Revenue USD Billion Forecast, by End-User 2019 & 2032
- Table 130: Global Laminated Busbar Industry Volume K Units Forecast, by End-User 2019 & 2032
- Table 131: Global Laminated Busbar Industry Revenue USD Billion Forecast, by Country 2019 & 2032
- Table 132: Global Laminated Busbar Industry Volume K Units Forecast, by Country 2019 & 2032
- Table 133: Global Laminated Busbar Industry Revenue USD Billion Forecast, by Material 2019 & 2032
- Table 134: Global Laminated Busbar Industry Volume K Units Forecast, by Material 2019 & 2032
- Table 135: Global Laminated Busbar Industry Revenue USD Billion Forecast, by Insulation Material 2019 & 2032
- Table 136: Global Laminated Busbar Industry Volume K Units Forecast, by Insulation Material 2019 & 2032
- Table 137: Global Laminated Busbar Industry Revenue USD Billion Forecast, by End-User 2019 & 2032
- Table 138: Global Laminated Busbar Industry Volume K Units Forecast, by End-User 2019 & 2032
- Table 139: Global Laminated Busbar Industry Revenue USD Billion Forecast, by Country 2019 & 2032
- Table 140: Global Laminated Busbar Industry Volume K Units Forecast, by Country 2019 & 2032
Frequently Asked Questions
1. What is the projected Compound Annual Growth Rate (CAGR) of the Laminated Busbar Industry?
The projected CAGR is approximately 6.02%.
2. Which companies are prominent players in the Laminated Busbar Industry?
Key companies in the market include Methode Electronics Inc, Suzhou West Deane Machinery Inc, Electronic Systems Packaging LLC, Molex LLC, Ryoden Kasei Co Ltd, Rogers Corporation, Shanghai Eagtop Electronic Technology Co Ltd, Eaton Corporation PLC, Amphenol Corporation, Segue Electronics Inc *List Not Exhaustive, Zhejiang RHI ELectric Co Ltd, Mersen SA, Zhuzhou CRRC Times Electric Co Ltd, Sun King Power Electronics Group Ltd, Raychem RPG Private Limited, EMS Industrial & Service Company, Storm Power Components.
3. What are the main segments of the Laminated Busbar Industry?
The market segments include Material, Insulation Material, End-User.
4. Can you provide details about the market size?
The market size is estimated to be USD 0.78 USD Billion as of 2022.
5. What are some drivers contributing to market growth?
4.; Growing Energy Demand4.; Renewable Energy Transition.
6. What are the notable trends driving market growth?
Power Utility Sub-sector to Dominate the Market.
7. Are there any restraints impacting market growth?
4.; Phasing out of Conventional Sources of Electricity.
8. Can you provide examples of recent developments in the market?
In February 2020, ABB Ltd planned to introduce laminated bus plate technology for low-voltage switchgear. The new technology is combined with the ABB Ability platform, and it offers the highest reliability, better efficiency, maximum safety, more flexibility, and measurable return on investment (ROI).
9. What pricing options are available for accessing the report?
Pricing options include single-user, multi-user, and enterprise licenses priced at USD 4750, USD 5250, and USD 8750 respectively.
10. Is the market size provided in terms of value or volume?
The market size is provided in terms of value, measured in USD Billion and volume, measured in K Units.
11. Are there any specific market keywords associated with the report?
Yes, the market keyword associated with the report is "Laminated Busbar Industry," which aids in identifying and referencing the specific market segment covered.
12. How do I determine which pricing option suits my needs best?
The pricing options vary based on user requirements and access needs. Individual users may opt for single-user licenses, while businesses requiring broader access may choose multi-user or enterprise licenses for cost-effective access to the report.
13. Are there any additional resources or data provided in the Laminated Busbar Industry report?
While the report offers comprehensive insights, it's advisable to review the specific contents or supplementary materials provided to ascertain if additional resources or data are available.
14. How can I stay updated on further developments or reports in the Laminated Busbar Industry?
To stay informed about further developments, trends, and reports in the Laminated Busbar Industry, consider subscribing to industry newsletters, following relevant companies and organizations, or regularly checking reputable industry news sources and publications.
Methodology
Step 1 - Identification of Relevant Samples Size from Population Database


Step 2 - Approaches for Defining Global Market Size (Value, Volume* & Price*)

Note*: In applicable scenarios
Step 3 - Data Sources
Primary Research
- Web Analytics
- Survey Reports
- Research Institute
- Latest Research Reports
- Opinion Leaders
Secondary Research
- Annual Reports
- White Paper
- Latest Press Release
- Industry Association
- Paid Database
- Investor Presentations

Step 4 - Data Triangulation
Involves using different sources of information in order to increase the validity of a study
These sources are likely to be stakeholders in a program - participants, other researchers, program staff, other community members, and so on.
Then we put all data in single framework & apply various statistical tools to find out the dynamic on the market.
During the analysis stage, feedback from the stakeholder groups would be compared to determine areas of agreement as well as areas of divergence


