
Key Insights
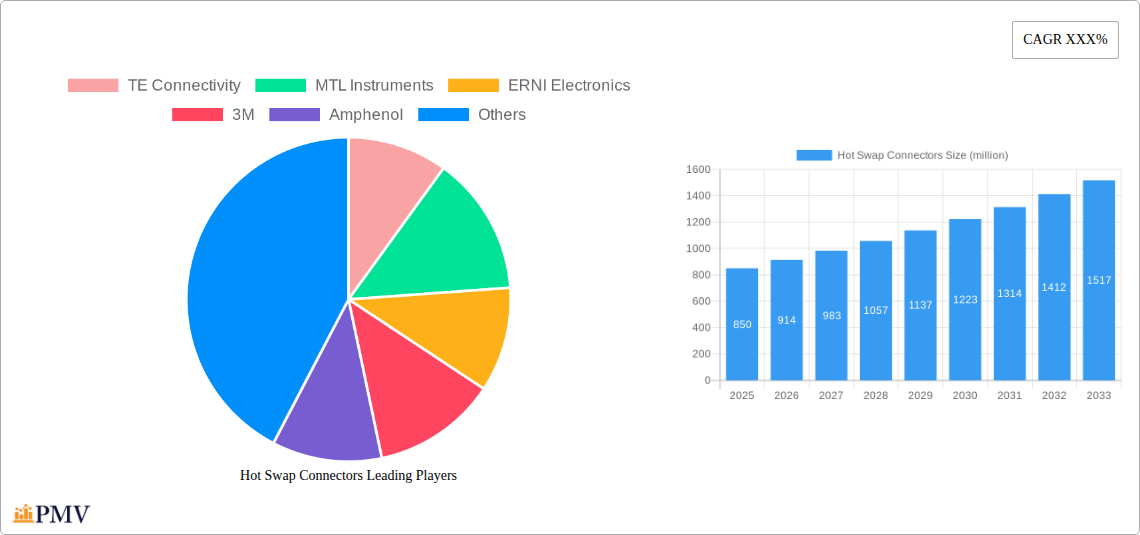
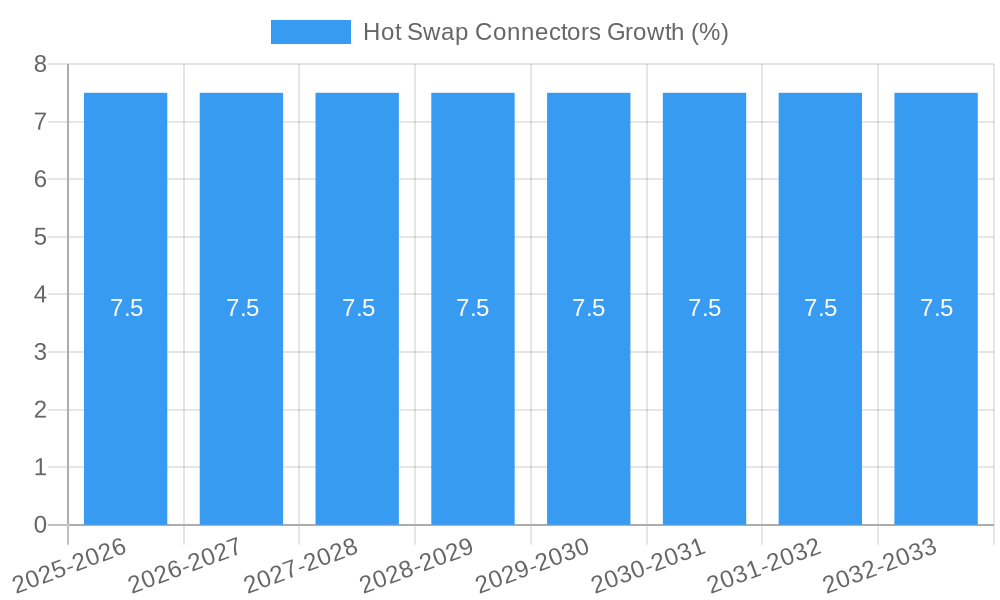
The global market for Hot Swap Connectors is poised for significant expansion, driven by the escalating demand for high-reliability and continuous operation across critical industries. With a projected market size of approximately \$850 million in 2025, the sector is set to grow at a robust Compound Annual Growth Rate (CAGR) of around 7.5% through 2033. This surge is primarily fueled by the increasing adoption of advanced technologies in the military and aerospace sectors, where uninterrupted power and data flow are paramount for mission success. The medical equipment industry also presents a substantial growth opportunity, with the rise of sophisticated diagnostic and life-support systems requiring the reliability offered by hot-swappable components. Furthermore, the burgeoning consumer electronics market, characterized by its rapid product cycles and demand for upgradeability, is a key contributor to this upward trajectory.
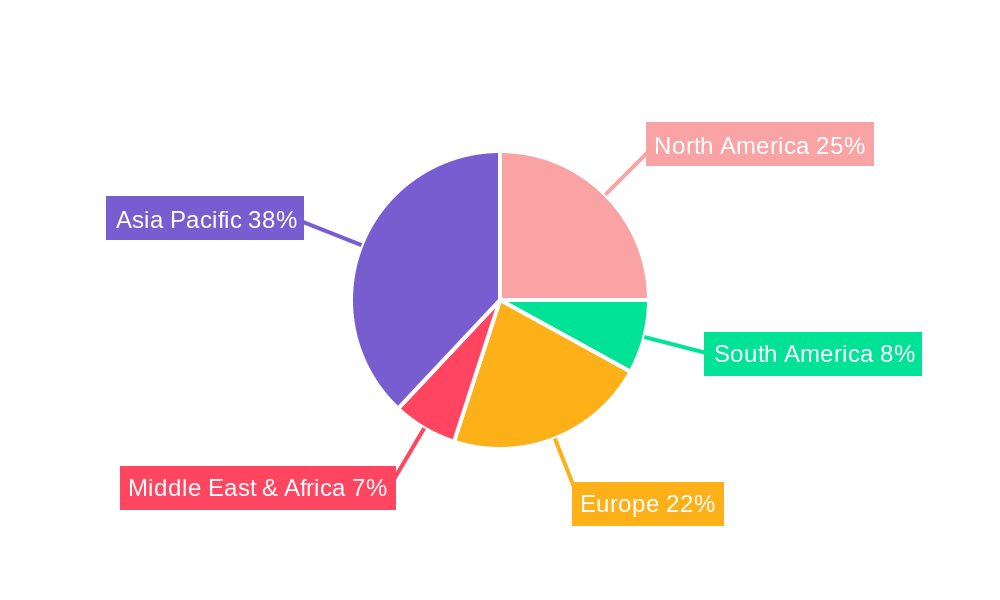
While the market exhibits strong growth potential, it faces certain restraints, including the high cost of specialized components and the complexity of integration in some niche applications. However, ongoing technological advancements in miniaturization, increased current carrying capacity, and improved thermal management are continuously addressing these challenges. The market segmentation reveals a strong preference for multi-plug connectors, owing to their versatility and efficiency in accommodating multiple connections simultaneously, particularly in high-density applications. Key players such as TE Connectivity, Amphenol, and 3M are at the forefront of innovation, developing next-generation hot swap connectors that enhance performance and address evolving industry needs. The Asia Pacific region, led by China and India, is expected to be a major growth engine due to its rapidly expanding manufacturing base and increasing investment in advanced technology sectors.
Hot Swap Connectors Market Analysis Report: 2025-2033
This comprehensive report provides an in-depth analysis of the global hot swap connectors market, examining its structure, competitive landscape, emerging trends, and future outlook from 2019 to 2033. With a base year of 2025 and a forecast period extending to 2033, this study offers actionable insights for stakeholders seeking to understand and capitalize on the growth opportunities within this dynamic sector. The report delves into critical applications, including military, aerospace, medical equipment, and consumer electronics, as well as connector types such as single plug and multi-plug configurations.
Hot Swap Connectors Market Structure & Competitive Dynamics
The hot swap connectors market exhibits a moderately concentrated structure, with key players like TE Connectivity, MTL Instruments, ERNI Electronics, 3M, Amphenol, and NORCO dominating significant market share, estimated at over seventy million dollars collectively in the base year. Innovation ecosystems are driven by continuous research and development, focusing on miniaturization, higher power density, and enhanced reliability for demanding applications. Regulatory frameworks, particularly stringent in the military and aerospace sectors, influence product design and certification processes, while the increasing adoption of modular designs in medical equipment and consumer electronics fosters market expansion. Product substitutes, while present in some lower-end applications, are generally outcompeted by the specialized performance and reliability offered by dedicated hot swap solutions. End-user trends point towards a growing demand for seamless connectivity and reduced downtime across all key segments. Mergers and acquisitions (M&A) activities are strategically focused on expanding product portfolios and geographical reach, with significant M&A deal values projected to exceed five hundred million dollars over the forecast period, reinforcing the competitive landscape and driving consolidation.
Hot Swap Connectors Industry Trends & Insights
The hot swap connectors industry is poised for substantial growth, projected to experience a Compound Annual Growth Rate (CAGR) of approximately 8.5% over the forecast period (2025-2033). This robust expansion is primarily fueled by the escalating demand for uninterrupted power and data transmission in mission-critical applications. The increasing complexity and miniaturization of electronic systems across military, aerospace, and medical equipment necessitate connectors that can be safely and reliably inserted or removed without powering down the entire system. For instance, advancements in avionics and battlefield communication systems are directly driving the adoption of high-performance hot swap connectors. Similarly, in the medical equipment sector, the need for sterility and continuous patient monitoring makes hot-swappable components essential for maintaining operational efficiency and patient safety.
Technological disruptions are playing a pivotal role, with innovations focusing on improved thermal management, increased contact density, and enhanced signal integrity at higher frequencies. The development of novel materials and advanced manufacturing techniques, such as additive manufacturing, is enabling the creation of more compact and robust hot swap connector solutions. Consumer preferences are also influencing the market, particularly in the consumer electronics segment, where the demand for upgradeable and serviceable devices is growing. This trend encourages the use of hot-swappable storage modules and other components, thereby increasing market penetration. The competitive dynamics within the industry are characterized by a fierce race for technological superiority and cost-effectiveness. Companies are investing heavily in R&D to develop next-generation connectors that meet evolving industry standards and application requirements. The market penetration of advanced hot swap connector technologies is expected to rise from approximately 45% in the base year to over 60% by 2033, underscoring the increasing reliance on these critical components across a wide spectrum of industries. Furthermore, the growing adoption of Industry 4.0 principles, emphasizing automation and interconnectedness, further bolsters the demand for reliable, hot-swappable interfaces.
Dominant Markets & Segments in Hot Swap Connectors
The hot swap connectors market demonstrates significant dominance across several key regions and application segments. North America currently leads the market, driven by its strong presence in the aerospace and military sectors, supported by substantial government spending on defense modernization and advanced aviation technologies. Within North America, the United States accounts for the largest market share due to its robust aerospace manufacturing base and significant investments in military hardware.
In terms of applications, the military segment is a dominant force, projected to account for an estimated 30% of the total market value by 2033. This dominance is attributed to the stringent requirements for reliability, durability, and quick component replacement in defense systems, such as communication equipment, radar systems, and vehicle electronics. The need for minimal downtime in combat situations makes hot-swappable components indispensable.
The aerospace segment closely follows, expected to represent approximately 25% of the market. Key drivers include the development of new aircraft platforms, satellite technology, and advanced avionics, all of which benefit from the ability to perform maintenance and upgrades without grounding aircraft. Regulatory compliance and the demand for lightweight, high-performance connectors further propel this segment.
The medical equipment segment is exhibiting remarkable growth, anticipated to capture around 20% of the market by 2033. The increasing demand for sophisticated medical devices, including patient monitoring systems, diagnostic equipment, and robotic surgical systems, where uninterrupted operation is paramount for patient care, is a major growth accelerator. The trend towards modular medical devices that allow for easy component replacement and upgrades also fuels this segment.
The consumer electronics segment, while growing, is projected to hold approximately 15% of the market. Growth here is driven by the increasing sophistication of personal computing devices, gaming consoles, and high-end audio-visual equipment that benefit from upgradeable storage solutions and easily replaceable components.
Regarding connector types, multi-plug connectors are expected to maintain a dominant position, accounting for an estimated 60% of the market. Their ability to handle multiple power and data lines simultaneously makes them ideal for complex systems in military, aerospace, and medical equipment. The single plug segment, while smaller, is crucial for specific applications requiring compact and efficient connectivity, and is projected to capture around 30% of the market. "Other" types, encompassing specialized connectors for niche applications, will constitute the remaining 10%. Economic policies, such as government incentives for defense and aerospace manufacturing, alongside infrastructure development supporting advanced electronics production, are critical drivers of regional dominance.
Hot Swap Connectors Product Innovations
Product innovations in the hot swap connectors market are primarily focused on enhancing performance, reliability, and miniaturization. Key developments include the introduction of connectors with higher current-carrying capacities and improved thermal dissipation for demanding power applications. Advancements in materials science have led to the development of ruggedized connectors resistant to extreme temperatures, vibration, and corrosive environments, making them ideal for military and aerospace applications. Miniaturization is a critical trend, with companies developing smaller footprint connectors that support higher pin densities, catering to the ever-shrinking form factors in consumer electronics and portable medical equipment. Furthermore, innovations in self-aligning and self-mating features enhance ease of use and reduce installation errors. These developments provide competitive advantages by enabling engineers to design more compact, powerful, and reliable systems.
Report Segmentation & Scope
This report segments the hot swap connectors market based on Application and Type. The Application segments include Military, Aerospace, Medical Equipment, and Consumer Electronics. The Military segment is projected to witness a CAGR of approximately 9.2%, with a market size estimated at over twenty million dollars in 2025, driven by defense modernization programs. The Aerospace segment is expected to grow at a CAGR of 8.8%, with a market size around eighteen million dollars, propelled by advancements in aircraft technology. Medical Equipment is anticipated to expand at a CAGR of 10.5%, reaching an estimated fifteen million dollars, fueled by the demand for advanced healthcare devices. The Consumer Electronics segment is projected to grow at a CAGR of 7.9%, with a market size of approximately eleven million dollars, influenced by the demand for upgradeable devices.
The Type segments encompass Single Plug, Multi-plug, and Other. The Multi-plug segment is estimated at over twenty-five million dollars in 2025 and is expected to grow at a CAGR of 9.0%, dominating the market due to its versatility. The Single Plug segment, valued at approximately ten million dollars, is projected to grow at a CAGR of 7.5%. The "Other" segment, with an estimated value of four million dollars, is expected to grow at a CAGR of 8.2%, catering to specialized needs.
Key Drivers of Hot Swap Connectors Growth
The hot swap connectors market is propelled by a confluence of technological, economic, and regulatory factors. Technological advancements, particularly in miniaturization, higher power density, and improved signal integrity, are paramount. The increasing adoption of modular design in electronic systems across all sectors necessitates connectors that facilitate seamless component replacement without system downtime. Economic growth in developing regions, coupled with increased investment in infrastructure and high-tech manufacturing, is also a significant driver. Furthermore, the growing emphasis on operational efficiency and reduced maintenance costs across industries directly translates to a higher demand for hot-swappable solutions. Regulatory mandates in sectors like defense and aerospace, which prioritize safety and reliability, further encourage the adoption of these specialized connectors. For example, the push for advanced avionics in the aerospace industry directly fuels the demand for reliable hot swap connectors.
Challenges in the Hot Swap Connectors Sector
Despite robust growth, the hot swap connectors sector faces several challenges. High development costs associated with advanced technologies and stringent quality control requirements can impact profit margins, especially for smaller manufacturers. Supply chain disruptions, as witnessed in recent global events, can lead to material shortages and increased lead times, affecting production schedules. Intensifying competition from both established players and emerging companies necessitates continuous innovation and cost optimization. Interoperability issues between different manufacturers' connector systems can also pose a challenge for end-users seeking flexible solutions. Furthermore, the evolving standards in certain industries require ongoing investment in research and development to ensure compliance, which can be a significant barrier.
Leading Players in the Hot Swap Connectors Market
- TE Connectivity
- MTL Instruments
- ERNI Electronics
- 3M
- Amphenol
- NORCO
Key Developments in Hot Swap Connectors Sector
- January 2024: TE Connectivity launched a new series of high-power density hot swap connectors for data centers, improving thermal management and enabling smaller server designs.
- November 2023: Amphenol introduced a ruggedized hot swap connector solution designed for extreme environments in military vehicles, offering enhanced vibration resistance and sealing.
- July 2023: ERNI Electronics showcased innovative modular hot swap connectors for medical imaging equipment, facilitating easier maintenance and upgrades for advanced diagnostic devices.
- March 2023: 3M announced advancements in their tape-based hot swap connector technology, focusing on miniaturization and cost-effectiveness for consumer electronics applications.
- October 2022: NORCO unveiled a new generation of multi-pin hot swap connectors with improved contact reliability for critical aerospace systems, ensuring seamless data transfer.
Strategic Hot Swap Connectors Market Outlook
The strategic outlook for the hot swap connectors market remains exceptionally promising. The increasing demand for modularity, reliability, and reduced downtime across a broad spectrum of industries, from defense and aerospace to burgeoning sectors like electric vehicles and advanced computing, presents significant growth accelerators. Future market potential lies in the development of intelligent connectors with integrated sensing capabilities and enhanced data transmission speeds. Companies that focus on R&D for miniaturized, high-performance solutions tailored to specific industry needs, while also ensuring competitive pricing and robust supply chain management, are best positioned for success. Strategic collaborations and partnerships will also be crucial for expanding market reach and technological capabilities, further solidifying their market leadership in the evolving landscape of critical connectivity solutions.
Hot Swap Connectors Segmentation
-
1. Application
- 1.1. Military
- 1.2. Aerospace
- 1.3. Medical Equipment
- 1.4. Consumer Electronics
-
2. Type
- 2.1. Single Plug
- 2.2. Multi-plug
- 2.3. Other
Hot Swap Connectors Segmentation By Geography
-
1. North America
- 1.1. United States
- 1.2. Canada
- 1.3. Mexico
-
2. South America
- 2.1. Brazil
- 2.2. Argentina
- 2.3. Rest of South America
-
3. Europe
- 3.1. United Kingdom
- 3.2. Germany
- 3.3. France
- 3.4. Italy
- 3.5. Spain
- 3.6. Russia
- 3.7. Benelux
- 3.8. Nordics
- 3.9. Rest of Europe
-
4. Middle East & Africa
- 4.1. Turkey
- 4.2. Israel
- 4.3. GCC
- 4.4. North Africa
- 4.5. South Africa
- 4.6. Rest of Middle East & Africa
-
5. Asia Pacific
- 5.1. China
- 5.2. India
- 5.3. Japan
- 5.4. South Korea
- 5.5. ASEAN
- 5.6. Oceania
- 5.7. Rest of Asia Pacific
Hot Swap Connectors REPORT HIGHLIGHTS
| Aspects | Details |
|---|---|
| Study Period | 2019-2033 |
| Base Year | 2024 |
| Estimated Year | 2025 |
| Forecast Period | 2025-2033 |
| Historical Period | 2019-2024 |
| Growth Rate | CAGR of XXX% from 2019-2033 |
| Segmentation |
|
Table of Contents
- 1. Introduction
- 1.1. Research Scope
- 1.2. Market Segmentation
- 1.3. Research Methodology
- 1.4. Definitions and Assumptions
- 2. Executive Summary
- 2.1. Introduction
- 3. Market Dynamics
- 3.1. Introduction
- 3.2. Market Drivers
- 3.3. Market Restrains
- 3.4. Market Trends
- 4. Market Factor Analysis
- 4.1. Porters Five Forces
- 4.2. Supply/Value Chain
- 4.3. PESTEL analysis
- 4.4. Market Entropy
- 4.5. Patent/Trademark Analysis
- 5. Global Hot Swap Connectors Analysis, Insights and Forecast, 2019-2031
- 5.1. Market Analysis, Insights and Forecast - by Application
- 5.1.1. Military
- 5.1.2. Aerospace
- 5.1.3. Medical Equipment
- 5.1.4. Consumer Electronics
- 5.2. Market Analysis, Insights and Forecast - by Type
- 5.2.1. Single Plug
- 5.2.2. Multi-plug
- 5.2.3. Other
- 5.3. Market Analysis, Insights and Forecast - by Region
- 5.3.1. North America
- 5.3.2. South America
- 5.3.3. Europe
- 5.3.4. Middle East & Africa
- 5.3.5. Asia Pacific
- 5.1. Market Analysis, Insights and Forecast - by Application
- 6. North America Hot Swap Connectors Analysis, Insights and Forecast, 2019-2031
- 6.1. Market Analysis, Insights and Forecast - by Application
- 6.1.1. Military
- 6.1.2. Aerospace
- 6.1.3. Medical Equipment
- 6.1.4. Consumer Electronics
- 6.2. Market Analysis, Insights and Forecast - by Type
- 6.2.1. Single Plug
- 6.2.2. Multi-plug
- 6.2.3. Other
- 6.1. Market Analysis, Insights and Forecast - by Application
- 7. South America Hot Swap Connectors Analysis, Insights and Forecast, 2019-2031
- 7.1. Market Analysis, Insights and Forecast - by Application
- 7.1.1. Military
- 7.1.2. Aerospace
- 7.1.3. Medical Equipment
- 7.1.4. Consumer Electronics
- 7.2. Market Analysis, Insights and Forecast - by Type
- 7.2.1. Single Plug
- 7.2.2. Multi-plug
- 7.2.3. Other
- 7.1. Market Analysis, Insights and Forecast - by Application
- 8. Europe Hot Swap Connectors Analysis, Insights and Forecast, 2019-2031
- 8.1. Market Analysis, Insights and Forecast - by Application
- 8.1.1. Military
- 8.1.2. Aerospace
- 8.1.3. Medical Equipment
- 8.1.4. Consumer Electronics
- 8.2. Market Analysis, Insights and Forecast - by Type
- 8.2.1. Single Plug
- 8.2.2. Multi-plug
- 8.2.3. Other
- 8.1. Market Analysis, Insights and Forecast - by Application
- 9. Middle East & Africa Hot Swap Connectors Analysis, Insights and Forecast, 2019-2031
- 9.1. Market Analysis, Insights and Forecast - by Application
- 9.1.1. Military
- 9.1.2. Aerospace
- 9.1.3. Medical Equipment
- 9.1.4. Consumer Electronics
- 9.2. Market Analysis, Insights and Forecast - by Type
- 9.2.1. Single Plug
- 9.2.2. Multi-plug
- 9.2.3. Other
- 9.1. Market Analysis, Insights and Forecast - by Application
- 10. Asia Pacific Hot Swap Connectors Analysis, Insights and Forecast, 2019-2031
- 10.1. Market Analysis, Insights and Forecast - by Application
- 10.1.1. Military
- 10.1.2. Aerospace
- 10.1.3. Medical Equipment
- 10.1.4. Consumer Electronics
- 10.2. Market Analysis, Insights and Forecast - by Type
- 10.2.1. Single Plug
- 10.2.2. Multi-plug
- 10.2.3. Other
- 10.1. Market Analysis, Insights and Forecast - by Application
- 11. Competitive Analysis
- 11.1. Global Market Share Analysis 2024
- 11.2. Company Profiles
- 11.2.1 TE Connectivity
- 11.2.1.1. Overview
- 11.2.1.2. Products
- 11.2.1.3. SWOT Analysis
- 11.2.1.4. Recent Developments
- 11.2.1.5. Financials (Based on Availability)
- 11.2.2 MTL Instruments
- 11.2.2.1. Overview
- 11.2.2.2. Products
- 11.2.2.3. SWOT Analysis
- 11.2.2.4. Recent Developments
- 11.2.2.5. Financials (Based on Availability)
- 11.2.3 ERNI Electronics
- 11.2.3.1. Overview
- 11.2.3.2. Products
- 11.2.3.3. SWOT Analysis
- 11.2.3.4. Recent Developments
- 11.2.3.5. Financials (Based on Availability)
- 11.2.4 3M
- 11.2.4.1. Overview
- 11.2.4.2. Products
- 11.2.4.3. SWOT Analysis
- 11.2.4.4. Recent Developments
- 11.2.4.5. Financials (Based on Availability)
- 11.2.5 Amphenol
- 11.2.5.1. Overview
- 11.2.5.2. Products
- 11.2.5.3. SWOT Analysis
- 11.2.5.4. Recent Developments
- 11.2.5.5. Financials (Based on Availability)
- 11.2.6 NORCO
- 11.2.6.1. Overview
- 11.2.6.2. Products
- 11.2.6.3. SWOT Analysis
- 11.2.6.4. Recent Developments
- 11.2.6.5. Financials (Based on Availability)
- 11.2.1 TE Connectivity
List of Figures
- Figure 1: Global Hot Swap Connectors Revenue Breakdown (million, %) by Region 2024 & 2032
- Figure 2: Global Hot Swap Connectors Volume Breakdown (K, %) by Region 2024 & 2032
- Figure 3: North America Hot Swap Connectors Revenue (million), by Application 2024 & 2032
- Figure 4: North America Hot Swap Connectors Volume (K), by Application 2024 & 2032
- Figure 5: North America Hot Swap Connectors Revenue Share (%), by Application 2024 & 2032
- Figure 6: North America Hot Swap Connectors Volume Share (%), by Application 2024 & 2032
- Figure 7: North America Hot Swap Connectors Revenue (million), by Type 2024 & 2032
- Figure 8: North America Hot Swap Connectors Volume (K), by Type 2024 & 2032
- Figure 9: North America Hot Swap Connectors Revenue Share (%), by Type 2024 & 2032
- Figure 10: North America Hot Swap Connectors Volume Share (%), by Type 2024 & 2032
- Figure 11: North America Hot Swap Connectors Revenue (million), by Country 2024 & 2032
- Figure 12: North America Hot Swap Connectors Volume (K), by Country 2024 & 2032
- Figure 13: North America Hot Swap Connectors Revenue Share (%), by Country 2024 & 2032
- Figure 14: North America Hot Swap Connectors Volume Share (%), by Country 2024 & 2032
- Figure 15: South America Hot Swap Connectors Revenue (million), by Application 2024 & 2032
- Figure 16: South America Hot Swap Connectors Volume (K), by Application 2024 & 2032
- Figure 17: South America Hot Swap Connectors Revenue Share (%), by Application 2024 & 2032
- Figure 18: South America Hot Swap Connectors Volume Share (%), by Application 2024 & 2032
- Figure 19: South America Hot Swap Connectors Revenue (million), by Type 2024 & 2032
- Figure 20: South America Hot Swap Connectors Volume (K), by Type 2024 & 2032
- Figure 21: South America Hot Swap Connectors Revenue Share (%), by Type 2024 & 2032
- Figure 22: South America Hot Swap Connectors Volume Share (%), by Type 2024 & 2032
- Figure 23: South America Hot Swap Connectors Revenue (million), by Country 2024 & 2032
- Figure 24: South America Hot Swap Connectors Volume (K), by Country 2024 & 2032
- Figure 25: South America Hot Swap Connectors Revenue Share (%), by Country 2024 & 2032
- Figure 26: South America Hot Swap Connectors Volume Share (%), by Country 2024 & 2032
- Figure 27: Europe Hot Swap Connectors Revenue (million), by Application 2024 & 2032
- Figure 28: Europe Hot Swap Connectors Volume (K), by Application 2024 & 2032
- Figure 29: Europe Hot Swap Connectors Revenue Share (%), by Application 2024 & 2032
- Figure 30: Europe Hot Swap Connectors Volume Share (%), by Application 2024 & 2032
- Figure 31: Europe Hot Swap Connectors Revenue (million), by Type 2024 & 2032
- Figure 32: Europe Hot Swap Connectors Volume (K), by Type 2024 & 2032
- Figure 33: Europe Hot Swap Connectors Revenue Share (%), by Type 2024 & 2032
- Figure 34: Europe Hot Swap Connectors Volume Share (%), by Type 2024 & 2032
- Figure 35: Europe Hot Swap Connectors Revenue (million), by Country 2024 & 2032
- Figure 36: Europe Hot Swap Connectors Volume (K), by Country 2024 & 2032
- Figure 37: Europe Hot Swap Connectors Revenue Share (%), by Country 2024 & 2032
- Figure 38: Europe Hot Swap Connectors Volume Share (%), by Country 2024 & 2032
- Figure 39: Middle East & Africa Hot Swap Connectors Revenue (million), by Application 2024 & 2032
- Figure 40: Middle East & Africa Hot Swap Connectors Volume (K), by Application 2024 & 2032
- Figure 41: Middle East & Africa Hot Swap Connectors Revenue Share (%), by Application 2024 & 2032
- Figure 42: Middle East & Africa Hot Swap Connectors Volume Share (%), by Application 2024 & 2032
- Figure 43: Middle East & Africa Hot Swap Connectors Revenue (million), by Type 2024 & 2032
- Figure 44: Middle East & Africa Hot Swap Connectors Volume (K), by Type 2024 & 2032
- Figure 45: Middle East & Africa Hot Swap Connectors Revenue Share (%), by Type 2024 & 2032
- Figure 46: Middle East & Africa Hot Swap Connectors Volume Share (%), by Type 2024 & 2032
- Figure 47: Middle East & Africa Hot Swap Connectors Revenue (million), by Country 2024 & 2032
- Figure 48: Middle East & Africa Hot Swap Connectors Volume (K), by Country 2024 & 2032
- Figure 49: Middle East & Africa Hot Swap Connectors Revenue Share (%), by Country 2024 & 2032
- Figure 50: Middle East & Africa Hot Swap Connectors Volume Share (%), by Country 2024 & 2032
- Figure 51: Asia Pacific Hot Swap Connectors Revenue (million), by Application 2024 & 2032
- Figure 52: Asia Pacific Hot Swap Connectors Volume (K), by Application 2024 & 2032
- Figure 53: Asia Pacific Hot Swap Connectors Revenue Share (%), by Application 2024 & 2032
- Figure 54: Asia Pacific Hot Swap Connectors Volume Share (%), by Application 2024 & 2032
- Figure 55: Asia Pacific Hot Swap Connectors Revenue (million), by Type 2024 & 2032
- Figure 56: Asia Pacific Hot Swap Connectors Volume (K), by Type 2024 & 2032
- Figure 57: Asia Pacific Hot Swap Connectors Revenue Share (%), by Type 2024 & 2032
- Figure 58: Asia Pacific Hot Swap Connectors Volume Share (%), by Type 2024 & 2032
- Figure 59: Asia Pacific Hot Swap Connectors Revenue (million), by Country 2024 & 2032
- Figure 60: Asia Pacific Hot Swap Connectors Volume (K), by Country 2024 & 2032
- Figure 61: Asia Pacific Hot Swap Connectors Revenue Share (%), by Country 2024 & 2032
- Figure 62: Asia Pacific Hot Swap Connectors Volume Share (%), by Country 2024 & 2032
List of Tables
- Table 1: Global Hot Swap Connectors Revenue million Forecast, by Region 2019 & 2032
- Table 2: Global Hot Swap Connectors Volume K Forecast, by Region 2019 & 2032
- Table 3: Global Hot Swap Connectors Revenue million Forecast, by Application 2019 & 2032
- Table 4: Global Hot Swap Connectors Volume K Forecast, by Application 2019 & 2032
- Table 5: Global Hot Swap Connectors Revenue million Forecast, by Type 2019 & 2032
- Table 6: Global Hot Swap Connectors Volume K Forecast, by Type 2019 & 2032
- Table 7: Global Hot Swap Connectors Revenue million Forecast, by Region 2019 & 2032
- Table 8: Global Hot Swap Connectors Volume K Forecast, by Region 2019 & 2032
- Table 9: Global Hot Swap Connectors Revenue million Forecast, by Application 2019 & 2032
- Table 10: Global Hot Swap Connectors Volume K Forecast, by Application 2019 & 2032
- Table 11: Global Hot Swap Connectors Revenue million Forecast, by Type 2019 & 2032
- Table 12: Global Hot Swap Connectors Volume K Forecast, by Type 2019 & 2032
- Table 13: Global Hot Swap Connectors Revenue million Forecast, by Country 2019 & 2032
- Table 14: Global Hot Swap Connectors Volume K Forecast, by Country 2019 & 2032
- Table 15: United States Hot Swap Connectors Revenue (million) Forecast, by Application 2019 & 2032
- Table 16: United States Hot Swap Connectors Volume (K) Forecast, by Application 2019 & 2032
- Table 17: Canada Hot Swap Connectors Revenue (million) Forecast, by Application 2019 & 2032
- Table 18: Canada Hot Swap Connectors Volume (K) Forecast, by Application 2019 & 2032
- Table 19: Mexico Hot Swap Connectors Revenue (million) Forecast, by Application 2019 & 2032
- Table 20: Mexico Hot Swap Connectors Volume (K) Forecast, by Application 2019 & 2032
- Table 21: Global Hot Swap Connectors Revenue million Forecast, by Application 2019 & 2032
- Table 22: Global Hot Swap Connectors Volume K Forecast, by Application 2019 & 2032
- Table 23: Global Hot Swap Connectors Revenue million Forecast, by Type 2019 & 2032
- Table 24: Global Hot Swap Connectors Volume K Forecast, by Type 2019 & 2032
- Table 25: Global Hot Swap Connectors Revenue million Forecast, by Country 2019 & 2032
- Table 26: Global Hot Swap Connectors Volume K Forecast, by Country 2019 & 2032
- Table 27: Brazil Hot Swap Connectors Revenue (million) Forecast, by Application 2019 & 2032
- Table 28: Brazil Hot Swap Connectors Volume (K) Forecast, by Application 2019 & 2032
- Table 29: Argentina Hot Swap Connectors Revenue (million) Forecast, by Application 2019 & 2032
- Table 30: Argentina Hot Swap Connectors Volume (K) Forecast, by Application 2019 & 2032
- Table 31: Rest of South America Hot Swap Connectors Revenue (million) Forecast, by Application 2019 & 2032
- Table 32: Rest of South America Hot Swap Connectors Volume (K) Forecast, by Application 2019 & 2032
- Table 33: Global Hot Swap Connectors Revenue million Forecast, by Application 2019 & 2032
- Table 34: Global Hot Swap Connectors Volume K Forecast, by Application 2019 & 2032
- Table 35: Global Hot Swap Connectors Revenue million Forecast, by Type 2019 & 2032
- Table 36: Global Hot Swap Connectors Volume K Forecast, by Type 2019 & 2032
- Table 37: Global Hot Swap Connectors Revenue million Forecast, by Country 2019 & 2032
- Table 38: Global Hot Swap Connectors Volume K Forecast, by Country 2019 & 2032
- Table 39: United Kingdom Hot Swap Connectors Revenue (million) Forecast, by Application 2019 & 2032
- Table 40: United Kingdom Hot Swap Connectors Volume (K) Forecast, by Application 2019 & 2032
- Table 41: Germany Hot Swap Connectors Revenue (million) Forecast, by Application 2019 & 2032
- Table 42: Germany Hot Swap Connectors Volume (K) Forecast, by Application 2019 & 2032
- Table 43: France Hot Swap Connectors Revenue (million) Forecast, by Application 2019 & 2032
- Table 44: France Hot Swap Connectors Volume (K) Forecast, by Application 2019 & 2032
- Table 45: Italy Hot Swap Connectors Revenue (million) Forecast, by Application 2019 & 2032
- Table 46: Italy Hot Swap Connectors Volume (K) Forecast, by Application 2019 & 2032
- Table 47: Spain Hot Swap Connectors Revenue (million) Forecast, by Application 2019 & 2032
- Table 48: Spain Hot Swap Connectors Volume (K) Forecast, by Application 2019 & 2032
- Table 49: Russia Hot Swap Connectors Revenue (million) Forecast, by Application 2019 & 2032
- Table 50: Russia Hot Swap Connectors Volume (K) Forecast, by Application 2019 & 2032
- Table 51: Benelux Hot Swap Connectors Revenue (million) Forecast, by Application 2019 & 2032
- Table 52: Benelux Hot Swap Connectors Volume (K) Forecast, by Application 2019 & 2032
- Table 53: Nordics Hot Swap Connectors Revenue (million) Forecast, by Application 2019 & 2032
- Table 54: Nordics Hot Swap Connectors Volume (K) Forecast, by Application 2019 & 2032
- Table 55: Rest of Europe Hot Swap Connectors Revenue (million) Forecast, by Application 2019 & 2032
- Table 56: Rest of Europe Hot Swap Connectors Volume (K) Forecast, by Application 2019 & 2032
- Table 57: Global Hot Swap Connectors Revenue million Forecast, by Application 2019 & 2032
- Table 58: Global Hot Swap Connectors Volume K Forecast, by Application 2019 & 2032
- Table 59: Global Hot Swap Connectors Revenue million Forecast, by Type 2019 & 2032
- Table 60: Global Hot Swap Connectors Volume K Forecast, by Type 2019 & 2032
- Table 61: Global Hot Swap Connectors Revenue million Forecast, by Country 2019 & 2032
- Table 62: Global Hot Swap Connectors Volume K Forecast, by Country 2019 & 2032
- Table 63: Turkey Hot Swap Connectors Revenue (million) Forecast, by Application 2019 & 2032
- Table 64: Turkey Hot Swap Connectors Volume (K) Forecast, by Application 2019 & 2032
- Table 65: Israel Hot Swap Connectors Revenue (million) Forecast, by Application 2019 & 2032
- Table 66: Israel Hot Swap Connectors Volume (K) Forecast, by Application 2019 & 2032
- Table 67: GCC Hot Swap Connectors Revenue (million) Forecast, by Application 2019 & 2032
- Table 68: GCC Hot Swap Connectors Volume (K) Forecast, by Application 2019 & 2032
- Table 69: North Africa Hot Swap Connectors Revenue (million) Forecast, by Application 2019 & 2032
- Table 70: North Africa Hot Swap Connectors Volume (K) Forecast, by Application 2019 & 2032
- Table 71: South Africa Hot Swap Connectors Revenue (million) Forecast, by Application 2019 & 2032
- Table 72: South Africa Hot Swap Connectors Volume (K) Forecast, by Application 2019 & 2032
- Table 73: Rest of Middle East & Africa Hot Swap Connectors Revenue (million) Forecast, by Application 2019 & 2032
- Table 74: Rest of Middle East & Africa Hot Swap Connectors Volume (K) Forecast, by Application 2019 & 2032
- Table 75: Global Hot Swap Connectors Revenue million Forecast, by Application 2019 & 2032
- Table 76: Global Hot Swap Connectors Volume K Forecast, by Application 2019 & 2032
- Table 77: Global Hot Swap Connectors Revenue million Forecast, by Type 2019 & 2032
- Table 78: Global Hot Swap Connectors Volume K Forecast, by Type 2019 & 2032
- Table 79: Global Hot Swap Connectors Revenue million Forecast, by Country 2019 & 2032
- Table 80: Global Hot Swap Connectors Volume K Forecast, by Country 2019 & 2032
- Table 81: China Hot Swap Connectors Revenue (million) Forecast, by Application 2019 & 2032
- Table 82: China Hot Swap Connectors Volume (K) Forecast, by Application 2019 & 2032
- Table 83: India Hot Swap Connectors Revenue (million) Forecast, by Application 2019 & 2032
- Table 84: India Hot Swap Connectors Volume (K) Forecast, by Application 2019 & 2032
- Table 85: Japan Hot Swap Connectors Revenue (million) Forecast, by Application 2019 & 2032
- Table 86: Japan Hot Swap Connectors Volume (K) Forecast, by Application 2019 & 2032
- Table 87: South Korea Hot Swap Connectors Revenue (million) Forecast, by Application 2019 & 2032
- Table 88: South Korea Hot Swap Connectors Volume (K) Forecast, by Application 2019 & 2032
- Table 89: ASEAN Hot Swap Connectors Revenue (million) Forecast, by Application 2019 & 2032
- Table 90: ASEAN Hot Swap Connectors Volume (K) Forecast, by Application 2019 & 2032
- Table 91: Oceania Hot Swap Connectors Revenue (million) Forecast, by Application 2019 & 2032
- Table 92: Oceania Hot Swap Connectors Volume (K) Forecast, by Application 2019 & 2032
- Table 93: Rest of Asia Pacific Hot Swap Connectors Revenue (million) Forecast, by Application 2019 & 2032
- Table 94: Rest of Asia Pacific Hot Swap Connectors Volume (K) Forecast, by Application 2019 & 2032
Frequently Asked Questions
1. What is the projected Compound Annual Growth Rate (CAGR) of the Hot Swap Connectors?
The projected CAGR is approximately XXX%.
2. Which companies are prominent players in the Hot Swap Connectors?
Key companies in the market include TE Connectivity, MTL Instruments, ERNI Electronics, 3M, Amphenol, NORCO.
3. What are the main segments of the Hot Swap Connectors?
The market segments include Application, Type.
4. Can you provide details about the market size?
The market size is estimated to be USD XXX million as of 2022.
5. What are some drivers contributing to market growth?
N/A
6. What are the notable trends driving market growth?
N/A
7. Are there any restraints impacting market growth?
N/A
8. Can you provide examples of recent developments in the market?
N/A
9. What pricing options are available for accessing the report?
Pricing options include single-user, multi-user, and enterprise licenses priced at USD 3950.00, USD 5925.00, and USD 7900.00 respectively.
10. Is the market size provided in terms of value or volume?
The market size is provided in terms of value, measured in million and volume, measured in K.
11. Are there any specific market keywords associated with the report?
Yes, the market keyword associated with the report is "Hot Swap Connectors," which aids in identifying and referencing the specific market segment covered.
12. How do I determine which pricing option suits my needs best?
The pricing options vary based on user requirements and access needs. Individual users may opt for single-user licenses, while businesses requiring broader access may choose multi-user or enterprise licenses for cost-effective access to the report.
13. Are there any additional resources or data provided in the Hot Swap Connectors report?
While the report offers comprehensive insights, it's advisable to review the specific contents or supplementary materials provided to ascertain if additional resources or data are available.
14. How can I stay updated on further developments or reports in the Hot Swap Connectors?
To stay informed about further developments, trends, and reports in the Hot Swap Connectors, consider subscribing to industry newsletters, following relevant companies and organizations, or regularly checking reputable industry news sources and publications.
Methodology
Step 1 - Identification of Relevant Samples Size from Population Database


Step 2 - Approaches for Defining Global Market Size (Value, Volume* & Price*)

Note*: In applicable scenarios
Step 3 - Data Sources
Primary Research
- Web Analytics
- Survey Reports
- Research Institute
- Latest Research Reports
- Opinion Leaders
Secondary Research
- Annual Reports
- White Paper
- Latest Press Release
- Industry Association
- Paid Database
- Investor Presentations

Step 4 - Data Triangulation
Involves using different sources of information in order to increase the validity of a study
These sources are likely to be stakeholders in a program - participants, other researchers, program staff, other community members, and so on.
Then we put all data in single framework & apply various statistical tools to find out the dynamic on the market.
During the analysis stage, feedback from the stakeholder groups would be compared to determine areas of agreement as well as areas of divergence


