
Key Insights
The GigE Vision camera market, exhibiting a robust Compound Annual Growth Rate (CAGR) of 13.60%, is poised for significant expansion over the forecast period 2025-2033. This growth is fueled by several key drivers. The increasing automation across industrial sectors, particularly in manufacturing and logistics, demands high-speed, reliable imaging solutions, making GigE cameras a preferred choice due to their high bandwidth and ease of integration. Advancements in CMOS sensor technology are contributing to improved image quality, reduced costs, and increased functionalities such as higher resolutions and faster frame rates. The rising adoption of machine vision systems in various applications, including medical imaging, traffic monitoring, and security surveillance, further boosts market demand. Furthermore, the growing need for sophisticated quality control and inspection processes across diverse industries fuels this growth. While challenges exist, such as the complexities of integrating these systems into pre-existing infrastructure and potential competition from alternative technologies, the market's inherent advantages outweigh these restraints. The diverse segmentation, spanning various technologies (CCD and CMOS), types (area and line scan), color sensor types (monochrome and color), and end-user verticals (industrial, medical, etc.), showcases the market's broad applicability and potential for sustained growth. The presence of established players like Basler, Allied Vision, and Teledyne DALSA, along with emerging innovators, ensures a dynamic and competitive landscape.
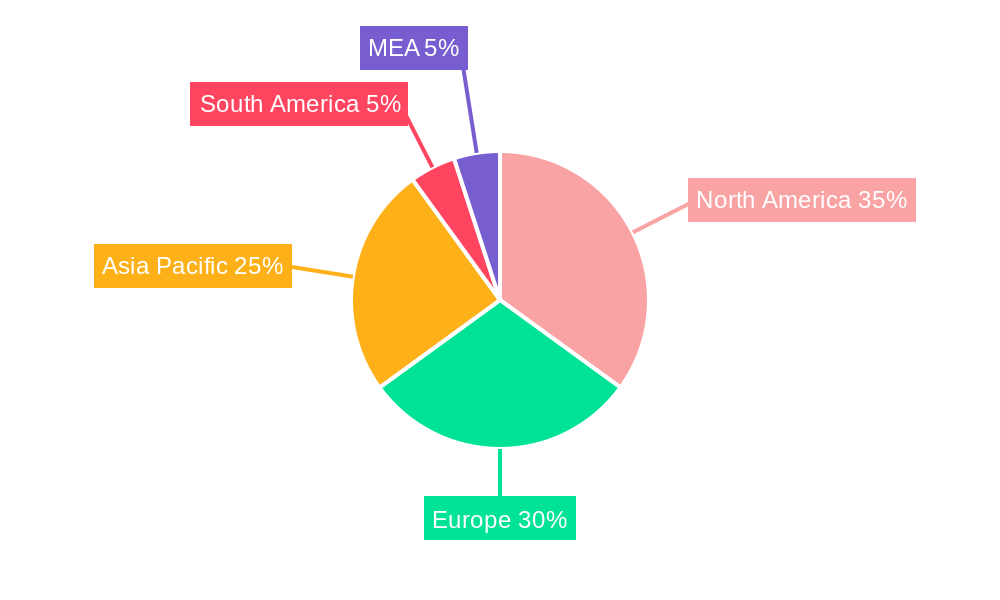
The geographical distribution of the GigE camera market shows significant growth potential across all regions. North America and Europe currently hold significant market share, driven by robust industrial automation and well-established technological infrastructure. However, the Asia-Pacific region is expected to witness substantial growth due to rapid industrialization and increasing adoption of advanced technologies in countries like China, India, and Japan. The South American and MEA markets are also anticipated to experience moderate growth, albeit at a slower pace compared to the other regions. The diverse regional landscape presents strategic opportunities for manufacturers to tailor their offerings to meet the specific needs and market dynamics of each region, further contributing to the overall expansion of the GigE camera market. This diverse regional landscape also emphasizes the need for manufacturers to adapt to local market conditions and regulations, ensuring seamless integration and widespread adoption.
GigE Camera Industry Market Report: 2019-2033
This comprehensive report provides an in-depth analysis of the global GigE Camera industry, offering valuable insights for businesses, investors, and researchers. Covering the period from 2019 to 2033, with a base year of 2025 and a forecast period of 2025-2033, this report meticulously examines market trends, competitive dynamics, and future growth potential. The global GigE camera market is estimated to be worth xx Million in 2025 and is projected to reach xx Million by 2033, exhibiting a CAGR of xx% during the forecast period.
GigE Camera Industry Market Structure & Competitive Dynamics
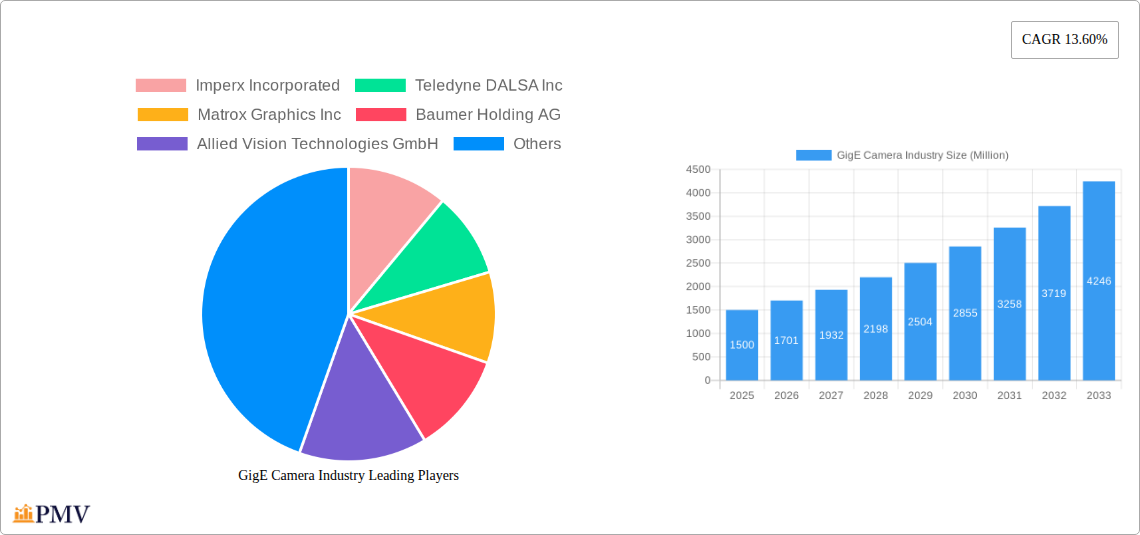
The GigE camera market is characterized by a moderately concentrated structure, with several key players holding significant market share. Imperx Incorporated, Teledyne DALSA Inc, Matrox Graphics Inc, Baumer Holding AG, Allied Vision Technologies GmbH, Pleora Technologies Inc, FLIR Integrated Imaging Solutions Inc, JAI A/S, Sensor Technologies America Inc, Basler AG, Sony Corporation, and Toshiba Teli Corporation Ltd are among the leading companies shaping the industry landscape. Market share analysis reveals that the top five players collectively account for approximately xx% of the global market in 2025.
Innovation ecosystems play a crucial role, with continuous advancements in sensor technology, image processing capabilities, and data transmission speeds driving market growth. Regulatory frameworks, particularly concerning data privacy and security in various end-user verticals, influence market dynamics. The presence of substitute technologies, such as USB3 Vision cameras, poses a competitive challenge. End-user trends, particularly the increasing adoption of automation and machine vision in industrial settings, fuel demand for GigE cameras. M&A activities within the sector, with deal values totaling xx Million in the last five years, reflect consolidation and efforts to expand market reach and technological capabilities.
- Market Concentration: Moderately concentrated, with top 5 players holding xx% market share (2025).
- Innovation: Continuous advancements in sensor technology and image processing.
- Regulatory Landscape: Data privacy and security regulations influence market dynamics.
- M&A Activity: xx Million in deal values over the last five years.
GigE Camera Industry Industry Trends & Insights
The GigE camera market is experiencing robust growth, driven by several key factors. The increasing demand for high-resolution imaging in various applications, particularly in industrial automation and machine vision, is a primary driver. Technological advancements, such as the development of higher-speed GigE Vision standards and improved sensor technologies (CMOS and CCD), enhance the capabilities and appeal of GigE cameras. Consumer preference for improved image quality and faster data transmission speeds further fuels market growth. The competitive landscape is characterized by intense rivalry, with companies investing heavily in R&D to develop innovative products and expand their market share. The market penetration rate of GigE cameras in various end-user verticals is steadily increasing, with significant growth projected in the coming years. The CAGR for the forecast period (2025-2033) is estimated at xx%.
Dominant Markets & Segments in GigE Camera Industry
The industrial sector remains the dominant end-user vertical for GigE cameras, accounting for xx% of the total market in 2025. This is driven by the increasing adoption of automation and machine vision systems across various manufacturing industries. The medical/life sciences sector is also a significant market segment, with increasing demand for high-quality imaging in medical diagnostics and research. Geographically, North America and Europe are currently leading regions in terms of GigE camera adoption.
By Technology: CMOS is the dominant technology, holding xx% of the market share in 2025, due to its superior performance and cost-effectiveness.
By Type: Area scan cameras hold a larger market share than line scan cameras due to their wider range of applications.
By Colour Sensor Type: Monochrome cameras dominate due to their superior performance in specific industrial applications.
By End-user Vertical: Industrial sector leads, followed by medical/life sciences, traffic monitoring, and security & surveillance.
Key Drivers: Strong industrial growth, increasing automation, advancements in sensor technology, demand for high-resolution imaging.
GigE Camera Industry Product Innovations
Recent product innovations focus on higher resolutions, faster frame rates, and improved image quality. Advances in sensor technology, particularly CMOS sensors, are driving smaller form factors and reduced power consumption. The development of more robust and reliable GigE Vision interfaces is addressing challenges related to long cable lengths and data transmission in demanding industrial environments. These innovations improve the market fit for applications requiring increased speed, precision, and reliability.
Report Segmentation & Scope
The report segments the GigE camera market by technology (CCD and CMOS), type (area scan and line scan), color sensor type (monochrome and color), and end-user vertical (industrial, medical/life sciences, traffic, security & surveillance, pharmaceutical, military & defense, and other). Each segment's growth projections, market size, and competitive dynamics are analyzed, providing a comprehensive overview of the market structure. The industrial sector is expected to witness the highest growth, driven by the increasing automation trend. CMOS technology is projected to dominate, while area scan cameras will retain a larger market share compared to line scan cameras.
Key Drivers of GigE Camera Industry Growth
Several factors contribute to the growth of the GigE camera industry. Technological advancements, like improved sensor technology and higher-speed data transmission, are key. Economic factors, such as increasing investments in automation across various sectors, are strong drivers. Finally, supportive regulatory frameworks that encourage the adoption of advanced technologies in various industries play a critical role.
Challenges in the GigE Camera Industry Sector
The industry faces challenges, including competition from alternative technologies and the need to manage supply chain complexities. Regulatory hurdles in specific markets and concerns regarding cybersecurity also pose challenges. Price competition among manufacturers and the need to maintain a balance between product innovation and cost-effectiveness present additional obstacles.
Leading Players in the GigE Camera Industry Market
- Imperx Incorporated
- Teledyne DALSA Inc
- Matrox Graphics Inc
- Baumer Holding AG
- Allied Vision Technologies GmbH
- Pleora Technologies Inc
- FLIR Integrated Imaging Solutions Inc
- JAI A/S
- Sensor Technologies America Inc
- Basler AG
- Sony Corporation
- Toshiba Teli Corporation Ltd
Key Developments in GigE Camera Industry Sector
- January 2023: Company X launches a new high-resolution GigE camera with enhanced low-light performance.
- June 2022: Company Y announces a strategic partnership to expand its distribution network in Asia.
- October 2021: Company Z acquires a smaller competitor, strengthening its market position. (Further specific developments would be added here with dates and company names).
Strategic GigE Camera Industry Market Outlook
The GigE camera market is poised for continued growth, driven by ongoing technological advancements, increasing automation across various industries, and the rising demand for high-quality imaging solutions. Strategic opportunities exist for companies that can innovate and differentiate their products, expand their market reach, and capitalize on emerging trends in artificial intelligence and machine learning. Focus on developing high-performance, cost-effective solutions will be critical for success in the coming years.
GigE Camera Industry Segmentation
-
1. Technology
- 1.1. Charge Coupled Device (CCD)
- 1.2. Complementary Metal- Oxide - Semiconductor (CMOS)
-
2. Type
- 2.1. Area Scan
- 2.2. Line Scan
-
3. Colour Sensor Type
- 3.1. Monochrome
-
4. End-user Vertical
- 4.1. Industrial
- 4.2. Medical / Life Sciences
- 4.3. Traffic, Security & Surveillance
- 4.4. Pharmaceutical
- 4.5. Military and Defense
- 4.6. Other End-user Verticals
GigE Camera Industry Segmentation By Geography
- 1. North America
- 2. Europe
- 3. Asia Pacific
- 4. Latin America
- 5. Middle East
GigE Camera Industry REPORT HIGHLIGHTS
| Aspects | Details |
|---|---|
| Study Period | 2019-2033 |
| Base Year | 2024 |
| Estimated Year | 2025 |
| Forecast Period | 2025-2033 |
| Historical Period | 2019-2024 |
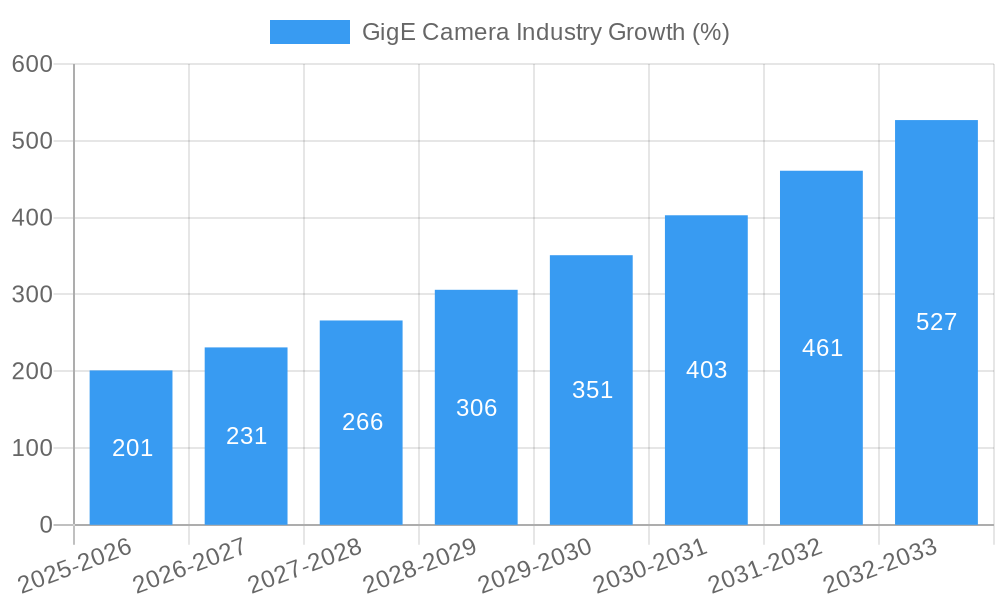
| Growth Rate | CAGR of 13.60% from 2019-2033 |
| Segmentation |
|
Table of Contents
- 1. Introduction
- 1.1. Research Scope
- 1.2. Market Segmentation
- 1.3. Research Methodology
- 1.4. Definitions and Assumptions
- 2. Executive Summary
- 2.1. Introduction
- 3. Market Dynamics
- 3.1. Introduction
- 3.2. Market Drivers
- 3.2.1. ; Efficient Data Transfer Coupled with Faster Transfer Rate; Ability to Connect with Numerous Devices
- 3.3. Market Restrains
- 3.3.1. ; Universal Drivers needed for Interoperability; Excessive Load on the CPU
- 3.4. Market Trends
- 3.4.1 Traffic
- 3.4.2 Security & Surveillance Segment to Grow Significantly
- 4. Market Factor Analysis
- 4.1. Porters Five Forces
- 4.2. Supply/Value Chain
- 4.3. PESTEL analysis
- 4.4. Market Entropy
- 4.5. Patent/Trademark Analysis
- 5. Global GigE Camera Industry Analysis, Insights and Forecast, 2019-2031
- 5.1. Market Analysis, Insights and Forecast - by Technology
- 5.1.1. Charge Coupled Device (CCD)
- 5.1.2. Complementary Metal- Oxide - Semiconductor (CMOS)
- 5.2. Market Analysis, Insights and Forecast - by Type
- 5.2.1. Area Scan
- 5.2.2. Line Scan
- 5.3. Market Analysis, Insights and Forecast - by Colour Sensor Type
- 5.3.1. Monochrome
- 5.4. Market Analysis, Insights and Forecast - by End-user Vertical
- 5.4.1. Industrial
- 5.4.2. Medical / Life Sciences
- 5.4.3. Traffic, Security & Surveillance
- 5.4.4. Pharmaceutical
- 5.4.5. Military and Defense
- 5.4.6. Other End-user Verticals
- 5.5. Market Analysis, Insights and Forecast - by Region
- 5.5.1. North America
- 5.5.2. Europe
- 5.5.3. Asia Pacific
- 5.5.4. Latin America
- 5.5.5. Middle East
- 5.1. Market Analysis, Insights and Forecast - by Technology
- 6. North America GigE Camera Industry Analysis, Insights and Forecast, 2019-2031
- 6.1. Market Analysis, Insights and Forecast - by Technology
- 6.1.1. Charge Coupled Device (CCD)
- 6.1.2. Complementary Metal- Oxide - Semiconductor (CMOS)
- 6.2. Market Analysis, Insights and Forecast - by Type
- 6.2.1. Area Scan
- 6.2.2. Line Scan
- 6.3. Market Analysis, Insights and Forecast - by Colour Sensor Type
- 6.3.1. Monochrome
- 6.4. Market Analysis, Insights and Forecast - by End-user Vertical
- 6.4.1. Industrial
- 6.4.2. Medical / Life Sciences
- 6.4.3. Traffic, Security & Surveillance
- 6.4.4. Pharmaceutical
- 6.4.5. Military and Defense
- 6.4.6. Other End-user Verticals
- 6.1. Market Analysis, Insights and Forecast - by Technology
- 7. Europe GigE Camera Industry Analysis, Insights and Forecast, 2019-2031
- 7.1. Market Analysis, Insights and Forecast - by Technology
- 7.1.1. Charge Coupled Device (CCD)
- 7.1.2. Complementary Metal- Oxide - Semiconductor (CMOS)
- 7.2. Market Analysis, Insights and Forecast - by Type
- 7.2.1. Area Scan
- 7.2.2. Line Scan
- 7.3. Market Analysis, Insights and Forecast - by Colour Sensor Type
- 7.3.1. Monochrome
- 7.4. Market Analysis, Insights and Forecast - by End-user Vertical
- 7.4.1. Industrial
- 7.4.2. Medical / Life Sciences
- 7.4.3. Traffic, Security & Surveillance
- 7.4.4. Pharmaceutical
- 7.4.5. Military and Defense
- 7.4.6. Other End-user Verticals
- 7.1. Market Analysis, Insights and Forecast - by Technology
- 8. Asia Pacific GigE Camera Industry Analysis, Insights and Forecast, 2019-2031
- 8.1. Market Analysis, Insights and Forecast - by Technology
- 8.1.1. Charge Coupled Device (CCD)
- 8.1.2. Complementary Metal- Oxide - Semiconductor (CMOS)
- 8.2. Market Analysis, Insights and Forecast - by Type
- 8.2.1. Area Scan
- 8.2.2. Line Scan
- 8.3. Market Analysis, Insights and Forecast - by Colour Sensor Type
- 8.3.1. Monochrome
- 8.4. Market Analysis, Insights and Forecast - by End-user Vertical
- 8.4.1. Industrial
- 8.4.2. Medical / Life Sciences
- 8.4.3. Traffic, Security & Surveillance
- 8.4.4. Pharmaceutical
- 8.4.5. Military and Defense
- 8.4.6. Other End-user Verticals
- 8.1. Market Analysis, Insights and Forecast - by Technology
- 9. Latin America GigE Camera Industry Analysis, Insights and Forecast, 2019-2031
- 9.1. Market Analysis, Insights and Forecast - by Technology
- 9.1.1. Charge Coupled Device (CCD)
- 9.1.2. Complementary Metal- Oxide - Semiconductor (CMOS)
- 9.2. Market Analysis, Insights and Forecast - by Type
- 9.2.1. Area Scan
- 9.2.2. Line Scan
- 9.3. Market Analysis, Insights and Forecast - by Colour Sensor Type
- 9.3.1. Monochrome
- 9.4. Market Analysis, Insights and Forecast - by End-user Vertical
- 9.4.1. Industrial
- 9.4.2. Medical / Life Sciences
- 9.4.3. Traffic, Security & Surveillance
- 9.4.4. Pharmaceutical
- 9.4.5. Military and Defense
- 9.4.6. Other End-user Verticals
- 9.1. Market Analysis, Insights and Forecast - by Technology
- 10. Middle East GigE Camera Industry Analysis, Insights and Forecast, 2019-2031
- 10.1. Market Analysis, Insights and Forecast - by Technology
- 10.1.1. Charge Coupled Device (CCD)
- 10.1.2. Complementary Metal- Oxide - Semiconductor (CMOS)
- 10.2. Market Analysis, Insights and Forecast - by Type
- 10.2.1. Area Scan
- 10.2.2. Line Scan
- 10.3. Market Analysis, Insights and Forecast - by Colour Sensor Type
- 10.3.1. Monochrome
- 10.4. Market Analysis, Insights and Forecast - by End-user Vertical
- 10.4.1. Industrial
- 10.4.2. Medical / Life Sciences
- 10.4.3. Traffic, Security & Surveillance
- 10.4.4. Pharmaceutical
- 10.4.5. Military and Defense
- 10.4.6. Other End-user Verticals
- 10.1. Market Analysis, Insights and Forecast - by Technology
- 11. North America GigE Camera Industry Analysis, Insights and Forecast, 2019-2031
- 11.1. Market Analysis, Insights and Forecast - By Country/Sub-region
- 11.1.1 United States
- 11.1.2 Canada
- 11.1.3 Mexico
- 12. Europe GigE Camera Industry Analysis, Insights and Forecast, 2019-2031
- 12.1. Market Analysis, Insights and Forecast - By Country/Sub-region
- 12.1.1 Germany
- 12.1.2 United Kingdom
- 12.1.3 France
- 12.1.4 Spain
- 12.1.5 Italy
- 12.1.6 Spain
- 12.1.7 Belgium
- 12.1.8 Netherland
- 12.1.9 Nordics
- 12.1.10 Rest of Europe
- 13. Asia Pacific GigE Camera Industry Analysis, Insights and Forecast, 2019-2031
- 13.1. Market Analysis, Insights and Forecast - By Country/Sub-region
- 13.1.1 China
- 13.1.2 Japan
- 13.1.3 India
- 13.1.4 South Korea
- 13.1.5 Southeast Asia
- 13.1.6 Australia
- 13.1.7 Indonesia
- 13.1.8 Phillipes
- 13.1.9 Singapore
- 13.1.10 Thailandc
- 13.1.11 Rest of Asia Pacific
- 14. South America GigE Camera Industry Analysis, Insights and Forecast, 2019-2031
- 14.1. Market Analysis, Insights and Forecast - By Country/Sub-region
- 14.1.1 Brazil
- 14.1.2 Argentina
- 14.1.3 Peru
- 14.1.4 Chile
- 14.1.5 Colombia
- 14.1.6 Ecuador
- 14.1.7 Venezuela
- 14.1.8 Rest of South America
- 15. North America GigE Camera Industry Analysis, Insights and Forecast, 2019-2031
- 15.1. Market Analysis, Insights and Forecast - By Country/Sub-region
- 15.1.1 United States
- 15.1.2 Canada
- 15.1.3 Mexico
- 16. MEA GigE Camera Industry Analysis, Insights and Forecast, 2019-2031
- 16.1. Market Analysis, Insights and Forecast - By Country/Sub-region
- 16.1.1 United Arab Emirates
- 16.1.2 Saudi Arabia
- 16.1.3 South Africa
- 16.1.4 Rest of Middle East and Africa
- 17. Competitive Analysis
- 17.1. Global Market Share Analysis 2024
- 17.2. Company Profiles
- 17.2.1 Imperx Incorporated
- 17.2.1.1. Overview
- 17.2.1.2. Products
- 17.2.1.3. SWOT Analysis
- 17.2.1.4. Recent Developments
- 17.2.1.5. Financials (Based on Availability)
- 17.2.2 Teledyne DALSA Inc
- 17.2.2.1. Overview
- 17.2.2.2. Products
- 17.2.2.3. SWOT Analysis
- 17.2.2.4. Recent Developments
- 17.2.2.5. Financials (Based on Availability)
- 17.2.3 Matrox Graphics Inc
- 17.2.3.1. Overview
- 17.2.3.2. Products
- 17.2.3.3. SWOT Analysis
- 17.2.3.4. Recent Developments
- 17.2.3.5. Financials (Based on Availability)
- 17.2.4 Baumer Holding AG
- 17.2.4.1. Overview
- 17.2.4.2. Products
- 17.2.4.3. SWOT Analysis
- 17.2.4.4. Recent Developments
- 17.2.4.5. Financials (Based on Availability)
- 17.2.5 Allied Vision Technologies GmbH
- 17.2.5.1. Overview
- 17.2.5.2. Products
- 17.2.5.3. SWOT Analysis
- 17.2.5.4. Recent Developments
- 17.2.5.5. Financials (Based on Availability)
- 17.2.6 Pleora Technologies Inc
- 17.2.6.1. Overview
- 17.2.6.2. Products
- 17.2.6.3. SWOT Analysis
- 17.2.6.4. Recent Developments
- 17.2.6.5. Financials (Based on Availability)
- 17.2.7 FLIR Integrated Imaging Solutions Inc
- 17.2.7.1. Overview
- 17.2.7.2. Products
- 17.2.7.3. SWOT Analysis
- 17.2.7.4. Recent Developments
- 17.2.7.5. Financials (Based on Availability)
- 17.2.8 JAI A/S
- 17.2.8.1. Overview
- 17.2.8.2. Products
- 17.2.8.3. SWOT Analysis
- 17.2.8.4. Recent Developments
- 17.2.8.5. Financials (Based on Availability)
- 17.2.9 Sensor Technologies America Inc
- 17.2.9.1. Overview
- 17.2.9.2. Products
- 17.2.9.3. SWOT Analysis
- 17.2.9.4. Recent Developments
- 17.2.9.5. Financials (Based on Availability)
- 17.2.10 Basler AG
- 17.2.10.1. Overview
- 17.2.10.2. Products
- 17.2.10.3. SWOT Analysis
- 17.2.10.4. Recent Developments
- 17.2.10.5. Financials (Based on Availability)
- 17.2.11 Sony Corporation
- 17.2.11.1. Overview
- 17.2.11.2. Products
- 17.2.11.3. SWOT Analysis
- 17.2.11.4. Recent Developments
- 17.2.11.5. Financials (Based on Availability)
- 17.2.12 Toshiba Teli Corporation Ltd
- 17.2.12.1. Overview
- 17.2.12.2. Products
- 17.2.12.3. SWOT Analysis
- 17.2.12.4. Recent Developments
- 17.2.12.5. Financials (Based on Availability)
- 17.2.1 Imperx Incorporated
List of Figures
- Figure 1: Global GigE Camera Industry Revenue Breakdown (Million, %) by Region 2024 & 2032
- Figure 2: Global GigE Camera Industry Volume Breakdown (K Unit, %) by Region 2024 & 2032
- Figure 3: North America GigE Camera Industry Revenue (Million), by Country 2024 & 2032
- Figure 4: North America GigE Camera Industry Volume (K Unit), by Country 2024 & 2032
- Figure 5: North America GigE Camera Industry Revenue Share (%), by Country 2024 & 2032
- Figure 6: North America GigE Camera Industry Volume Share (%), by Country 2024 & 2032
- Figure 7: Europe GigE Camera Industry Revenue (Million), by Country 2024 & 2032
- Figure 8: Europe GigE Camera Industry Volume (K Unit), by Country 2024 & 2032
- Figure 9: Europe GigE Camera Industry Revenue Share (%), by Country 2024 & 2032
- Figure 10: Europe GigE Camera Industry Volume Share (%), by Country 2024 & 2032
- Figure 11: Asia Pacific GigE Camera Industry Revenue (Million), by Country 2024 & 2032
- Figure 12: Asia Pacific GigE Camera Industry Volume (K Unit), by Country 2024 & 2032
- Figure 13: Asia Pacific GigE Camera Industry Revenue Share (%), by Country 2024 & 2032
- Figure 14: Asia Pacific GigE Camera Industry Volume Share (%), by Country 2024 & 2032
- Figure 15: South America GigE Camera Industry Revenue (Million), by Country 2024 & 2032
- Figure 16: South America GigE Camera Industry Volume (K Unit), by Country 2024 & 2032
- Figure 17: South America GigE Camera Industry Revenue Share (%), by Country 2024 & 2032
- Figure 18: South America GigE Camera Industry Volume Share (%), by Country 2024 & 2032
- Figure 19: North America GigE Camera Industry Revenue (Million), by Country 2024 & 2032
- Figure 20: North America GigE Camera Industry Volume (K Unit), by Country 2024 & 2032
- Figure 21: North America GigE Camera Industry Revenue Share (%), by Country 2024 & 2032
- Figure 22: North America GigE Camera Industry Volume Share (%), by Country 2024 & 2032
- Figure 23: MEA GigE Camera Industry Revenue (Million), by Country 2024 & 2032
- Figure 24: MEA GigE Camera Industry Volume (K Unit), by Country 2024 & 2032
- Figure 25: MEA GigE Camera Industry Revenue Share (%), by Country 2024 & 2032
- Figure 26: MEA GigE Camera Industry Volume Share (%), by Country 2024 & 2032
- Figure 27: North America GigE Camera Industry Revenue (Million), by Technology 2024 & 2032
- Figure 28: North America GigE Camera Industry Volume (K Unit), by Technology 2024 & 2032
- Figure 29: North America GigE Camera Industry Revenue Share (%), by Technology 2024 & 2032
- Figure 30: North America GigE Camera Industry Volume Share (%), by Technology 2024 & 2032
- Figure 31: North America GigE Camera Industry Revenue (Million), by Type 2024 & 2032
- Figure 32: North America GigE Camera Industry Volume (K Unit), by Type 2024 & 2032
- Figure 33: North America GigE Camera Industry Revenue Share (%), by Type 2024 & 2032
- Figure 34: North America GigE Camera Industry Volume Share (%), by Type 2024 & 2032
- Figure 35: North America GigE Camera Industry Revenue (Million), by Colour Sensor Type 2024 & 2032
- Figure 36: North America GigE Camera Industry Volume (K Unit), by Colour Sensor Type 2024 & 2032
- Figure 37: North America GigE Camera Industry Revenue Share (%), by Colour Sensor Type 2024 & 2032
- Figure 38: North America GigE Camera Industry Volume Share (%), by Colour Sensor Type 2024 & 2032
- Figure 39: North America GigE Camera Industry Revenue (Million), by End-user Vertical 2024 & 2032
- Figure 40: North America GigE Camera Industry Volume (K Unit), by End-user Vertical 2024 & 2032
- Figure 41: North America GigE Camera Industry Revenue Share (%), by End-user Vertical 2024 & 2032
- Figure 42: North America GigE Camera Industry Volume Share (%), by End-user Vertical 2024 & 2032
- Figure 43: North America GigE Camera Industry Revenue (Million), by Country 2024 & 2032
- Figure 44: North America GigE Camera Industry Volume (K Unit), by Country 2024 & 2032
- Figure 45: North America GigE Camera Industry Revenue Share (%), by Country 2024 & 2032
- Figure 46: North America GigE Camera Industry Volume Share (%), by Country 2024 & 2032
- Figure 47: Europe GigE Camera Industry Revenue (Million), by Technology 2024 & 2032
- Figure 48: Europe GigE Camera Industry Volume (K Unit), by Technology 2024 & 2032
- Figure 49: Europe GigE Camera Industry Revenue Share (%), by Technology 2024 & 2032
- Figure 50: Europe GigE Camera Industry Volume Share (%), by Technology 2024 & 2032
- Figure 51: Europe GigE Camera Industry Revenue (Million), by Type 2024 & 2032
- Figure 52: Europe GigE Camera Industry Volume (K Unit), by Type 2024 & 2032
- Figure 53: Europe GigE Camera Industry Revenue Share (%), by Type 2024 & 2032
- Figure 54: Europe GigE Camera Industry Volume Share (%), by Type 2024 & 2032
- Figure 55: Europe GigE Camera Industry Revenue (Million), by Colour Sensor Type 2024 & 2032
- Figure 56: Europe GigE Camera Industry Volume (K Unit), by Colour Sensor Type 2024 & 2032
- Figure 57: Europe GigE Camera Industry Revenue Share (%), by Colour Sensor Type 2024 & 2032
- Figure 58: Europe GigE Camera Industry Volume Share (%), by Colour Sensor Type 2024 & 2032
- Figure 59: Europe GigE Camera Industry Revenue (Million), by End-user Vertical 2024 & 2032
- Figure 60: Europe GigE Camera Industry Volume (K Unit), by End-user Vertical 2024 & 2032
- Figure 61: Europe GigE Camera Industry Revenue Share (%), by End-user Vertical 2024 & 2032
- Figure 62: Europe GigE Camera Industry Volume Share (%), by End-user Vertical 2024 & 2032
- Figure 63: Europe GigE Camera Industry Revenue (Million), by Country 2024 & 2032
- Figure 64: Europe GigE Camera Industry Volume (K Unit), by Country 2024 & 2032
- Figure 65: Europe GigE Camera Industry Revenue Share (%), by Country 2024 & 2032
- Figure 66: Europe GigE Camera Industry Volume Share (%), by Country 2024 & 2032
- Figure 67: Asia Pacific GigE Camera Industry Revenue (Million), by Technology 2024 & 2032
- Figure 68: Asia Pacific GigE Camera Industry Volume (K Unit), by Technology 2024 & 2032
- Figure 69: Asia Pacific GigE Camera Industry Revenue Share (%), by Technology 2024 & 2032
- Figure 70: Asia Pacific GigE Camera Industry Volume Share (%), by Technology 2024 & 2032
- Figure 71: Asia Pacific GigE Camera Industry Revenue (Million), by Type 2024 & 2032
- Figure 72: Asia Pacific GigE Camera Industry Volume (K Unit), by Type 2024 & 2032
- Figure 73: Asia Pacific GigE Camera Industry Revenue Share (%), by Type 2024 & 2032
- Figure 74: Asia Pacific GigE Camera Industry Volume Share (%), by Type 2024 & 2032
- Figure 75: Asia Pacific GigE Camera Industry Revenue (Million), by Colour Sensor Type 2024 & 2032
- Figure 76: Asia Pacific GigE Camera Industry Volume (K Unit), by Colour Sensor Type 2024 & 2032
- Figure 77: Asia Pacific GigE Camera Industry Revenue Share (%), by Colour Sensor Type 2024 & 2032
- Figure 78: Asia Pacific GigE Camera Industry Volume Share (%), by Colour Sensor Type 2024 & 2032
- Figure 79: Asia Pacific GigE Camera Industry Revenue (Million), by End-user Vertical 2024 & 2032
- Figure 80: Asia Pacific GigE Camera Industry Volume (K Unit), by End-user Vertical 2024 & 2032
- Figure 81: Asia Pacific GigE Camera Industry Revenue Share (%), by End-user Vertical 2024 & 2032
- Figure 82: Asia Pacific GigE Camera Industry Volume Share (%), by End-user Vertical 2024 & 2032
- Figure 83: Asia Pacific GigE Camera Industry Revenue (Million), by Country 2024 & 2032
- Figure 84: Asia Pacific GigE Camera Industry Volume (K Unit), by Country 2024 & 2032
- Figure 85: Asia Pacific GigE Camera Industry Revenue Share (%), by Country 2024 & 2032
- Figure 86: Asia Pacific GigE Camera Industry Volume Share (%), by Country 2024 & 2032
- Figure 87: Latin America GigE Camera Industry Revenue (Million), by Technology 2024 & 2032
- Figure 88: Latin America GigE Camera Industry Volume (K Unit), by Technology 2024 & 2032
- Figure 89: Latin America GigE Camera Industry Revenue Share (%), by Technology 2024 & 2032
- Figure 90: Latin America GigE Camera Industry Volume Share (%), by Technology 2024 & 2032
- Figure 91: Latin America GigE Camera Industry Revenue (Million), by Type 2024 & 2032
- Figure 92: Latin America GigE Camera Industry Volume (K Unit), by Type 2024 & 2032
- Figure 93: Latin America GigE Camera Industry Revenue Share (%), by Type 2024 & 2032
- Figure 94: Latin America GigE Camera Industry Volume Share (%), by Type 2024 & 2032
- Figure 95: Latin America GigE Camera Industry Revenue (Million), by Colour Sensor Type 2024 & 2032
- Figure 96: Latin America GigE Camera Industry Volume (K Unit), by Colour Sensor Type 2024 & 2032
- Figure 97: Latin America GigE Camera Industry Revenue Share (%), by Colour Sensor Type 2024 & 2032
- Figure 98: Latin America GigE Camera Industry Volume Share (%), by Colour Sensor Type 2024 & 2032
- Figure 99: Latin America GigE Camera Industry Revenue (Million), by End-user Vertical 2024 & 2032
- Figure 100: Latin America GigE Camera Industry Volume (K Unit), by End-user Vertical 2024 & 2032
- Figure 101: Latin America GigE Camera Industry Revenue Share (%), by End-user Vertical 2024 & 2032
- Figure 102: Latin America GigE Camera Industry Volume Share (%), by End-user Vertical 2024 & 2032
- Figure 103: Latin America GigE Camera Industry Revenue (Million), by Country 2024 & 2032
- Figure 104: Latin America GigE Camera Industry Volume (K Unit), by Country 2024 & 2032
- Figure 105: Latin America GigE Camera Industry Revenue Share (%), by Country 2024 & 2032
- Figure 106: Latin America GigE Camera Industry Volume Share (%), by Country 2024 & 2032
- Figure 107: Middle East GigE Camera Industry Revenue (Million), by Technology 2024 & 2032
- Figure 108: Middle East GigE Camera Industry Volume (K Unit), by Technology 2024 & 2032
- Figure 109: Middle East GigE Camera Industry Revenue Share (%), by Technology 2024 & 2032
- Figure 110: Middle East GigE Camera Industry Volume Share (%), by Technology 2024 & 2032
- Figure 111: Middle East GigE Camera Industry Revenue (Million), by Type 2024 & 2032
- Figure 112: Middle East GigE Camera Industry Volume (K Unit), by Type 2024 & 2032
- Figure 113: Middle East GigE Camera Industry Revenue Share (%), by Type 2024 & 2032
- Figure 114: Middle East GigE Camera Industry Volume Share (%), by Type 2024 & 2032
- Figure 115: Middle East GigE Camera Industry Revenue (Million), by Colour Sensor Type 2024 & 2032
- Figure 116: Middle East GigE Camera Industry Volume (K Unit), by Colour Sensor Type 2024 & 2032
- Figure 117: Middle East GigE Camera Industry Revenue Share (%), by Colour Sensor Type 2024 & 2032
- Figure 118: Middle East GigE Camera Industry Volume Share (%), by Colour Sensor Type 2024 & 2032
- Figure 119: Middle East GigE Camera Industry Revenue (Million), by End-user Vertical 2024 & 2032
- Figure 120: Middle East GigE Camera Industry Volume (K Unit), by End-user Vertical 2024 & 2032
- Figure 121: Middle East GigE Camera Industry Revenue Share (%), by End-user Vertical 2024 & 2032
- Figure 122: Middle East GigE Camera Industry Volume Share (%), by End-user Vertical 2024 & 2032
- Figure 123: Middle East GigE Camera Industry Revenue (Million), by Country 2024 & 2032
- Figure 124: Middle East GigE Camera Industry Volume (K Unit), by Country 2024 & 2032
- Figure 125: Middle East GigE Camera Industry Revenue Share (%), by Country 2024 & 2032
- Figure 126: Middle East GigE Camera Industry Volume Share (%), by Country 2024 & 2032
List of Tables
- Table 1: Global GigE Camera Industry Revenue Million Forecast, by Region 2019 & 2032
- Table 2: Global GigE Camera Industry Volume K Unit Forecast, by Region 2019 & 2032
- Table 3: Global GigE Camera Industry Revenue Million Forecast, by Technology 2019 & 2032
- Table 4: Global GigE Camera Industry Volume K Unit Forecast, by Technology 2019 & 2032
- Table 5: Global GigE Camera Industry Revenue Million Forecast, by Type 2019 & 2032
- Table 6: Global GigE Camera Industry Volume K Unit Forecast, by Type 2019 & 2032
- Table 7: Global GigE Camera Industry Revenue Million Forecast, by Colour Sensor Type 2019 & 2032
- Table 8: Global GigE Camera Industry Volume K Unit Forecast, by Colour Sensor Type 2019 & 2032
- Table 9: Global GigE Camera Industry Revenue Million Forecast, by End-user Vertical 2019 & 2032
- Table 10: Global GigE Camera Industry Volume K Unit Forecast, by End-user Vertical 2019 & 2032
- Table 11: Global GigE Camera Industry Revenue Million Forecast, by Region 2019 & 2032
- Table 12: Global GigE Camera Industry Volume K Unit Forecast, by Region 2019 & 2032
- Table 13: Global GigE Camera Industry Revenue Million Forecast, by Country 2019 & 2032
- Table 14: Global GigE Camera Industry Volume K Unit Forecast, by Country 2019 & 2032
- Table 15: United States GigE Camera Industry Revenue (Million) Forecast, by Application 2019 & 2032
- Table 16: United States GigE Camera Industry Volume (K Unit) Forecast, by Application 2019 & 2032
- Table 17: Canada GigE Camera Industry Revenue (Million) Forecast, by Application 2019 & 2032
- Table 18: Canada GigE Camera Industry Volume (K Unit) Forecast, by Application 2019 & 2032
- Table 19: Mexico GigE Camera Industry Revenue (Million) Forecast, by Application 2019 & 2032
- Table 20: Mexico GigE Camera Industry Volume (K Unit) Forecast, by Application 2019 & 2032
- Table 21: Global GigE Camera Industry Revenue Million Forecast, by Country 2019 & 2032
- Table 22: Global GigE Camera Industry Volume K Unit Forecast, by Country 2019 & 2032
- Table 23: Germany GigE Camera Industry Revenue (Million) Forecast, by Application 2019 & 2032
- Table 24: Germany GigE Camera Industry Volume (K Unit) Forecast, by Application 2019 & 2032
- Table 25: United Kingdom GigE Camera Industry Revenue (Million) Forecast, by Application 2019 & 2032
- Table 26: United Kingdom GigE Camera Industry Volume (K Unit) Forecast, by Application 2019 & 2032
- Table 27: France GigE Camera Industry Revenue (Million) Forecast, by Application 2019 & 2032
- Table 28: France GigE Camera Industry Volume (K Unit) Forecast, by Application 2019 & 2032
- Table 29: Spain GigE Camera Industry Revenue (Million) Forecast, by Application 2019 & 2032
- Table 30: Spain GigE Camera Industry Volume (K Unit) Forecast, by Application 2019 & 2032
- Table 31: Italy GigE Camera Industry Revenue (Million) Forecast, by Application 2019 & 2032
- Table 32: Italy GigE Camera Industry Volume (K Unit) Forecast, by Application 2019 & 2032
- Table 33: Spain GigE Camera Industry Revenue (Million) Forecast, by Application 2019 & 2032
- Table 34: Spain GigE Camera Industry Volume (K Unit) Forecast, by Application 2019 & 2032
- Table 35: Belgium GigE Camera Industry Revenue (Million) Forecast, by Application 2019 & 2032
- Table 36: Belgium GigE Camera Industry Volume (K Unit) Forecast, by Application 2019 & 2032
- Table 37: Netherland GigE Camera Industry Revenue (Million) Forecast, by Application 2019 & 2032
- Table 38: Netherland GigE Camera Industry Volume (K Unit) Forecast, by Application 2019 & 2032
- Table 39: Nordics GigE Camera Industry Revenue (Million) Forecast, by Application 2019 & 2032
- Table 40: Nordics GigE Camera Industry Volume (K Unit) Forecast, by Application 2019 & 2032
- Table 41: Rest of Europe GigE Camera Industry Revenue (Million) Forecast, by Application 2019 & 2032
- Table 42: Rest of Europe GigE Camera Industry Volume (K Unit) Forecast, by Application 2019 & 2032
- Table 43: Global GigE Camera Industry Revenue Million Forecast, by Country 2019 & 2032
- Table 44: Global GigE Camera Industry Volume K Unit Forecast, by Country 2019 & 2032
- Table 45: China GigE Camera Industry Revenue (Million) Forecast, by Application 2019 & 2032
- Table 46: China GigE Camera Industry Volume (K Unit) Forecast, by Application 2019 & 2032
- Table 47: Japan GigE Camera Industry Revenue (Million) Forecast, by Application 2019 & 2032
- Table 48: Japan GigE Camera Industry Volume (K Unit) Forecast, by Application 2019 & 2032
- Table 49: India GigE Camera Industry Revenue (Million) Forecast, by Application 2019 & 2032
- Table 50: India GigE Camera Industry Volume (K Unit) Forecast, by Application 2019 & 2032
- Table 51: South Korea GigE Camera Industry Revenue (Million) Forecast, by Application 2019 & 2032
- Table 52: South Korea GigE Camera Industry Volume (K Unit) Forecast, by Application 2019 & 2032
- Table 53: Southeast Asia GigE Camera Industry Revenue (Million) Forecast, by Application 2019 & 2032
- Table 54: Southeast Asia GigE Camera Industry Volume (K Unit) Forecast, by Application 2019 & 2032
- Table 55: Australia GigE Camera Industry Revenue (Million) Forecast, by Application 2019 & 2032
- Table 56: Australia GigE Camera Industry Volume (K Unit) Forecast, by Application 2019 & 2032
- Table 57: Indonesia GigE Camera Industry Revenue (Million) Forecast, by Application 2019 & 2032
- Table 58: Indonesia GigE Camera Industry Volume (K Unit) Forecast, by Application 2019 & 2032
- Table 59: Phillipes GigE Camera Industry Revenue (Million) Forecast, by Application 2019 & 2032
- Table 60: Phillipes GigE Camera Industry Volume (K Unit) Forecast, by Application 2019 & 2032
- Table 61: Singapore GigE Camera Industry Revenue (Million) Forecast, by Application 2019 & 2032
- Table 62: Singapore GigE Camera Industry Volume (K Unit) Forecast, by Application 2019 & 2032
- Table 63: Thailandc GigE Camera Industry Revenue (Million) Forecast, by Application 2019 & 2032
- Table 64: Thailandc GigE Camera Industry Volume (K Unit) Forecast, by Application 2019 & 2032
- Table 65: Rest of Asia Pacific GigE Camera Industry Revenue (Million) Forecast, by Application 2019 & 2032
- Table 66: Rest of Asia Pacific GigE Camera Industry Volume (K Unit) Forecast, by Application 2019 & 2032
- Table 67: Global GigE Camera Industry Revenue Million Forecast, by Country 2019 & 2032
- Table 68: Global GigE Camera Industry Volume K Unit Forecast, by Country 2019 & 2032
- Table 69: Brazil GigE Camera Industry Revenue (Million) Forecast, by Application 2019 & 2032
- Table 70: Brazil GigE Camera Industry Volume (K Unit) Forecast, by Application 2019 & 2032
- Table 71: Argentina GigE Camera Industry Revenue (Million) Forecast, by Application 2019 & 2032
- Table 72: Argentina GigE Camera Industry Volume (K Unit) Forecast, by Application 2019 & 2032
- Table 73: Peru GigE Camera Industry Revenue (Million) Forecast, by Application 2019 & 2032
- Table 74: Peru GigE Camera Industry Volume (K Unit) Forecast, by Application 2019 & 2032
- Table 75: Chile GigE Camera Industry Revenue (Million) Forecast, by Application 2019 & 2032
- Table 76: Chile GigE Camera Industry Volume (K Unit) Forecast, by Application 2019 & 2032
- Table 77: Colombia GigE Camera Industry Revenue (Million) Forecast, by Application 2019 & 2032
- Table 78: Colombia GigE Camera Industry Volume (K Unit) Forecast, by Application 2019 & 2032
- Table 79: Ecuador GigE Camera Industry Revenue (Million) Forecast, by Application 2019 & 2032
- Table 80: Ecuador GigE Camera Industry Volume (K Unit) Forecast, by Application 2019 & 2032
- Table 81: Venezuela GigE Camera Industry Revenue (Million) Forecast, by Application 2019 & 2032
- Table 82: Venezuela GigE Camera Industry Volume (K Unit) Forecast, by Application 2019 & 2032
- Table 83: Rest of South America GigE Camera Industry Revenue (Million) Forecast, by Application 2019 & 2032
- Table 84: Rest of South America GigE Camera Industry Volume (K Unit) Forecast, by Application 2019 & 2032
- Table 85: Global GigE Camera Industry Revenue Million Forecast, by Country 2019 & 2032
- Table 86: Global GigE Camera Industry Volume K Unit Forecast, by Country 2019 & 2032
- Table 87: United States GigE Camera Industry Revenue (Million) Forecast, by Application 2019 & 2032
- Table 88: United States GigE Camera Industry Volume (K Unit) Forecast, by Application 2019 & 2032
- Table 89: Canada GigE Camera Industry Revenue (Million) Forecast, by Application 2019 & 2032
- Table 90: Canada GigE Camera Industry Volume (K Unit) Forecast, by Application 2019 & 2032
- Table 91: Mexico GigE Camera Industry Revenue (Million) Forecast, by Application 2019 & 2032
- Table 92: Mexico GigE Camera Industry Volume (K Unit) Forecast, by Application 2019 & 2032
- Table 93: Global GigE Camera Industry Revenue Million Forecast, by Country 2019 & 2032
- Table 94: Global GigE Camera Industry Volume K Unit Forecast, by Country 2019 & 2032
- Table 95: United Arab Emirates GigE Camera Industry Revenue (Million) Forecast, by Application 2019 & 2032
- Table 96: United Arab Emirates GigE Camera Industry Volume (K Unit) Forecast, by Application 2019 & 2032
- Table 97: Saudi Arabia GigE Camera Industry Revenue (Million) Forecast, by Application 2019 & 2032
- Table 98: Saudi Arabia GigE Camera Industry Volume (K Unit) Forecast, by Application 2019 & 2032
- Table 99: South Africa GigE Camera Industry Revenue (Million) Forecast, by Application 2019 & 2032
- Table 100: South Africa GigE Camera Industry Volume (K Unit) Forecast, by Application 2019 & 2032
- Table 101: Rest of Middle East and Africa GigE Camera Industry Revenue (Million) Forecast, by Application 2019 & 2032
- Table 102: Rest of Middle East and Africa GigE Camera Industry Volume (K Unit) Forecast, by Application 2019 & 2032
- Table 103: Global GigE Camera Industry Revenue Million Forecast, by Technology 2019 & 2032
- Table 104: Global GigE Camera Industry Volume K Unit Forecast, by Technology 2019 & 2032
- Table 105: Global GigE Camera Industry Revenue Million Forecast, by Type 2019 & 2032
- Table 106: Global GigE Camera Industry Volume K Unit Forecast, by Type 2019 & 2032
- Table 107: Global GigE Camera Industry Revenue Million Forecast, by Colour Sensor Type 2019 & 2032
- Table 108: Global GigE Camera Industry Volume K Unit Forecast, by Colour Sensor Type 2019 & 2032
- Table 109: Global GigE Camera Industry Revenue Million Forecast, by End-user Vertical 2019 & 2032
- Table 110: Global GigE Camera Industry Volume K Unit Forecast, by End-user Vertical 2019 & 2032
- Table 111: Global GigE Camera Industry Revenue Million Forecast, by Country 2019 & 2032
- Table 112: Global GigE Camera Industry Volume K Unit Forecast, by Country 2019 & 2032
- Table 113: Global GigE Camera Industry Revenue Million Forecast, by Technology 2019 & 2032
- Table 114: Global GigE Camera Industry Volume K Unit Forecast, by Technology 2019 & 2032
- Table 115: Global GigE Camera Industry Revenue Million Forecast, by Type 2019 & 2032
- Table 116: Global GigE Camera Industry Volume K Unit Forecast, by Type 2019 & 2032
- Table 117: Global GigE Camera Industry Revenue Million Forecast, by Colour Sensor Type 2019 & 2032
- Table 118: Global GigE Camera Industry Volume K Unit Forecast, by Colour Sensor Type 2019 & 2032
- Table 119: Global GigE Camera Industry Revenue Million Forecast, by End-user Vertical 2019 & 2032
- Table 120: Global GigE Camera Industry Volume K Unit Forecast, by End-user Vertical 2019 & 2032
- Table 121: Global GigE Camera Industry Revenue Million Forecast, by Country 2019 & 2032
- Table 122: Global GigE Camera Industry Volume K Unit Forecast, by Country 2019 & 2032
- Table 123: Global GigE Camera Industry Revenue Million Forecast, by Technology 2019 & 2032
- Table 124: Global GigE Camera Industry Volume K Unit Forecast, by Technology 2019 & 2032
- Table 125: Global GigE Camera Industry Revenue Million Forecast, by Type 2019 & 2032
- Table 126: Global GigE Camera Industry Volume K Unit Forecast, by Type 2019 & 2032
- Table 127: Global GigE Camera Industry Revenue Million Forecast, by Colour Sensor Type 2019 & 2032
- Table 128: Global GigE Camera Industry Volume K Unit Forecast, by Colour Sensor Type 2019 & 2032
- Table 129: Global GigE Camera Industry Revenue Million Forecast, by End-user Vertical 2019 & 2032
- Table 130: Global GigE Camera Industry Volume K Unit Forecast, by End-user Vertical 2019 & 2032
- Table 131: Global GigE Camera Industry Revenue Million Forecast, by Country 2019 & 2032
- Table 132: Global GigE Camera Industry Volume K Unit Forecast, by Country 2019 & 2032
- Table 133: Global GigE Camera Industry Revenue Million Forecast, by Technology 2019 & 2032
- Table 134: Global GigE Camera Industry Volume K Unit Forecast, by Technology 2019 & 2032
- Table 135: Global GigE Camera Industry Revenue Million Forecast, by Type 2019 & 2032
- Table 136: Global GigE Camera Industry Volume K Unit Forecast, by Type 2019 & 2032
- Table 137: Global GigE Camera Industry Revenue Million Forecast, by Colour Sensor Type 2019 & 2032
- Table 138: Global GigE Camera Industry Volume K Unit Forecast, by Colour Sensor Type 2019 & 2032
- Table 139: Global GigE Camera Industry Revenue Million Forecast, by End-user Vertical 2019 & 2032
- Table 140: Global GigE Camera Industry Volume K Unit Forecast, by End-user Vertical 2019 & 2032
- Table 141: Global GigE Camera Industry Revenue Million Forecast, by Country 2019 & 2032
- Table 142: Global GigE Camera Industry Volume K Unit Forecast, by Country 2019 & 2032
- Table 143: Global GigE Camera Industry Revenue Million Forecast, by Technology 2019 & 2032
- Table 144: Global GigE Camera Industry Volume K Unit Forecast, by Technology 2019 & 2032
- Table 145: Global GigE Camera Industry Revenue Million Forecast, by Type 2019 & 2032
- Table 146: Global GigE Camera Industry Volume K Unit Forecast, by Type 2019 & 2032
- Table 147: Global GigE Camera Industry Revenue Million Forecast, by Colour Sensor Type 2019 & 2032
- Table 148: Global GigE Camera Industry Volume K Unit Forecast, by Colour Sensor Type 2019 & 2032
- Table 149: Global GigE Camera Industry Revenue Million Forecast, by End-user Vertical 2019 & 2032
- Table 150: Global GigE Camera Industry Volume K Unit Forecast, by End-user Vertical 2019 & 2032
- Table 151: Global GigE Camera Industry Revenue Million Forecast, by Country 2019 & 2032
- Table 152: Global GigE Camera Industry Volume K Unit Forecast, by Country 2019 & 2032
Frequently Asked Questions
1. What is the projected Compound Annual Growth Rate (CAGR) of the GigE Camera Industry?
The projected CAGR is approximately 13.60%.
2. Which companies are prominent players in the GigE Camera Industry?
Key companies in the market include Imperx Incorporated, Teledyne DALSA Inc, Matrox Graphics Inc, Baumer Holding AG, Allied Vision Technologies GmbH, Pleora Technologies Inc, FLIR Integrated Imaging Solutions Inc, JAI A/S, Sensor Technologies America Inc , Basler AG, Sony Corporation, Toshiba Teli Corporation Ltd.
3. What are the main segments of the GigE Camera Industry?
The market segments include Technology, Type, Colour Sensor Type, End-user Vertical.
4. Can you provide details about the market size?
The market size is estimated to be USD XX Million as of 2022.
5. What are some drivers contributing to market growth?
; Efficient Data Transfer Coupled with Faster Transfer Rate; Ability to Connect with Numerous Devices.
6. What are the notable trends driving market growth?
Traffic. Security & Surveillance Segment to Grow Significantly.
7. Are there any restraints impacting market growth?
; Universal Drivers needed for Interoperability; Excessive Load on the CPU.
8. Can you provide examples of recent developments in the market?
N/A
9. What pricing options are available for accessing the report?
Pricing options include single-user, multi-user, and enterprise licenses priced at USD 4750, USD 5250, and USD 8750 respectively.
10. Is the market size provided in terms of value or volume?
The market size is provided in terms of value, measured in Million and volume, measured in K Unit.
11. Are there any specific market keywords associated with the report?
Yes, the market keyword associated with the report is "GigE Camera Industry," which aids in identifying and referencing the specific market segment covered.
12. How do I determine which pricing option suits my needs best?
The pricing options vary based on user requirements and access needs. Individual users may opt for single-user licenses, while businesses requiring broader access may choose multi-user or enterprise licenses for cost-effective access to the report.
13. Are there any additional resources or data provided in the GigE Camera Industry report?
While the report offers comprehensive insights, it's advisable to review the specific contents or supplementary materials provided to ascertain if additional resources or data are available.
14. How can I stay updated on further developments or reports in the GigE Camera Industry?
To stay informed about further developments, trends, and reports in the GigE Camera Industry, consider subscribing to industry newsletters, following relevant companies and organizations, or regularly checking reputable industry news sources and publications.
Methodology
Step 1 - Identification of Relevant Samples Size from Population Database


Step 2 - Approaches for Defining Global Market Size (Value, Volume* & Price*)

Note*: In applicable scenarios
Step 3 - Data Sources
Primary Research
- Web Analytics
- Survey Reports
- Research Institute
- Latest Research Reports
- Opinion Leaders
Secondary Research
- Annual Reports
- White Paper
- Latest Press Release
- Industry Association
- Paid Database
- Investor Presentations

Step 4 - Data Triangulation
Involves using different sources of information in order to increase the validity of a study
These sources are likely to be stakeholders in a program - participants, other researchers, program staff, other community members, and so on.
Then we put all data in single framework & apply various statistical tools to find out the dynamic on the market.
During the analysis stage, feedback from the stakeholder groups would be compared to determine areas of agreement as well as areas of divergence


