
Key Insights
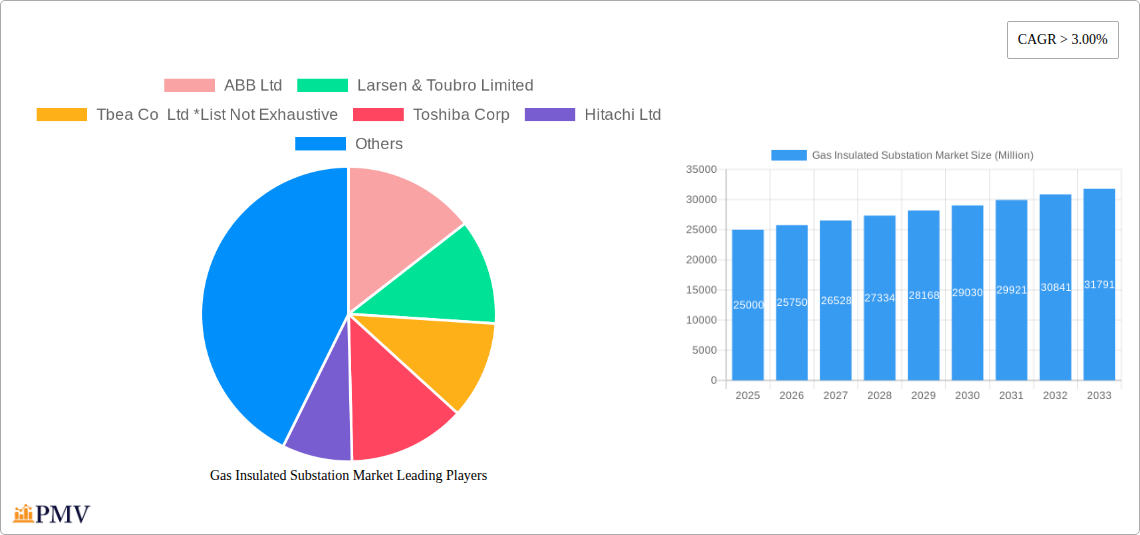
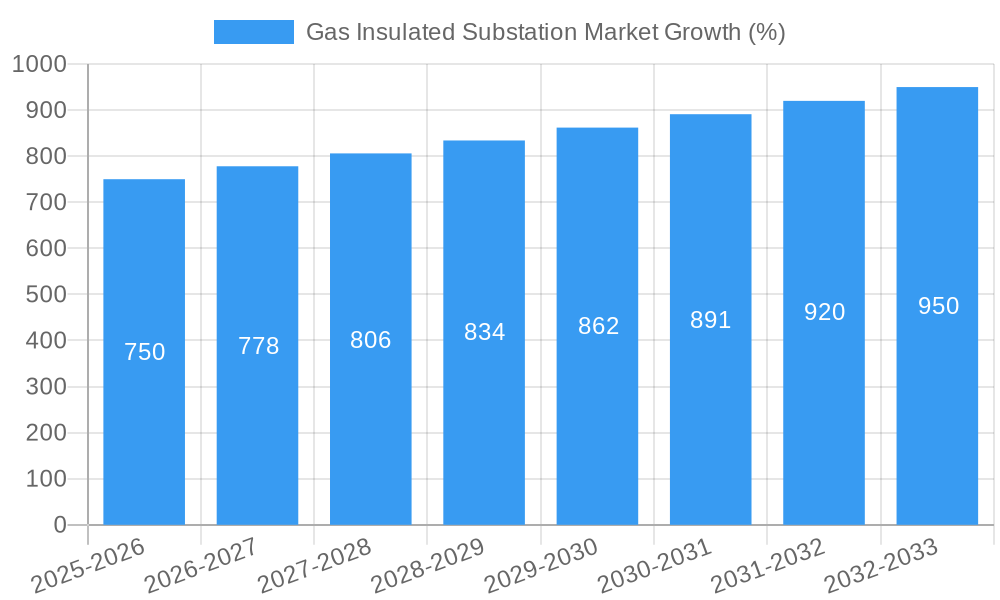
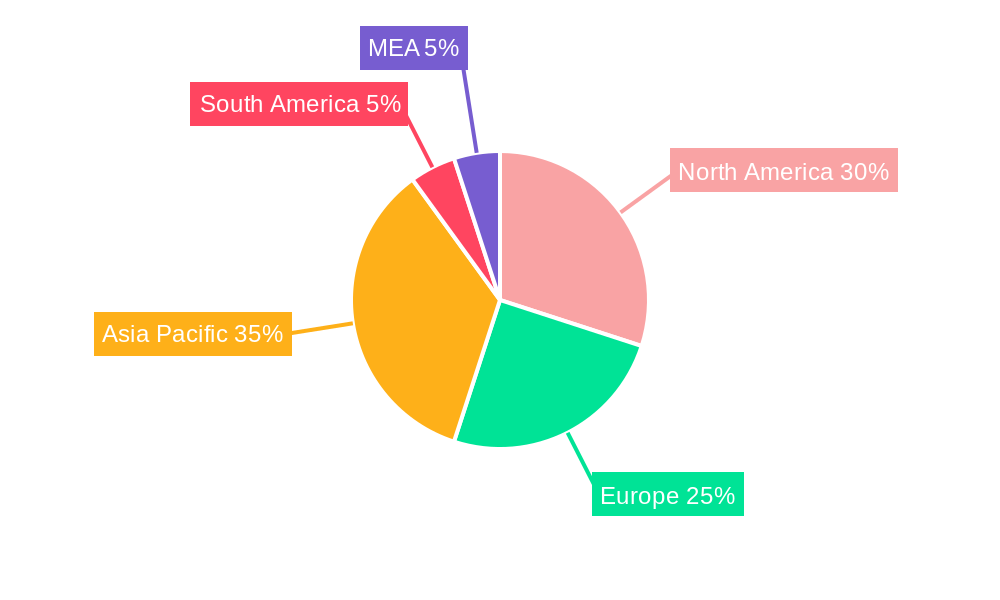
The Gas Insulated Substation (GIS) market is experiencing robust growth, driven by the increasing demand for reliable and efficient power transmission and distribution infrastructure globally. The market's Compound Annual Growth Rate (CAGR) exceeding 3.00% indicates a steady expansion, projected to continue through 2033. Key drivers include the rising adoption of renewable energy sources, necessitating advanced substation technologies to manage intermittent power generation. Furthermore, growing urbanization and industrialization contribute to higher electricity demand, pushing the need for compact and reliable GIS solutions capable of handling high voltage and large power capacities. Stringent environmental regulations regarding land use and minimizing environmental impact also favor the compact footprint of GIS over traditional air-insulated substations. Market segmentation reveals a strong presence across all voltage levels (medium, high, and extra-high voltage), with power utilities representing a significant end-user segment. The geographical distribution of the market is diversified, with North America, Europe, and Asia Pacific being major contributors. Competitive dynamics are intense, with established players like ABB, Siemens, and GE competing alongside regional players. However, challenges remain, such as high initial investment costs associated with GIS technology, which might hinder adoption in certain regions or smaller projects. Nevertheless, the long-term benefits in terms of reliability, reduced maintenance, and space efficiency are expected to outweigh these initial costs, further bolstering market growth.
The competitive landscape is characterized by a blend of established multinational corporations and regional players. While large corporations benefit from global reach and technological prowess, smaller companies offer niche solutions or regional expertise. This dynamic landscape fosters innovation and competition, pushing technological advancements and driving cost optimization. Future market trends include increasing integration of smart grid technologies within GIS, enhancing grid monitoring and control capabilities. The growing adoption of digital twins and advanced analytics will play a crucial role in predictive maintenance and optimization of GIS operations. Technological advancements towards higher voltage ratings and improved compactness are also shaping the market's future. The development of environmentally friendly insulating gases to mitigate the environmental footprint of SF6, a commonly used gas, will play a crucial role in future growth. Continued investment in research and development, coupled with growing demand for improved grid resilience and efficiency, are expected to fuel the sustained expansion of the GIS market in the coming years.
Gas Insulated Substation Market: A Comprehensive Report (2019-2033)
This detailed report provides a comprehensive analysis of the Gas Insulated Substation (GIS) market, offering invaluable insights for industry stakeholders, investors, and researchers. With a study period spanning 2019-2033, a base year of 2025, and a forecast period of 2025-2033, this report meticulously examines market dynamics, competitive landscapes, and future growth prospects. The market is projected to reach xx Million by 2033, exhibiting a CAGR of xx% during the forecast period.
Gas Insulated Substation Market Market Structure & Competitive Dynamics
The Gas Insulated Substation market exhibits a moderately concentrated structure, with key players like ABB Ltd, ABB Ltd, Larsen & Toubro Limited, Larsen & Toubro Limited, Tbea Co Ltd, Toshiba Corp, Hitachi Ltd, Bharat Heavy Electricals Limited, Mitsubishi Electric Corporation, Siemens AG, Siemens AG, Schneider Electric SE, Schneider Electric SE, Powell Industries Inc, Elsewedy Electric Co S A E, CG Power and Industrial Solutions Ltd, General Electric Company, General Electric Company, and Hyosung Corp holding significant market shares. The market is characterized by intense competition driven by technological innovation, product differentiation, and strategic acquisitions.
The innovation ecosystem is vibrant, with continuous R&D efforts focused on enhancing efficiency, reliability, and compact design of GIS systems. Stringent regulatory frameworks related to safety and environmental compliance influence market dynamics. While there are limited direct substitutes, alternative technologies like air-insulated substations continue to compete, albeit with limitations in space and efficiency. End-user trends toward smart grids and renewable energy integration significantly impact GIS market growth.
M&A activities have been relatively frequent, with deal values averaging xx Million in recent years. These transactions often involve smaller companies being acquired by larger players to expand their product portfolio or geographical reach. Market share is predominantly held by established multinational corporations, although regional players are increasingly gaining traction.
- Market Concentration: Moderately Concentrated
- M&A Deal Value (Average): xx Million
- Key Innovation Areas: Compact design, enhanced efficiency, digitalization
Gas Insulated Substation Market Industry Trends & Insights
The Gas Insulated Substation market is experiencing robust growth driven by several key factors. The increasing demand for reliable and efficient power transmission and distribution infrastructure, particularly in rapidly developing economies, is a significant growth catalyst. The global shift towards renewable energy sources, such as solar and wind power, is also fueling demand for GIS due to their suitability for integration with these decentralized generation systems. Furthermore, the growing adoption of smart grid technologies necessitates advanced substation solutions, further driving market growth. Technological advancements, such as the development of SF6 alternatives and digitalization of GIS, contribute to market expansion.
Consumer preferences are increasingly shifting towards sustainable and environmentally friendly solutions. This has prompted manufacturers to focus on developing eco-friendly GIS designs that reduce environmental impact. Competitive dynamics involve aggressive pricing strategies, product differentiation, and strategic partnerships. Market penetration of GIS in various end-use sectors continues to rise, driven by the advantages of GIS over conventional substations. The market is expected to maintain a steady growth trajectory, with a projected CAGR of xx% during the forecast period (2025-2033).
Dominant Markets & Segments in Gas Insulated Substation Market
The High Voltage segment dominates the Gas Insulated Substation market, driven by the increasing demand for high-capacity power transmission and distribution systems. Within end-users, Power Utilities represent the largest segment, accounting for a significant share of market demand due to their extensive infrastructure investments. Geographically, Asia-Pacific is the leading region, primarily due to substantial investments in infrastructure development and the expansion of power grids.
Key Drivers for High Voltage Segment Dominance:
- Growing Demand for High-Capacity Power Transmission: Expansion of power grids and long-distance power transmission necessitates high voltage GIS.
- Technological Advancements: Continuous advancements in high-voltage technologies have enhanced efficiency and reliability.
- Government Initiatives: Policies promoting grid modernization and infrastructure development boost demand.
Key Drivers for Power Utilities Segment Dominance:
- Extensive Infrastructure Investments: Power utilities are the primary investors in power grid infrastructure.
- Growing Electrification: Increasing urbanization and industrialization drive the need for improved power infrastructure.
- Smart Grid Initiatives: Power utilities are adopting smart grid technologies, driving demand for advanced GIS solutions.
Key Drivers for Asia-Pacific Regional Dominance:
- Rapid Economic Growth: High economic growth fuels demand for power infrastructure.
- Infrastructure Development: Massive investments in power grid expansion drive GIS adoption.
- Government Support: Government initiatives promoting renewable energy integration bolster GIS demand.
Gas Insulated Substation Market Product Innovations
Recent years have witnessed significant advancements in GIS technology, focusing on improving efficiency, reliability, and environmental sustainability. The development of SF6 alternatives, such as air, vacuum, and various gaseous dielectrics, addresses environmental concerns associated with SF6. Digitalization of GIS through integration with smart grid technologies is gaining traction, enhancing monitoring, control, and diagnostics capabilities. This innovative focus on sustainability and digital capabilities provides substantial competitive advantages to manufacturers, resulting in more efficient, safer, and environmentally responsible GIS solutions.
Report Segmentation & Scope
This report segments the Gas Insulated Substation market based on voltage and end-user.
Voltage:
Medium Voltage: This segment covers GIS solutions for medium voltage applications, typically ranging from 1 kV to 35 kV. Market growth is driven by the expansion of distribution networks and increasing urbanization. Competition is moderate, with various players offering specialized solutions. The market size is estimated to be xx Million in 2025, and is expected to reach xx Million by 2033.
High Voltage: This is the largest segment, encompassing GIS for high-voltage applications (36 kV to 230 kV). Driven by long-distance power transmission needs and grid modernization, it's characterized by intense competition among major players. The market size is estimated to be xx Million in 2025, and is expected to reach xx Million by 2033.
Extra High Voltage: This segment caters to extra high voltage applications (above 230 kV). The growth is relatively slower than other segments, but driven by the need for efficient long-distance electricity transmission and integration of renewable energy sources. The market size is estimated to be xx Million in 2025, and is expected to reach xx Million by 2033.
End-User:
Power Utilities: This sector represents the dominant end-user segment, driving major demand for GIS due to extensive infrastructure development and expansion of power grids.
Industrial Sector: Industries with high power demands, like manufacturing and process industries, require robust and reliable power solutions, contributing significantly to market growth.
Commercial and Residential Sector: This segment's growth is moderate, driven by the increasing adoption of renewable energy sources and smart grid technologies in commercial and residential buildings.
Key Drivers of Gas Insulated Substation Market Growth
Several factors drive the growth of the Gas Insulated Substation market. The increasing demand for reliable power transmission infrastructure is a primary driver, coupled with the global push towards renewable energy integration, demanding efficient and compact substation solutions. Technological advancements, especially the development of SF6 alternatives and digitalization, further propel market expansion. Government regulations promoting grid modernization and the adoption of smart grid technologies also play a key role. Lastly, economic growth in emerging economies fuels investment in power infrastructure, fostering robust market growth.
Challenges in the Gas Insulated Substation Market Sector
The Gas Insulated Substation market faces certain challenges. The high initial investment cost of GIS can be a barrier to adoption, particularly for smaller utilities. Supply chain disruptions and the availability of raw materials can impact production and pricing. Furthermore, intense competition among established players necessitates continuous innovation and cost optimization strategies. Regulatory hurdles related to environmental regulations and safety standards can also pose challenges to market expansion. These factors can collectively impact the overall market growth.
Leading Players in the Gas Insulated Substation Market Market
- ABB Ltd
- Larsen & Toubro Limited
- Tbea Co Ltd
- Toshiba Corp
- Hitachi Ltd
- Bharat Heavy Electricals Limited
- Mitsubishi Electric Corporation
- Siemens AG
- Schneider Electric SE
- Powell Industries Inc
- Elsewedy Electric Co S A E
- CG Power and Industrial Solutions Ltd
- General Electric Company
- Hyosung Corp
Key Developments in Gas Insulated Substation Market Sector
- 2022 Q3: ABB launched a new range of compact GIS solutions with enhanced digital capabilities.
- 2023 Q1: Siemens announced a strategic partnership with a renewable energy company to integrate GIS solutions in wind farms.
- 2024 Q2: Larsen & Toubro completed a major GIS installation project for a power utility in India.
Strategic Gas Insulated Substation Market Market Outlook
The Gas Insulated Substation market presents significant future potential, driven by ongoing investments in grid modernization, the expansion of renewable energy infrastructure, and increasing urbanization. Strategic opportunities lie in developing eco-friendly GIS solutions that mitigate environmental impact and in leveraging digital technologies to enhance grid intelligence and operational efficiency. Focus on research and development, particularly in SF6 alternatives and advanced control systems, will be crucial for sustained growth and market leadership. The market is poised for continuous expansion driven by a global need for robust and sustainable power systems.
Gas Insulated Substation Market Segmentation
-
1. Voltage
- 1.1. Medium Voltage
- 1.2. High Voltage
- 1.3. Extra High Voltage
-
2. End-User
- 2.1. Power Utilities
- 2.2. Industrial Sector
- 2.3. Commercial and Residential Sector
Gas Insulated Substation Market Segmentation By Geography
- 1. North America
- 2. Europe
- 3. Asia Pacific
- 4. South America
- 5. Middle East and Africa
Gas Insulated Substation Market REPORT HIGHLIGHTS
| Aspects | Details |
|---|---|
| Study Period | 2019-2033 |
| Base Year | 2024 |
| Estimated Year | 2025 |
| Forecast Period | 2025-2033 |
| Historical Period | 2019-2024 |
| Growth Rate | CAGR of > 3.00% from 2019-2033 |
| Segmentation |
|
Table of Contents
- 1. Introduction
- 1.1. Research Scope
- 1.2. Market Segmentation
- 1.3. Research Methodology
- 1.4. Definitions and Assumptions
- 2. Executive Summary
- 2.1. Introduction
- 3. Market Dynamics
- 3.1. Introduction
- 3.2. Market Drivers
- 3.2.1. Supportive Government Policies and Incentives4.; Environmental Concerns
- 3.3. Market Restrains
- 3.3.1. Fossil Fuel Subsidies
- 3.4. Market Trends
- 3.4.1. Power Utilities Sector to Dominate the Market
- 4. Market Factor Analysis
- 4.1. Porters Five Forces
- 4.2. Supply/Value Chain
- 4.3. PESTEL analysis
- 4.4. Market Entropy
- 4.5. Patent/Trademark Analysis
- 5. Global Gas Insulated Substation Market Analysis, Insights and Forecast, 2019-2031
- 5.1. Market Analysis, Insights and Forecast - by Voltage
- 5.1.1. Medium Voltage
- 5.1.2. High Voltage
- 5.1.3. Extra High Voltage
- 5.2. Market Analysis, Insights and Forecast - by End-User
- 5.2.1. Power Utilities
- 5.2.2. Industrial Sector
- 5.2.3. Commercial and Residential Sector
- 5.3. Market Analysis, Insights and Forecast - by Region
- 5.3.1. North America
- 5.3.2. Europe
- 5.3.3. Asia Pacific
- 5.3.4. South America
- 5.3.5. Middle East and Africa
- 5.1. Market Analysis, Insights and Forecast - by Voltage
- 6. North America Gas Insulated Substation Market Analysis, Insights and Forecast, 2019-2031
- 6.1. Market Analysis, Insights and Forecast - by Voltage
- 6.1.1. Medium Voltage
- 6.1.2. High Voltage
- 6.1.3. Extra High Voltage
- 6.2. Market Analysis, Insights and Forecast - by End-User
- 6.2.1. Power Utilities
- 6.2.2. Industrial Sector
- 6.2.3. Commercial and Residential Sector
- 6.1. Market Analysis, Insights and Forecast - by Voltage
- 7. Europe Gas Insulated Substation Market Analysis, Insights and Forecast, 2019-2031
- 7.1. Market Analysis, Insights and Forecast - by Voltage
- 7.1.1. Medium Voltage
- 7.1.2. High Voltage
- 7.1.3. Extra High Voltage
- 7.2. Market Analysis, Insights and Forecast - by End-User
- 7.2.1. Power Utilities
- 7.2.2. Industrial Sector
- 7.2.3. Commercial and Residential Sector
- 7.1. Market Analysis, Insights and Forecast - by Voltage
- 8. Asia Pacific Gas Insulated Substation Market Analysis, Insights and Forecast, 2019-2031
- 8.1. Market Analysis, Insights and Forecast - by Voltage
- 8.1.1. Medium Voltage
- 8.1.2. High Voltage
- 8.1.3. Extra High Voltage
- 8.2. Market Analysis, Insights and Forecast - by End-User
- 8.2.1. Power Utilities
- 8.2.2. Industrial Sector
- 8.2.3. Commercial and Residential Sector
- 8.1. Market Analysis, Insights and Forecast - by Voltage
- 9. South America Gas Insulated Substation Market Analysis, Insights and Forecast, 2019-2031
- 9.1. Market Analysis, Insights and Forecast - by Voltage
- 9.1.1. Medium Voltage
- 9.1.2. High Voltage
- 9.1.3. Extra High Voltage
- 9.2. Market Analysis, Insights and Forecast - by End-User
- 9.2.1. Power Utilities
- 9.2.2. Industrial Sector
- 9.2.3. Commercial and Residential Sector
- 9.1. Market Analysis, Insights and Forecast - by Voltage
- 10. Middle East and Africa Gas Insulated Substation Market Analysis, Insights and Forecast, 2019-2031
- 10.1. Market Analysis, Insights and Forecast - by Voltage
- 10.1.1. Medium Voltage
- 10.1.2. High Voltage
- 10.1.3. Extra High Voltage
- 10.2. Market Analysis, Insights and Forecast - by End-User
- 10.2.1. Power Utilities
- 10.2.2. Industrial Sector
- 10.2.3. Commercial and Residential Sector
- 10.1. Market Analysis, Insights and Forecast - by Voltage
- 11. North America Gas Insulated Substation Market Analysis, Insights and Forecast, 2019-2031
- 11.1. Market Analysis, Insights and Forecast - By Country/Sub-region
- 11.1.1 United States
- 11.1.2 Canada
- 11.1.3 Mexico
- 12. Europe Gas Insulated Substation Market Analysis, Insights and Forecast, 2019-2031
- 12.1. Market Analysis, Insights and Forecast - By Country/Sub-region
- 12.1.1 Germany
- 12.1.2 United Kingdom
- 12.1.3 France
- 12.1.4 Spain
- 12.1.5 Italy
- 12.1.6 Spain
- 12.1.7 Belgium
- 12.1.8 Netherland
- 12.1.9 Nordics
- 12.1.10 Rest of Europe
- 13. Asia Pacific Gas Insulated Substation Market Analysis, Insights and Forecast, 2019-2031
- 13.1. Market Analysis, Insights and Forecast - By Country/Sub-region
- 13.1.1 China
- 13.1.2 Japan
- 13.1.3 India
- 13.1.4 South Korea
- 13.1.5 Southeast Asia
- 13.1.6 Australia
- 13.1.7 Indonesia
- 13.1.8 Phillipes
- 13.1.9 Singapore
- 13.1.10 Thailandc
- 13.1.11 Rest of Asia Pacific
- 14. South America Gas Insulated Substation Market Analysis, Insights and Forecast, 2019-2031
- 14.1. Market Analysis, Insights and Forecast - By Country/Sub-region
- 14.1.1 Brazil
- 14.1.2 Argentina
- 14.1.3 Peru
- 14.1.4 Chile
- 14.1.5 Colombia
- 14.1.6 Ecuador
- 14.1.7 Venezuela
- 14.1.8 Rest of South America
- 15. MEA Gas Insulated Substation Market Analysis, Insights and Forecast, 2019-2031
- 15.1. Market Analysis, Insights and Forecast - By Country/Sub-region
- 15.1.1 United Arab Emirates
- 15.1.2 Saudi Arabia
- 15.1.3 South Africa
- 15.1.4 Rest of Middle East and Africa
- 16. Competitive Analysis
- 16.1. Global Market Share Analysis 2024
- 16.2. Company Profiles
- 16.2.1 ABB Ltd
- 16.2.1.1. Overview
- 16.2.1.2. Products
- 16.2.1.3. SWOT Analysis
- 16.2.1.4. Recent Developments
- 16.2.1.5. Financials (Based on Availability)
- 16.2.2 Larsen & Toubro Limited
- 16.2.2.1. Overview
- 16.2.2.2. Products
- 16.2.2.3. SWOT Analysis
- 16.2.2.4. Recent Developments
- 16.2.2.5. Financials (Based on Availability)
- 16.2.3 Tbea Co Ltd *List Not Exhaustive
- 16.2.3.1. Overview
- 16.2.3.2. Products
- 16.2.3.3. SWOT Analysis
- 16.2.3.4. Recent Developments
- 16.2.3.5. Financials (Based on Availability)
- 16.2.4 Toshiba Corp
- 16.2.4.1. Overview
- 16.2.4.2. Products
- 16.2.4.3. SWOT Analysis
- 16.2.4.4. Recent Developments
- 16.2.4.5. Financials (Based on Availability)
- 16.2.5 Hitachi Ltd
- 16.2.5.1. Overview
- 16.2.5.2. Products
- 16.2.5.3. SWOT Analysis
- 16.2.5.4. Recent Developments
- 16.2.5.5. Financials (Based on Availability)
- 16.2.6 Bharat Heavy Electricals Limited
- 16.2.6.1. Overview
- 16.2.6.2. Products
- 16.2.6.3. SWOT Analysis
- 16.2.6.4. Recent Developments
- 16.2.6.5. Financials (Based on Availability)
- 16.2.7 Mitsubishi Electric Corporation
- 16.2.7.1. Overview
- 16.2.7.2. Products
- 16.2.7.3. SWOT Analysis
- 16.2.7.4. Recent Developments
- 16.2.7.5. Financials (Based on Availability)
- 16.2.8 Siemens AG
- 16.2.8.1. Overview
- 16.2.8.2. Products
- 16.2.8.3. SWOT Analysis
- 16.2.8.4. Recent Developments
- 16.2.8.5. Financials (Based on Availability)
- 16.2.9 Schneider Electric SE
- 16.2.9.1. Overview
- 16.2.9.2. Products
- 16.2.9.3. SWOT Analysis
- 16.2.9.4. Recent Developments
- 16.2.9.5. Financials (Based on Availability)
- 16.2.10 Powell Industries Inc
- 16.2.10.1. Overview
- 16.2.10.2. Products
- 16.2.10.3. SWOT Analysis
- 16.2.10.4. Recent Developments
- 16.2.10.5. Financials (Based on Availability)
- 16.2.11 Elsewedy Electric Co S A E
- 16.2.11.1. Overview
- 16.2.11.2. Products
- 16.2.11.3. SWOT Analysis
- 16.2.11.4. Recent Developments
- 16.2.11.5. Financials (Based on Availability)
- 16.2.12 CG Power and Industrial Solutions Ltd
- 16.2.12.1. Overview
- 16.2.12.2. Products
- 16.2.12.3. SWOT Analysis
- 16.2.12.4. Recent Developments
- 16.2.12.5. Financials (Based on Availability)
- 16.2.13 General Electric Company
- 16.2.13.1. Overview
- 16.2.13.2. Products
- 16.2.13.3. SWOT Analysis
- 16.2.13.4. Recent Developments
- 16.2.13.5. Financials (Based on Availability)
- 16.2.14 Hyosung Corp
- 16.2.14.1. Overview
- 16.2.14.2. Products
- 16.2.14.3. SWOT Analysis
- 16.2.14.4. Recent Developments
- 16.2.14.5. Financials (Based on Availability)
- 16.2.1 ABB Ltd
List of Figures
- Figure 1: Global Gas Insulated Substation Market Revenue Breakdown (Million, %) by Region 2024 & 2032
- Figure 2: North America Gas Insulated Substation Market Revenue (Million), by Country 2024 & 2032
- Figure 3: North America Gas Insulated Substation Market Revenue Share (%), by Country 2024 & 2032
- Figure 4: Europe Gas Insulated Substation Market Revenue (Million), by Country 2024 & 2032
- Figure 5: Europe Gas Insulated Substation Market Revenue Share (%), by Country 2024 & 2032
- Figure 6: Asia Pacific Gas Insulated Substation Market Revenue (Million), by Country 2024 & 2032
- Figure 7: Asia Pacific Gas Insulated Substation Market Revenue Share (%), by Country 2024 & 2032
- Figure 8: South America Gas Insulated Substation Market Revenue (Million), by Country 2024 & 2032
- Figure 9: South America Gas Insulated Substation Market Revenue Share (%), by Country 2024 & 2032
- Figure 10: MEA Gas Insulated Substation Market Revenue (Million), by Country 2024 & 2032
- Figure 11: MEA Gas Insulated Substation Market Revenue Share (%), by Country 2024 & 2032
- Figure 12: North America Gas Insulated Substation Market Revenue (Million), by Voltage 2024 & 2032
- Figure 13: North America Gas Insulated Substation Market Revenue Share (%), by Voltage 2024 & 2032
- Figure 14: North America Gas Insulated Substation Market Revenue (Million), by End-User 2024 & 2032
- Figure 15: North America Gas Insulated Substation Market Revenue Share (%), by End-User 2024 & 2032
- Figure 16: North America Gas Insulated Substation Market Revenue (Million), by Country 2024 & 2032
- Figure 17: North America Gas Insulated Substation Market Revenue Share (%), by Country 2024 & 2032
- Figure 18: Europe Gas Insulated Substation Market Revenue (Million), by Voltage 2024 & 2032
- Figure 19: Europe Gas Insulated Substation Market Revenue Share (%), by Voltage 2024 & 2032
- Figure 20: Europe Gas Insulated Substation Market Revenue (Million), by End-User 2024 & 2032
- Figure 21: Europe Gas Insulated Substation Market Revenue Share (%), by End-User 2024 & 2032
- Figure 22: Europe Gas Insulated Substation Market Revenue (Million), by Country 2024 & 2032
- Figure 23: Europe Gas Insulated Substation Market Revenue Share (%), by Country 2024 & 2032
- Figure 24: Asia Pacific Gas Insulated Substation Market Revenue (Million), by Voltage 2024 & 2032
- Figure 25: Asia Pacific Gas Insulated Substation Market Revenue Share (%), by Voltage 2024 & 2032
- Figure 26: Asia Pacific Gas Insulated Substation Market Revenue (Million), by End-User 2024 & 2032
- Figure 27: Asia Pacific Gas Insulated Substation Market Revenue Share (%), by End-User 2024 & 2032
- Figure 28: Asia Pacific Gas Insulated Substation Market Revenue (Million), by Country 2024 & 2032
- Figure 29: Asia Pacific Gas Insulated Substation Market Revenue Share (%), by Country 2024 & 2032
- Figure 30: South America Gas Insulated Substation Market Revenue (Million), by Voltage 2024 & 2032
- Figure 31: South America Gas Insulated Substation Market Revenue Share (%), by Voltage 2024 & 2032
- Figure 32: South America Gas Insulated Substation Market Revenue (Million), by End-User 2024 & 2032
- Figure 33: South America Gas Insulated Substation Market Revenue Share (%), by End-User 2024 & 2032
- Figure 34: South America Gas Insulated Substation Market Revenue (Million), by Country 2024 & 2032
- Figure 35: South America Gas Insulated Substation Market Revenue Share (%), by Country 2024 & 2032
- Figure 36: Middle East and Africa Gas Insulated Substation Market Revenue (Million), by Voltage 2024 & 2032
- Figure 37: Middle East and Africa Gas Insulated Substation Market Revenue Share (%), by Voltage 2024 & 2032
- Figure 38: Middle East and Africa Gas Insulated Substation Market Revenue (Million), by End-User 2024 & 2032
- Figure 39: Middle East and Africa Gas Insulated Substation Market Revenue Share (%), by End-User 2024 & 2032
- Figure 40: Middle East and Africa Gas Insulated Substation Market Revenue (Million), by Country 2024 & 2032
- Figure 41: Middle East and Africa Gas Insulated Substation Market Revenue Share (%), by Country 2024 & 2032
List of Tables
- Table 1: Global Gas Insulated Substation Market Revenue Million Forecast, by Region 2019 & 2032
- Table 2: Global Gas Insulated Substation Market Revenue Million Forecast, by Voltage 2019 & 2032
- Table 3: Global Gas Insulated Substation Market Revenue Million Forecast, by End-User 2019 & 2032
- Table 4: Global Gas Insulated Substation Market Revenue Million Forecast, by Region 2019 & 2032
- Table 5: Global Gas Insulated Substation Market Revenue Million Forecast, by Country 2019 & 2032
- Table 6: United States Gas Insulated Substation Market Revenue (Million) Forecast, by Application 2019 & 2032
- Table 7: Canada Gas Insulated Substation Market Revenue (Million) Forecast, by Application 2019 & 2032
- Table 8: Mexico Gas Insulated Substation Market Revenue (Million) Forecast, by Application 2019 & 2032
- Table 9: Global Gas Insulated Substation Market Revenue Million Forecast, by Country 2019 & 2032
- Table 10: Germany Gas Insulated Substation Market Revenue (Million) Forecast, by Application 2019 & 2032
- Table 11: United Kingdom Gas Insulated Substation Market Revenue (Million) Forecast, by Application 2019 & 2032
- Table 12: France Gas Insulated Substation Market Revenue (Million) Forecast, by Application 2019 & 2032
- Table 13: Spain Gas Insulated Substation Market Revenue (Million) Forecast, by Application 2019 & 2032
- Table 14: Italy Gas Insulated Substation Market Revenue (Million) Forecast, by Application 2019 & 2032
- Table 15: Spain Gas Insulated Substation Market Revenue (Million) Forecast, by Application 2019 & 2032
- Table 16: Belgium Gas Insulated Substation Market Revenue (Million) Forecast, by Application 2019 & 2032
- Table 17: Netherland Gas Insulated Substation Market Revenue (Million) Forecast, by Application 2019 & 2032
- Table 18: Nordics Gas Insulated Substation Market Revenue (Million) Forecast, by Application 2019 & 2032
- Table 19: Rest of Europe Gas Insulated Substation Market Revenue (Million) Forecast, by Application 2019 & 2032
- Table 20: Global Gas Insulated Substation Market Revenue Million Forecast, by Country 2019 & 2032
- Table 21: China Gas Insulated Substation Market Revenue (Million) Forecast, by Application 2019 & 2032
- Table 22: Japan Gas Insulated Substation Market Revenue (Million) Forecast, by Application 2019 & 2032
- Table 23: India Gas Insulated Substation Market Revenue (Million) Forecast, by Application 2019 & 2032
- Table 24: South Korea Gas Insulated Substation Market Revenue (Million) Forecast, by Application 2019 & 2032
- Table 25: Southeast Asia Gas Insulated Substation Market Revenue (Million) Forecast, by Application 2019 & 2032
- Table 26: Australia Gas Insulated Substation Market Revenue (Million) Forecast, by Application 2019 & 2032
- Table 27: Indonesia Gas Insulated Substation Market Revenue (Million) Forecast, by Application 2019 & 2032
- Table 28: Phillipes Gas Insulated Substation Market Revenue (Million) Forecast, by Application 2019 & 2032
- Table 29: Singapore Gas Insulated Substation Market Revenue (Million) Forecast, by Application 2019 & 2032
- Table 30: Thailandc Gas Insulated Substation Market Revenue (Million) Forecast, by Application 2019 & 2032
- Table 31: Rest of Asia Pacific Gas Insulated Substation Market Revenue (Million) Forecast, by Application 2019 & 2032
- Table 32: Global Gas Insulated Substation Market Revenue Million Forecast, by Country 2019 & 2032
- Table 33: Brazil Gas Insulated Substation Market Revenue (Million) Forecast, by Application 2019 & 2032
- Table 34: Argentina Gas Insulated Substation Market Revenue (Million) Forecast, by Application 2019 & 2032
- Table 35: Peru Gas Insulated Substation Market Revenue (Million) Forecast, by Application 2019 & 2032
- Table 36: Chile Gas Insulated Substation Market Revenue (Million) Forecast, by Application 2019 & 2032
- Table 37: Colombia Gas Insulated Substation Market Revenue (Million) Forecast, by Application 2019 & 2032
- Table 38: Ecuador Gas Insulated Substation Market Revenue (Million) Forecast, by Application 2019 & 2032
- Table 39: Venezuela Gas Insulated Substation Market Revenue (Million) Forecast, by Application 2019 & 2032
- Table 40: Rest of South America Gas Insulated Substation Market Revenue (Million) Forecast, by Application 2019 & 2032
- Table 41: Global Gas Insulated Substation Market Revenue Million Forecast, by Country 2019 & 2032
- Table 42: United Arab Emirates Gas Insulated Substation Market Revenue (Million) Forecast, by Application 2019 & 2032
- Table 43: Saudi Arabia Gas Insulated Substation Market Revenue (Million) Forecast, by Application 2019 & 2032
- Table 44: South Africa Gas Insulated Substation Market Revenue (Million) Forecast, by Application 2019 & 2032
- Table 45: Rest of Middle East and Africa Gas Insulated Substation Market Revenue (Million) Forecast, by Application 2019 & 2032
- Table 46: Global Gas Insulated Substation Market Revenue Million Forecast, by Voltage 2019 & 2032
- Table 47: Global Gas Insulated Substation Market Revenue Million Forecast, by End-User 2019 & 2032
- Table 48: Global Gas Insulated Substation Market Revenue Million Forecast, by Country 2019 & 2032
- Table 49: Global Gas Insulated Substation Market Revenue Million Forecast, by Voltage 2019 & 2032
- Table 50: Global Gas Insulated Substation Market Revenue Million Forecast, by End-User 2019 & 2032
- Table 51: Global Gas Insulated Substation Market Revenue Million Forecast, by Country 2019 & 2032
- Table 52: Global Gas Insulated Substation Market Revenue Million Forecast, by Voltage 2019 & 2032
- Table 53: Global Gas Insulated Substation Market Revenue Million Forecast, by End-User 2019 & 2032
- Table 54: Global Gas Insulated Substation Market Revenue Million Forecast, by Country 2019 & 2032
- Table 55: Global Gas Insulated Substation Market Revenue Million Forecast, by Voltage 2019 & 2032
- Table 56: Global Gas Insulated Substation Market Revenue Million Forecast, by End-User 2019 & 2032
- Table 57: Global Gas Insulated Substation Market Revenue Million Forecast, by Country 2019 & 2032
- Table 58: Global Gas Insulated Substation Market Revenue Million Forecast, by Voltage 2019 & 2032
- Table 59: Global Gas Insulated Substation Market Revenue Million Forecast, by End-User 2019 & 2032
- Table 60: Global Gas Insulated Substation Market Revenue Million Forecast, by Country 2019 & 2032
Frequently Asked Questions
1. What is the projected Compound Annual Growth Rate (CAGR) of the Gas Insulated Substation Market?
The projected CAGR is approximately > 3.00%.
2. Which companies are prominent players in the Gas Insulated Substation Market?
Key companies in the market include ABB Ltd, Larsen & Toubro Limited, Tbea Co Ltd *List Not Exhaustive, Toshiba Corp, Hitachi Ltd, Bharat Heavy Electricals Limited, Mitsubishi Electric Corporation, Siemens AG, Schneider Electric SE, Powell Industries Inc, Elsewedy Electric Co S A E, CG Power and Industrial Solutions Ltd, General Electric Company, Hyosung Corp.
3. What are the main segments of the Gas Insulated Substation Market?
The market segments include Voltage, End-User.
4. Can you provide details about the market size?
The market size is estimated to be USD XX Million as of 2022.
5. What are some drivers contributing to market growth?
Supportive Government Policies and Incentives4.; Environmental Concerns.
6. What are the notable trends driving market growth?
Power Utilities Sector to Dominate the Market.
7. Are there any restraints impacting market growth?
Fossil Fuel Subsidies.
8. Can you provide examples of recent developments in the market?
N/A
9. What pricing options are available for accessing the report?
Pricing options include single-user, multi-user, and enterprise licenses priced at USD 4750, USD 5250, and USD 8750 respectively.
10. Is the market size provided in terms of value or volume?
The market size is provided in terms of value, measured in Million.
11. Are there any specific market keywords associated with the report?
Yes, the market keyword associated with the report is "Gas Insulated Substation Market," which aids in identifying and referencing the specific market segment covered.
12. How do I determine which pricing option suits my needs best?
The pricing options vary based on user requirements and access needs. Individual users may opt for single-user licenses, while businesses requiring broader access may choose multi-user or enterprise licenses for cost-effective access to the report.
13. Are there any additional resources or data provided in the Gas Insulated Substation Market report?
While the report offers comprehensive insights, it's advisable to review the specific contents or supplementary materials provided to ascertain if additional resources or data are available.
14. How can I stay updated on further developments or reports in the Gas Insulated Substation Market?
To stay informed about further developments, trends, and reports in the Gas Insulated Substation Market, consider subscribing to industry newsletters, following relevant companies and organizations, or regularly checking reputable industry news sources and publications.
Methodology
Step 1 - Identification of Relevant Samples Size from Population Database


Step 2 - Approaches for Defining Global Market Size (Value, Volume* & Price*)

Note*: In applicable scenarios
Step 3 - Data Sources
Primary Research
- Web Analytics
- Survey Reports
- Research Institute
- Latest Research Reports
- Opinion Leaders
Secondary Research
- Annual Reports
- White Paper
- Latest Press Release
- Industry Association
- Paid Database
- Investor Presentations

Step 4 - Data Triangulation
Involves using different sources of information in order to increase the validity of a study
These sources are likely to be stakeholders in a program - participants, other researchers, program staff, other community members, and so on.
Then we put all data in single framework & apply various statistical tools to find out the dynamic on the market.
During the analysis stage, feedback from the stakeholder groups would be compared to determine areas of agreement as well as areas of divergence


