
Key Insights
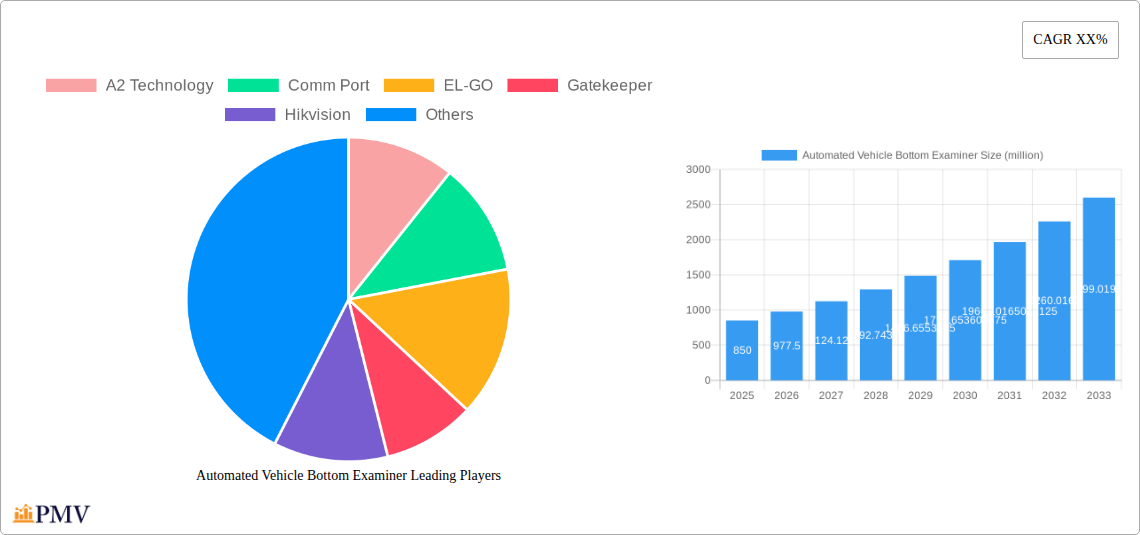
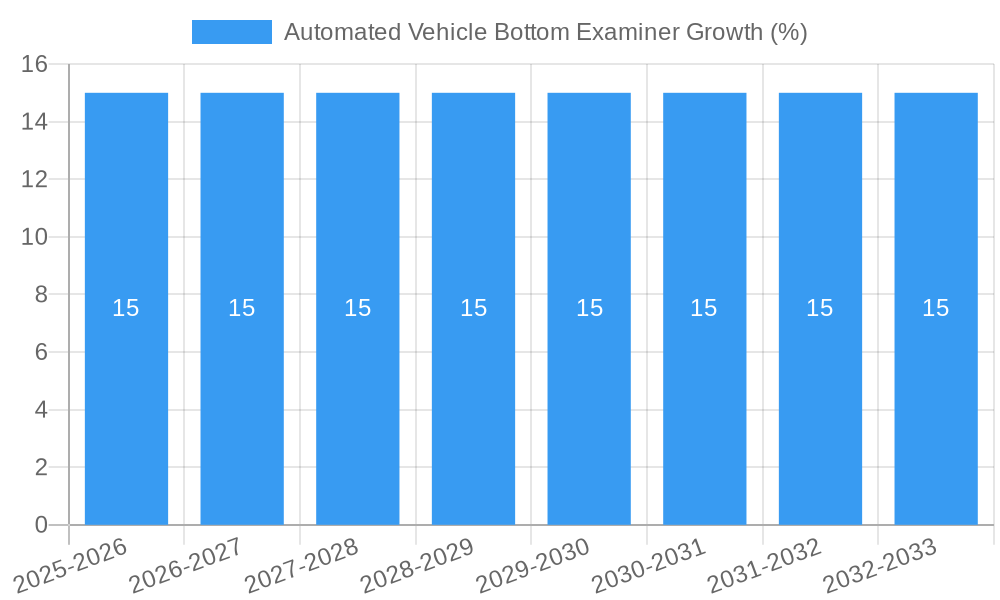
The Automated Vehicle Bottom Examiner market is poised for significant expansion, projected to reach a substantial market size of approximately $850 million by 2025, with a robust Compound Annual Growth Rate (CAGR) of around 15% anticipated through 2033. This growth is largely propelled by escalating global security concerns and the increasing adoption of advanced inspection technologies across critical infrastructure. Government agencies, transportation hubs like airports and stations, and highway checkpoints are the primary drivers for this market, demanding efficient and reliable solutions to detect contraband, explosives, and other illicit items concealed beneath vehicles. The inherent limitations of manual inspections in terms of speed, accuracy, and human error are pushing organizations towards automated systems that offer superior detection capabilities and enhanced operational efficiency.
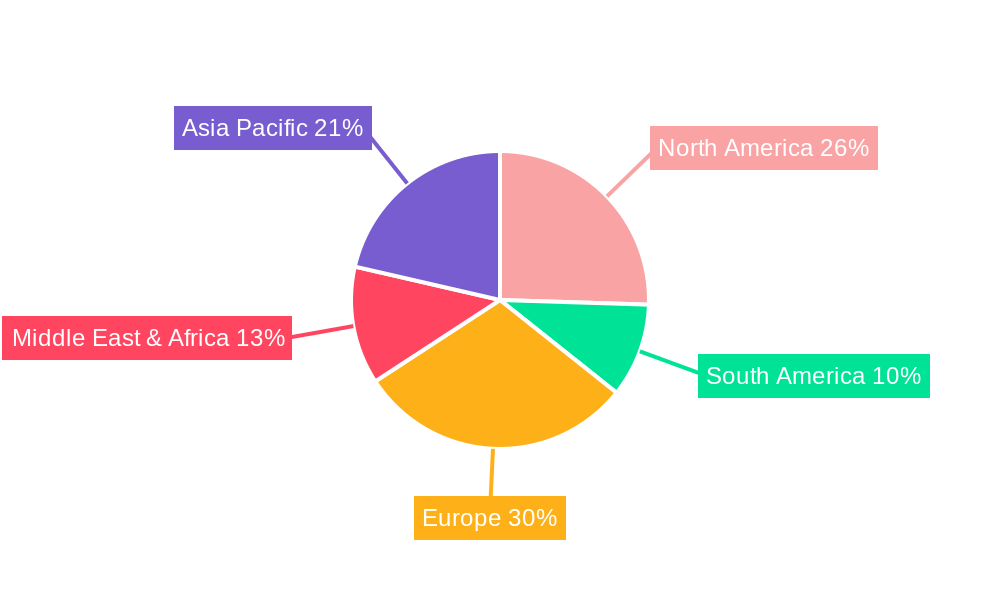
The market is characterized by a growing demand for both fixed and mobile automated vehicle bottom examination systems. Fixed installations are prevalent in high-security areas requiring continuous surveillance, while mobile solutions offer flexibility for temporary checkpoints or event security. Key market restraints include the initial high capital investment required for advanced systems and the need for skilled personnel to operate and maintain them. However, technological advancements, including the integration of AI and machine learning for enhanced threat identification and reduced false positives, are expected to mitigate these challenges. Major players like Hikvision, ZKTeco Co., Gatekeeper, and UVIScan are actively innovating and expanding their product portfolios to cater to the evolving needs of this dynamic market, particularly focusing on improving detection accuracy and streamlining the inspection process. The Asia Pacific region, led by China and India, is emerging as a significant growth hub due to rapid infrastructure development and increasing investments in national security measures.
This in-depth report provides a detailed market analysis of the Automated Vehicle Bottom Examiner sector, covering market structure, industry trends, dominant segments, product innovations, key drivers, challenges, leading players, and strategic outlook. The study period spans from 2019 to 2033, with the base year set at 2025 and the forecast period from 2025 to 2033. Historical data from 2019-2024 is also meticulously analyzed. This report is designed for industry stakeholders, security professionals, government agencies, and technology providers seeking to understand the evolving landscape of vehicle inspection technology.
Automated Vehicle Bottom Examiner Market Structure & Competitive Dynamics
The Automated Vehicle Bottom Examiner market exhibits a moderately concentrated structure, with a mix of established global players and emerging specialized manufacturers. Innovation ecosystems are rapidly developing, driven by advancements in artificial intelligence (AI), machine learning (ML), and high-resolution imaging technologies. Regulatory frameworks are a significant factor, with stringent security mandates in transportation hubs and border control fueling demand. Product substitutes, such as manual inspection methods, are gradually being phased out due to their inefficiency and potential for human error. End-user trends are strongly influenced by the increasing need for robust security measures against terrorism and illicit cargo, leading to a higher adoption rate of advanced inspection solutions. Mergers & Acquisition (M&A) activities are present, with strategic consolidations aiming to broaden product portfolios and expand geographical reach. For instance, recent M&A deals are estimated to be in the range of several million USD, consolidating market share and fostering technological integration. Market share analysis indicates that leading players hold a combined share of approximately 50-60%, with room for smaller, innovative companies to capture niche segments. The competitive landscape is characterized by intense R&D efforts and a focus on delivering comprehensive, end-to-end security solutions.
Automated Vehicle Bottom Examiner Industry Trends & Insights
The Automated Vehicle Bottom Examiner industry is poised for significant expansion, driven by a confluence of technological advancements and escalating security concerns. The Compound Annual Growth Rate (CAGR) for this sector is projected to be robust, estimated between 10% and 15% over the forecast period. Market penetration is steadily increasing as governments and private organizations recognize the indispensable role of these systems in enhancing national security and border control. Key growth drivers include the proliferation of smart city initiatives and the need for efficient, high-throughput screening at critical infrastructure points like airports and major transportation hubs. The demand for faster, more accurate, and less intrusive inspection methods is paramount.
Technological disruptions are at the forefront of this growth. The integration of AI and ML algorithms is revolutionizing threat detection capabilities, enabling systems to identify anomalies and potential contraband with unprecedented accuracy. High-resolution imaging technologies, including advanced X-ray, terahertz, and gamma-ray scanners, are becoming standard, providing detailed subsurface views of vehicle undercarriages. Furthermore, the development of portable and mobile automated vehicle bottom examiners is expanding application possibilities beyond fixed checkpoints, catering to dynamic security needs in various environments.
Consumer preferences are shifting towards systems that offer seamless integration with existing security infrastructure, provide real-time data analytics, and minimize operational downtime. The emphasis is on automated processes that reduce reliance on human operators, thereby minimizing errors and improving overall efficiency. Competitive dynamics are intensifying, with manufacturers vying to offer superior detection rates, faster scanning speeds, and cost-effective solutions. Companies are investing heavily in research and development to stay ahead of evolving threats and technological advancements. The global market size for automated vehicle bottom examiners is estimated to reach over 5,000 million USD by 2028, indicating substantial market potential.
Dominant Markets & Segments in Automated Vehicle Bottom Examiner
The Government Agencies, Stations, Airports, etc. segment stands out as the dominant market for Automated Vehicle Bottom Examiners, driven by stringent national security mandates and the critical need for threat mitigation. Within this overarching segment, Airports represent a particularly high-growth sub-segment due to the continuous flow of international and domestic traffic, necessitating rapid yet thorough screening of all inbound and outbound vehicles, including service vehicles and cargo transporters. The Checkpoint application also holds significant sway, particularly at land borders and critical infrastructure points where unauthorized materials or individuals must be detected.
Key drivers for this dominance include:
- Economic Policies: Government investment in national security and border protection initiatives directly translates into increased procurement of advanced screening technologies. Policies aimed at enhancing public safety and combating terrorism are primary accelerators.
- Infrastructure Development: The ongoing expansion and modernization of transportation infrastructure, including airports, ports, and major highway networks, create a continuous demand for sophisticated security solutions like automated vehicle bottom examiners.
- Regulatory Frameworks: International and national security regulations, such as those enforced by the TSA (Transportation Security Administration) and similar global bodies, mandate the use of advanced inspection technologies, driving adoption.
- Technological Adoption: The inherent security risks associated with large public spaces and transportation hubs compel a proactive approach to adopting cutting-edge technologies for threat detection.
The Fixed type of Automated Vehicle Bottom Examiner is currently the most prevalent within these dominant segments, owing to their suitability for permanent installations at high-traffic locations like airport entry points and border crossings. These fixed systems offer continuous, high-volume scanning capabilities. However, the Mobile segment is experiencing rapid growth, driven by the need for flexible deployment in diverse scenarios, including event security, emergency response, and temporary checkpoints. The market size for these dominant segments is estimated to be over 4,000 million USD in 2025, with projected growth fueled by these underlying drivers.
Automated Vehicle Bottom Examiner Product Innovations
Recent product innovations in the Automated Vehicle Bottom Examiner market are centered on enhancing detection accuracy, improving scanning speed, and increasing system portability. Manufacturers are integrating advanced AI algorithms for superior threat identification, including the detection of explosives, narcotics, and contraband. High-resolution imaging technologies like dual-energy X-ray and terahertz scanning are becoming more sophisticated, offering clearer subsurface visibility. Furthermore, the development of cloud-based data analytics platforms allows for real-time threat assessment and remote monitoring, bolstering security operations. Competitive advantages are being gained through ruggedized designs for mobile units and seamless integration with existing security ecosystems.
Report Segmentation & Scope
This report segments the Automated Vehicle Bottom Examiner market by Application and Type. The Applications covered include Government Agencies, Stations, Airports, etc., Highway, Checkpoint, and Others. The Types analyzed are Fixed and Mobile.
- Government Agencies, Stations, Airports, etc.: This segment, projected to reach a market size of over 3,000 million USD by 2028, is characterized by high demand driven by critical infrastructure security needs and extensive government funding for defense and homeland security. Growth is expected at a CAGR of 12%.
- Highway: The Highway segment, estimated at over 800 million USD by 2028, is driven by the need for traffic management and border control along major thoroughfares, exhibiting a CAGR of 9%.
- Checkpoint: This segment, valued at over 700 million USD by 2028, is crucial for border security and access control, with a CAGR of 10%.
- Others: This diverse segment, encompassing various niche applications, is projected to reach over 500 million USD by 2028, with a CAGR of 8%.
- Fixed: Fixed Automated Vehicle Bottom Examiners, expected to hold a market share of over 60%, are characterized by robust installations at high-traffic locations, with a market size of over 3,000 million USD by 2028 and a CAGR of 10%.
- Mobile: The Mobile segment, with a projected market size of over 2,000 million USD by 2028, is rapidly expanding due to its versatility and adaptability to dynamic security requirements, exhibiting a significant CAGR of 14%.
Key Drivers of Automated Vehicle Bottom Examiner Growth
The growth of the Automated Vehicle Bottom Examiner sector is primarily propelled by escalating global security threats, including terrorism and illicit trafficking. Government mandates and increased defense spending play a crucial role, driving procurement of advanced inspection solutions. Technological advancements, particularly in AI, machine learning, and imaging, enable more accurate and efficient threat detection. The need for faster throughput at critical infrastructure points like airports and borders further fuels adoption. Furthermore, the ongoing expansion of transportation networks and smart city initiatives create new opportunities for deployment and integration of these vital security systems.
Challenges in the Automated Vehicle Bottom Examiner Sector
Despite robust growth, the Automated Vehicle Bottom Examiner sector faces several challenges. High initial investment costs for sophisticated systems can be a barrier for some organizations, particularly smaller entities. Regulatory hurdles and the need for system certification in different jurisdictions can slow down market penetration. Supply chain disruptions, as witnessed in recent years, can impact manufacturing and delivery timelines. Furthermore, the continuous need for software updates and technician training to keep pace with evolving threats and technological advancements adds to the operational complexity and cost. Competitive pressures from established players and new entrants also necessitate ongoing innovation and price optimization.
Leading Players in the Automated Vehicle Bottom Examiner Market
- A2 Technology
- Comm Port
- EL-GO
- Gatekeeper
- Hikvision
- Matrix Security
- SafeAgle
- SECOM
- SecuScan
- Ulgen
- UVIScan
- Vehant
- Westminster
- ZKTeco Co
- ZOAN GAOKE
- Advanced Detection Technology
- Nestor Technologies
Key Developments in Automated Vehicle Bottom Examiner Sector
- 2023: Launch of AI-powered threat detection algorithms significantly improving accuracy in identifying concealed items.
- 2022: Introduction of highly portable mobile UVIScan systems for rapid deployment at events and temporary checkpoints.
- 2022: Increased integration of cloud-based analytics for real-time data monitoring and remote diagnostics across Westminster systems.
- 2021: Strategic partnership between Hikvision and a major airport authority to enhance security screening infrastructure.
- 2020: Vehant unveils a new generation of high-speed X-ray inspection systems for large cargo vehicles.
- 2019: Gatekeeper announces the successful deployment of its undercarriage inspection systems at a major international border crossing.
Strategic Automated Vehicle Bottom Examiner Market Outlook
The future outlook for the Automated Vehicle Bottom Examiner market is exceptionally bright, driven by an unwavering global focus on security and the continuous evolution of threat landscapes. Growth accelerators include the ongoing development of AI and ML for enhanced threat intelligence, alongside the increasing adoption of integrated security platforms that offer end-to-end solutions. The expansion of smart city projects and the rise of autonomous vehicles will also present new avenues for deployment and innovation. Opportunities lie in developing more compact, energy-efficient, and user-friendly systems, as well as in providing advanced data analytics and cybersecurity for inspection infrastructure. Strategic partnerships and continuous R&D investment will be crucial for companies aiming to capture a significant share of this rapidly expanding market, estimated to surpass 10,000 million USD by 2033.
Automated Vehicle Bottom Examiner Segmentation
-
1. Application
- 1.1. Government Agencies
- 1.2. Stations, Airports, etc
- 1.3. Highway
- 1.4. Checkpoint
- 1.5. Others
-
2. Types
- 2.1. Fixed
- 2.2. Mobile
Automated Vehicle Bottom Examiner Segmentation By Geography
-
1. North America
- 1.1. United States
- 1.2. Canada
- 1.3. Mexico
-
2. South America
- 2.1. Brazil
- 2.2. Argentina
- 2.3. Rest of South America
-
3. Europe
- 3.1. United Kingdom
- 3.2. Germany
- 3.3. France
- 3.4. Italy
- 3.5. Spain
- 3.6. Russia
- 3.7. Benelux
- 3.8. Nordics
- 3.9. Rest of Europe
-
4. Middle East & Africa
- 4.1. Turkey
- 4.2. Israel
- 4.3. GCC
- 4.4. North Africa
- 4.5. South Africa
- 4.6. Rest of Middle East & Africa
-
5. Asia Pacific
- 5.1. China
- 5.2. India
- 5.3. Japan
- 5.4. South Korea
- 5.5. ASEAN
- 5.6. Oceania
- 5.7. Rest of Asia Pacific
Automated Vehicle Bottom Examiner REPORT HIGHLIGHTS
| Aspects | Details |
|---|---|
| Study Period | 2019-2033 |
| Base Year | 2024 |
| Estimated Year | 2025 |
| Forecast Period | 2025-2033 |
| Historical Period | 2019-2024 |
| Growth Rate | CAGR of XX% from 2019-2033 |
| Segmentation |
|
Table of Contents
- 1. Introduction
- 1.1. Research Scope
- 1.2. Market Segmentation
- 1.3. Research Methodology
- 1.4. Definitions and Assumptions
- 2. Executive Summary
- 2.1. Introduction
- 3. Market Dynamics
- 3.1. Introduction
- 3.2. Market Drivers
- 3.3. Market Restrains
- 3.4. Market Trends
- 4. Market Factor Analysis
- 4.1. Porters Five Forces
- 4.2. Supply/Value Chain
- 4.3. PESTEL analysis
- 4.4. Market Entropy
- 4.5. Patent/Trademark Analysis
- 5. Global Automated Vehicle Bottom Examiner Analysis, Insights and Forecast, 2019-2031
- 5.1. Market Analysis, Insights and Forecast - by Application
- 5.1.1. Government Agencies
- 5.1.2. Stations, Airports, etc
- 5.1.3. Highway
- 5.1.4. Checkpoint
- 5.1.5. Others
- 5.2. Market Analysis, Insights and Forecast - by Types
- 5.2.1. Fixed
- 5.2.2. Mobile
- 5.3. Market Analysis, Insights and Forecast - by Region
- 5.3.1. North America
- 5.3.2. South America
- 5.3.3. Europe
- 5.3.4. Middle East & Africa
- 5.3.5. Asia Pacific
- 5.1. Market Analysis, Insights and Forecast - by Application
- 6. North America Automated Vehicle Bottom Examiner Analysis, Insights and Forecast, 2019-2031
- 6.1. Market Analysis, Insights and Forecast - by Application
- 6.1.1. Government Agencies
- 6.1.2. Stations, Airports, etc
- 6.1.3. Highway
- 6.1.4. Checkpoint
- 6.1.5. Others
- 6.2. Market Analysis, Insights and Forecast - by Types
- 6.2.1. Fixed
- 6.2.2. Mobile
- 6.1. Market Analysis, Insights and Forecast - by Application
- 7. South America Automated Vehicle Bottom Examiner Analysis, Insights and Forecast, 2019-2031
- 7.1. Market Analysis, Insights and Forecast - by Application
- 7.1.1. Government Agencies
- 7.1.2. Stations, Airports, etc
- 7.1.3. Highway
- 7.1.4. Checkpoint
- 7.1.5. Others
- 7.2. Market Analysis, Insights and Forecast - by Types
- 7.2.1. Fixed
- 7.2.2. Mobile
- 7.1. Market Analysis, Insights and Forecast - by Application
- 8. Europe Automated Vehicle Bottom Examiner Analysis, Insights and Forecast, 2019-2031
- 8.1. Market Analysis, Insights and Forecast - by Application
- 8.1.1. Government Agencies
- 8.1.2. Stations, Airports, etc
- 8.1.3. Highway
- 8.1.4. Checkpoint
- 8.1.5. Others
- 8.2. Market Analysis, Insights and Forecast - by Types
- 8.2.1. Fixed
- 8.2.2. Mobile
- 8.1. Market Analysis, Insights and Forecast - by Application
- 9. Middle East & Africa Automated Vehicle Bottom Examiner Analysis, Insights and Forecast, 2019-2031
- 9.1. Market Analysis, Insights and Forecast - by Application
- 9.1.1. Government Agencies
- 9.1.2. Stations, Airports, etc
- 9.1.3. Highway
- 9.1.4. Checkpoint
- 9.1.5. Others
- 9.2. Market Analysis, Insights and Forecast - by Types
- 9.2.1. Fixed
- 9.2.2. Mobile
- 9.1. Market Analysis, Insights and Forecast - by Application
- 10. Asia Pacific Automated Vehicle Bottom Examiner Analysis, Insights and Forecast, 2019-2031
- 10.1. Market Analysis, Insights and Forecast - by Application
- 10.1.1. Government Agencies
- 10.1.2. Stations, Airports, etc
- 10.1.3. Highway
- 10.1.4. Checkpoint
- 10.1.5. Others
- 10.2. Market Analysis, Insights and Forecast - by Types
- 10.2.1. Fixed
- 10.2.2. Mobile
- 10.1. Market Analysis, Insights and Forecast - by Application
- 11. Competitive Analysis
- 11.1. Global Market Share Analysis 2024
- 11.2. Company Profiles
- 11.2.1 A2 Technology
- 11.2.1.1. Overview
- 11.2.1.2. Products
- 11.2.1.3. SWOT Analysis
- 11.2.1.4. Recent Developments
- 11.2.1.5. Financials (Based on Availability)
- 11.2.2 Comm Port
- 11.2.2.1. Overview
- 11.2.2.2. Products
- 11.2.2.3. SWOT Analysis
- 11.2.2.4. Recent Developments
- 11.2.2.5. Financials (Based on Availability)
- 11.2.3 EL-GO
- 11.2.3.1. Overview
- 11.2.3.2. Products
- 11.2.3.3. SWOT Analysis
- 11.2.3.4. Recent Developments
- 11.2.3.5. Financials (Based on Availability)
- 11.2.4 Gatekeeper
- 11.2.4.1. Overview
- 11.2.4.2. Products
- 11.2.4.3. SWOT Analysis
- 11.2.4.4. Recent Developments
- 11.2.4.5. Financials (Based on Availability)
- 11.2.5 Hikvision
- 11.2.5.1. Overview
- 11.2.5.2. Products
- 11.2.5.3. SWOT Analysis
- 11.2.5.4. Recent Developments
- 11.2.5.5. Financials (Based on Availability)
- 11.2.6 Matrix Security
- 11.2.6.1. Overview
- 11.2.6.2. Products
- 11.2.6.3. SWOT Analysis
- 11.2.6.4. Recent Developments
- 11.2.6.5. Financials (Based on Availability)
- 11.2.7 SafeAgle
- 11.2.7.1. Overview
- 11.2.7.2. Products
- 11.2.7.3. SWOT Analysis
- 11.2.7.4. Recent Developments
- 11.2.7.5. Financials (Based on Availability)
- 11.2.8 SECOM
- 11.2.8.1. Overview
- 11.2.8.2. Products
- 11.2.8.3. SWOT Analysis
- 11.2.8.4. Recent Developments
- 11.2.8.5. Financials (Based on Availability)
- 11.2.9 SecuScan
- 11.2.9.1. Overview
- 11.2.9.2. Products
- 11.2.9.3. SWOT Analysis
- 11.2.9.4. Recent Developments
- 11.2.9.5. Financials (Based on Availability)
- 11.2.10 Ulgen
- 11.2.10.1. Overview
- 11.2.10.2. Products
- 11.2.10.3. SWOT Analysis
- 11.2.10.4. Recent Developments
- 11.2.10.5. Financials (Based on Availability)
- 11.2.11 UVIScan
- 11.2.11.1. Overview
- 11.2.11.2. Products
- 11.2.11.3. SWOT Analysis
- 11.2.11.4. Recent Developments
- 11.2.11.5. Financials (Based on Availability)
- 11.2.12 Vehant
- 11.2.12.1. Overview
- 11.2.12.2. Products
- 11.2.12.3. SWOT Analysis
- 11.2.12.4. Recent Developments
- 11.2.12.5. Financials (Based on Availability)
- 11.2.13 Westminster
- 11.2.13.1. Overview
- 11.2.13.2. Products
- 11.2.13.3. SWOT Analysis
- 11.2.13.4. Recent Developments
- 11.2.13.5. Financials (Based on Availability)
- 11.2.14 ZKTeco Co
- 11.2.14.1. Overview
- 11.2.14.2. Products
- 11.2.14.3. SWOT Analysis
- 11.2.14.4. Recent Developments
- 11.2.14.5. Financials (Based on Availability)
- 11.2.15 ZOAN GAOKE
- 11.2.15.1. Overview
- 11.2.15.2. Products
- 11.2.15.3. SWOT Analysis
- 11.2.15.4. Recent Developments
- 11.2.15.5. Financials (Based on Availability)
- 11.2.16 Advanced Detection Technology
- 11.2.16.1. Overview
- 11.2.16.2. Products
- 11.2.16.3. SWOT Analysis
- 11.2.16.4. Recent Developments
- 11.2.16.5. Financials (Based on Availability)
- 11.2.17 Nestor Technologies
- 11.2.17.1. Overview
- 11.2.17.2. Products
- 11.2.17.3. SWOT Analysis
- 11.2.17.4. Recent Developments
- 11.2.17.5. Financials (Based on Availability)
- 11.2.1 A2 Technology
List of Figures
- Figure 1: Global Automated Vehicle Bottom Examiner Revenue Breakdown (million, %) by Region 2024 & 2032
- Figure 2: North America Automated Vehicle Bottom Examiner Revenue (million), by Application 2024 & 2032
- Figure 3: North America Automated Vehicle Bottom Examiner Revenue Share (%), by Application 2024 & 2032
- Figure 4: North America Automated Vehicle Bottom Examiner Revenue (million), by Types 2024 & 2032
- Figure 5: North America Automated Vehicle Bottom Examiner Revenue Share (%), by Types 2024 & 2032
- Figure 6: North America Automated Vehicle Bottom Examiner Revenue (million), by Country 2024 & 2032
- Figure 7: North America Automated Vehicle Bottom Examiner Revenue Share (%), by Country 2024 & 2032
- Figure 8: South America Automated Vehicle Bottom Examiner Revenue (million), by Application 2024 & 2032
- Figure 9: South America Automated Vehicle Bottom Examiner Revenue Share (%), by Application 2024 & 2032
- Figure 10: South America Automated Vehicle Bottom Examiner Revenue (million), by Types 2024 & 2032
- Figure 11: South America Automated Vehicle Bottom Examiner Revenue Share (%), by Types 2024 & 2032
- Figure 12: South America Automated Vehicle Bottom Examiner Revenue (million), by Country 2024 & 2032
- Figure 13: South America Automated Vehicle Bottom Examiner Revenue Share (%), by Country 2024 & 2032
- Figure 14: Europe Automated Vehicle Bottom Examiner Revenue (million), by Application 2024 & 2032
- Figure 15: Europe Automated Vehicle Bottom Examiner Revenue Share (%), by Application 2024 & 2032
- Figure 16: Europe Automated Vehicle Bottom Examiner Revenue (million), by Types 2024 & 2032
- Figure 17: Europe Automated Vehicle Bottom Examiner Revenue Share (%), by Types 2024 & 2032
- Figure 18: Europe Automated Vehicle Bottom Examiner Revenue (million), by Country 2024 & 2032
- Figure 19: Europe Automated Vehicle Bottom Examiner Revenue Share (%), by Country 2024 & 2032
- Figure 20: Middle East & Africa Automated Vehicle Bottom Examiner Revenue (million), by Application 2024 & 2032
- Figure 21: Middle East & Africa Automated Vehicle Bottom Examiner Revenue Share (%), by Application 2024 & 2032
- Figure 22: Middle East & Africa Automated Vehicle Bottom Examiner Revenue (million), by Types 2024 & 2032
- Figure 23: Middle East & Africa Automated Vehicle Bottom Examiner Revenue Share (%), by Types 2024 & 2032
- Figure 24: Middle East & Africa Automated Vehicle Bottom Examiner Revenue (million), by Country 2024 & 2032
- Figure 25: Middle East & Africa Automated Vehicle Bottom Examiner Revenue Share (%), by Country 2024 & 2032
- Figure 26: Asia Pacific Automated Vehicle Bottom Examiner Revenue (million), by Application 2024 & 2032
- Figure 27: Asia Pacific Automated Vehicle Bottom Examiner Revenue Share (%), by Application 2024 & 2032
- Figure 28: Asia Pacific Automated Vehicle Bottom Examiner Revenue (million), by Types 2024 & 2032
- Figure 29: Asia Pacific Automated Vehicle Bottom Examiner Revenue Share (%), by Types 2024 & 2032
- Figure 30: Asia Pacific Automated Vehicle Bottom Examiner Revenue (million), by Country 2024 & 2032
- Figure 31: Asia Pacific Automated Vehicle Bottom Examiner Revenue Share (%), by Country 2024 & 2032
List of Tables
- Table 1: Global Automated Vehicle Bottom Examiner Revenue million Forecast, by Region 2019 & 2032
- Table 2: Global Automated Vehicle Bottom Examiner Revenue million Forecast, by Application 2019 & 2032
- Table 3: Global Automated Vehicle Bottom Examiner Revenue million Forecast, by Types 2019 & 2032
- Table 4: Global Automated Vehicle Bottom Examiner Revenue million Forecast, by Region 2019 & 2032
- Table 5: Global Automated Vehicle Bottom Examiner Revenue million Forecast, by Application 2019 & 2032
- Table 6: Global Automated Vehicle Bottom Examiner Revenue million Forecast, by Types 2019 & 2032
- Table 7: Global Automated Vehicle Bottom Examiner Revenue million Forecast, by Country 2019 & 2032
- Table 8: United States Automated Vehicle Bottom Examiner Revenue (million) Forecast, by Application 2019 & 2032
- Table 9: Canada Automated Vehicle Bottom Examiner Revenue (million) Forecast, by Application 2019 & 2032
- Table 10: Mexico Automated Vehicle Bottom Examiner Revenue (million) Forecast, by Application 2019 & 2032
- Table 11: Global Automated Vehicle Bottom Examiner Revenue million Forecast, by Application 2019 & 2032
- Table 12: Global Automated Vehicle Bottom Examiner Revenue million Forecast, by Types 2019 & 2032
- Table 13: Global Automated Vehicle Bottom Examiner Revenue million Forecast, by Country 2019 & 2032
- Table 14: Brazil Automated Vehicle Bottom Examiner Revenue (million) Forecast, by Application 2019 & 2032
- Table 15: Argentina Automated Vehicle Bottom Examiner Revenue (million) Forecast, by Application 2019 & 2032
- Table 16: Rest of South America Automated Vehicle Bottom Examiner Revenue (million) Forecast, by Application 2019 & 2032
- Table 17: Global Automated Vehicle Bottom Examiner Revenue million Forecast, by Application 2019 & 2032
- Table 18: Global Automated Vehicle Bottom Examiner Revenue million Forecast, by Types 2019 & 2032
- Table 19: Global Automated Vehicle Bottom Examiner Revenue million Forecast, by Country 2019 & 2032
- Table 20: United Kingdom Automated Vehicle Bottom Examiner Revenue (million) Forecast, by Application 2019 & 2032
- Table 21: Germany Automated Vehicle Bottom Examiner Revenue (million) Forecast, by Application 2019 & 2032
- Table 22: France Automated Vehicle Bottom Examiner Revenue (million) Forecast, by Application 2019 & 2032
- Table 23: Italy Automated Vehicle Bottom Examiner Revenue (million) Forecast, by Application 2019 & 2032
- Table 24: Spain Automated Vehicle Bottom Examiner Revenue (million) Forecast, by Application 2019 & 2032
- Table 25: Russia Automated Vehicle Bottom Examiner Revenue (million) Forecast, by Application 2019 & 2032
- Table 26: Benelux Automated Vehicle Bottom Examiner Revenue (million) Forecast, by Application 2019 & 2032
- Table 27: Nordics Automated Vehicle Bottom Examiner Revenue (million) Forecast, by Application 2019 & 2032
- Table 28: Rest of Europe Automated Vehicle Bottom Examiner Revenue (million) Forecast, by Application 2019 & 2032
- Table 29: Global Automated Vehicle Bottom Examiner Revenue million Forecast, by Application 2019 & 2032
- Table 30: Global Automated Vehicle Bottom Examiner Revenue million Forecast, by Types 2019 & 2032
- Table 31: Global Automated Vehicle Bottom Examiner Revenue million Forecast, by Country 2019 & 2032
- Table 32: Turkey Automated Vehicle Bottom Examiner Revenue (million) Forecast, by Application 2019 & 2032
- Table 33: Israel Automated Vehicle Bottom Examiner Revenue (million) Forecast, by Application 2019 & 2032
- Table 34: GCC Automated Vehicle Bottom Examiner Revenue (million) Forecast, by Application 2019 & 2032
- Table 35: North Africa Automated Vehicle Bottom Examiner Revenue (million) Forecast, by Application 2019 & 2032
- Table 36: South Africa Automated Vehicle Bottom Examiner Revenue (million) Forecast, by Application 2019 & 2032
- Table 37: Rest of Middle East & Africa Automated Vehicle Bottom Examiner Revenue (million) Forecast, by Application 2019 & 2032
- Table 38: Global Automated Vehicle Bottom Examiner Revenue million Forecast, by Application 2019 & 2032
- Table 39: Global Automated Vehicle Bottom Examiner Revenue million Forecast, by Types 2019 & 2032
- Table 40: Global Automated Vehicle Bottom Examiner Revenue million Forecast, by Country 2019 & 2032
- Table 41: China Automated Vehicle Bottom Examiner Revenue (million) Forecast, by Application 2019 & 2032
- Table 42: India Automated Vehicle Bottom Examiner Revenue (million) Forecast, by Application 2019 & 2032
- Table 43: Japan Automated Vehicle Bottom Examiner Revenue (million) Forecast, by Application 2019 & 2032
- Table 44: South Korea Automated Vehicle Bottom Examiner Revenue (million) Forecast, by Application 2019 & 2032
- Table 45: ASEAN Automated Vehicle Bottom Examiner Revenue (million) Forecast, by Application 2019 & 2032
- Table 46: Oceania Automated Vehicle Bottom Examiner Revenue (million) Forecast, by Application 2019 & 2032
- Table 47: Rest of Asia Pacific Automated Vehicle Bottom Examiner Revenue (million) Forecast, by Application 2019 & 2032
Frequently Asked Questions
1. What is the projected Compound Annual Growth Rate (CAGR) of the Automated Vehicle Bottom Examiner?
The projected CAGR is approximately XX%.
2. Which companies are prominent players in the Automated Vehicle Bottom Examiner?
Key companies in the market include A2 Technology, Comm Port, EL-GO, Gatekeeper, Hikvision, Matrix Security, SafeAgle, SECOM, SecuScan, Ulgen, UVIScan, Vehant, Westminster, ZKTeco Co, ZOAN GAOKE, Advanced Detection Technology, Nestor Technologies.
3. What are the main segments of the Automated Vehicle Bottom Examiner?
The market segments include Application, Types.
4. Can you provide details about the market size?
The market size is estimated to be USD XXX million as of 2022.
5. What are some drivers contributing to market growth?
N/A
6. What are the notable trends driving market growth?
N/A
7. Are there any restraints impacting market growth?
N/A
8. Can you provide examples of recent developments in the market?
N/A
9. What pricing options are available for accessing the report?
Pricing options include single-user, multi-user, and enterprise licenses priced at USD 2900.00, USD 4350.00, and USD 5800.00 respectively.
10. Is the market size provided in terms of value or volume?
The market size is provided in terms of value, measured in million.
11. Are there any specific market keywords associated with the report?
Yes, the market keyword associated with the report is "Automated Vehicle Bottom Examiner," which aids in identifying and referencing the specific market segment covered.
12. How do I determine which pricing option suits my needs best?
The pricing options vary based on user requirements and access needs. Individual users may opt for single-user licenses, while businesses requiring broader access may choose multi-user or enterprise licenses for cost-effective access to the report.
13. Are there any additional resources or data provided in the Automated Vehicle Bottom Examiner report?
While the report offers comprehensive insights, it's advisable to review the specific contents or supplementary materials provided to ascertain if additional resources or data are available.
14. How can I stay updated on further developments or reports in the Automated Vehicle Bottom Examiner?
To stay informed about further developments, trends, and reports in the Automated Vehicle Bottom Examiner, consider subscribing to industry newsletters, following relevant companies and organizations, or regularly checking reputable industry news sources and publications.
Methodology
Step 1 - Identification of Relevant Samples Size from Population Database


Step 2 - Approaches for Defining Global Market Size (Value, Volume* & Price*)

Note*: In applicable scenarios
Step 3 - Data Sources
Primary Research
- Web Analytics
- Survey Reports
- Research Institute
- Latest Research Reports
- Opinion Leaders
Secondary Research
- Annual Reports
- White Paper
- Latest Press Release
- Industry Association
- Paid Database
- Investor Presentations

Step 4 - Data Triangulation
Involves using different sources of information in order to increase the validity of a study
These sources are likely to be stakeholders in a program - participants, other researchers, program staff, other community members, and so on.
Then we put all data in single framework & apply various statistical tools to find out the dynamic on the market.
During the analysis stage, feedback from the stakeholder groups would be compared to determine areas of agreement as well as areas of divergence


