
Key Insights
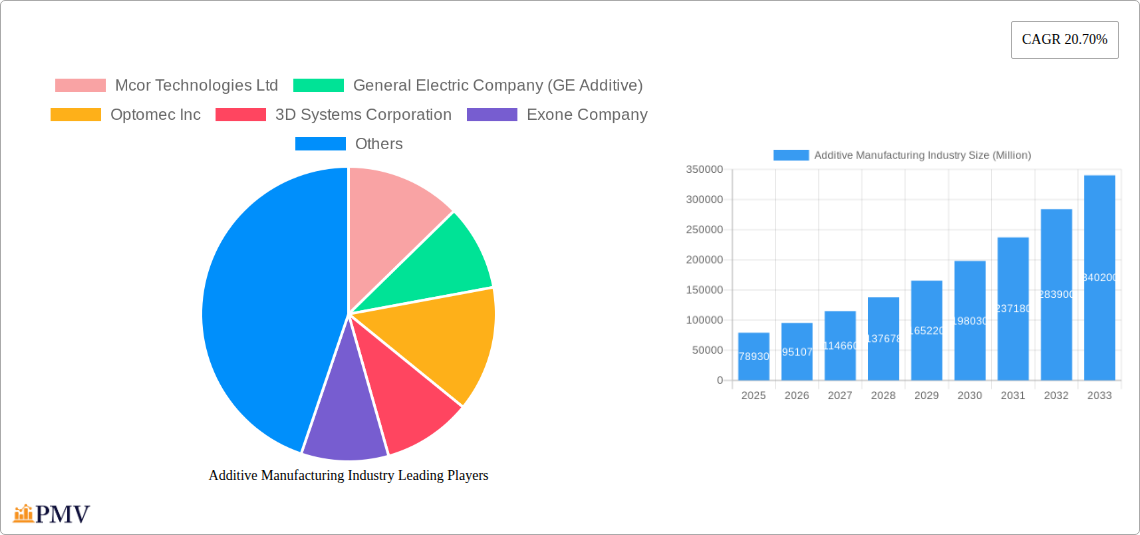
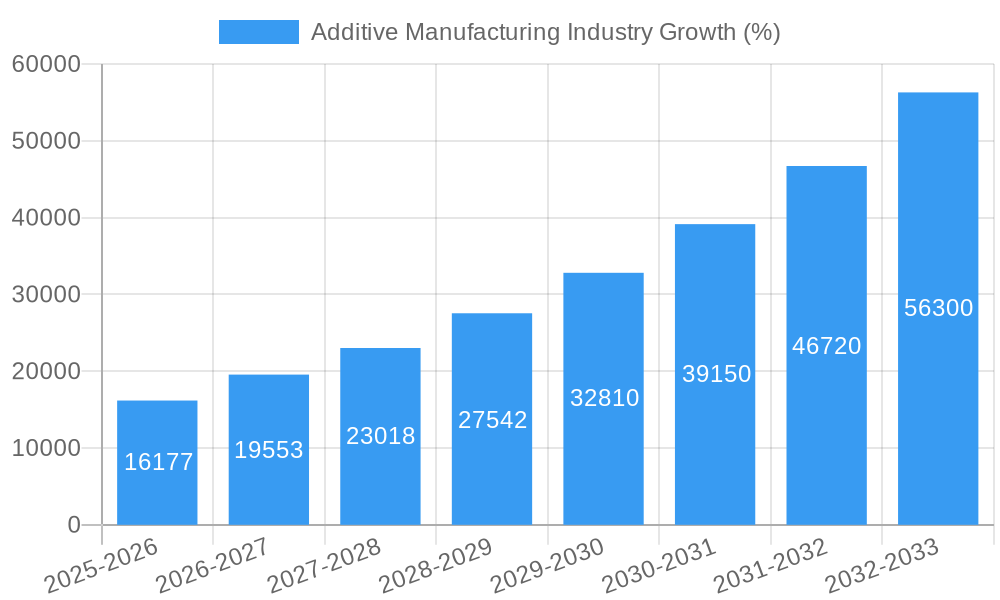
The Additive Manufacturing (AM) industry, also known as 3D printing, is experiencing robust growth, projected to reach a market size of $78.93 billion in 2025 and maintain a Compound Annual Growth Rate (CAGR) of 20.70% from 2025 to 2033. This expansion is driven by several key factors. Increasing adoption across diverse sectors like aerospace & defense (demanding high-precision parts), automotive (prototyping and customized components), and healthcare (personalized medical devices and implants) fuels market expansion. Technological advancements, such as the development of faster, more precise, and cost-effective 3D printing technologies (Stereo Lithography, Fused Deposition Modelling, Laser Sintering, etc.), are further accelerating growth. The ability to produce complex geometries, on-demand manufacturing, and reduced material waste are significant advantages attracting businesses seeking efficiency and innovation. While material limitations and high initial investment costs present some challenges, the overall market trajectory indicates a strong positive outlook. The shift towards sustainable manufacturing practices and the growing demand for customized products will likely continue to propel the AM market forward.
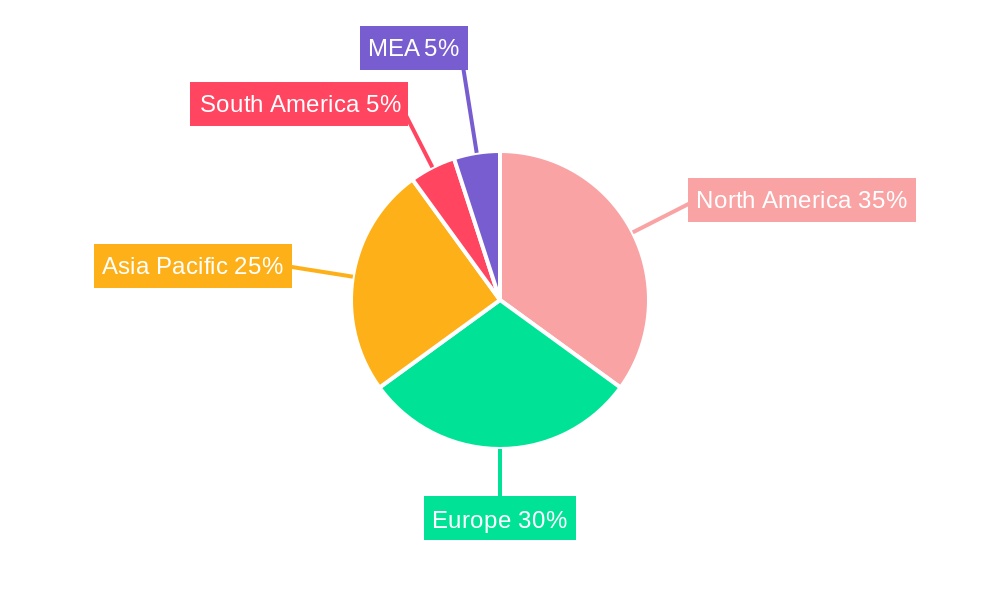
The geographic distribution of the AM market reveals a diverse landscape. North America and Europe currently hold significant market shares, driven by established industrial bases and early adoption of 3D printing technologies. However, the Asia-Pacific region is expected to witness the fastest growth due to rapid industrialization, increasing investments in advanced manufacturing, and a growing consumer base. Companies such as 3D Systems, Stratasys, and GE Additive are key players, continuously innovating and expanding their product portfolios to cater to the evolving market demands. The industry’s segmentation by technology (e.g., SLA, FDM, SLS), material (plastics, metals, ceramics), and end-user industries reflects the diverse applications and opportunities within the AM landscape. The ongoing development of new materials, improved software solutions, and increased accessibility of 3D printing technologies will continue to shape the future of this dynamic market.
Additive Manufacturing Industry: A Comprehensive Market Report (2019-2033)
This comprehensive report provides an in-depth analysis of the Additive Manufacturing (AM) industry, offering valuable insights into market trends, competitive dynamics, and future growth prospects. The report covers the period from 2019 to 2033, with a focus on the 2025-2033 forecast period. The study encompasses key segments, including technology, end-user industries, and materials, and profiles leading players such as Mcor Technologies Ltd, General Electric Company (GE Additive), Optomec Inc, 3D Systems Corporation, Exone Company, SLM Solutions Group AG, EOS GmbH, Materialise NV, Stratasys Ltd, and EnvisionTEC GmbH. The total market size is projected to reach xx Million by 2033.
Additive Manufacturing Industry Market Structure & Competitive Dynamics
The Additive Manufacturing industry exhibits a moderately concentrated market structure, with several major players holding significant market share. However, the landscape is dynamic, characterized by ongoing innovation, strategic mergers and acquisitions (M&A), and the emergence of new technologies. The market concentration ratio (CR4) is estimated at xx%, indicating a balance between established players and emerging competitors. Innovation ecosystems are thriving, with collaborations between research institutions, startups, and established manufacturers driving technological advancements. Regulatory frameworks vary across regions, impacting adoption rates and market access. Product substitutes, such as traditional manufacturing processes, pose competition, but AM's unique advantages in prototyping, customization, and lightweighting continue to fuel its growth. End-user trends reveal increasing demand for customized products and faster production cycles, bolstering the AM market.
Recent M&A activity highlights the industry’s consolidation. While precise deal values are confidential for many transactions, significant deals involving xx Million in value have been observed within the last five years. This activity demonstrates the strategic importance of AM technologies and market players’ efforts to strengthen their positions.
- Market Share (2024 Estimate): 3D Systems Corporation (xx%), Stratasys Ltd (xx%), GE Additive (xx%), Others (xx%).
- Key M&A Activities (2019-2024): [Include 2-3 examples of significant M&A deals with estimated values, if available. Otherwise, indicate "Data unavailable."]
Additive Manufacturing Industry Industry Trends & Insights
The Additive Manufacturing industry is experiencing robust growth, driven by several key factors. The market's Compound Annual Growth Rate (CAGR) is projected to be xx% during the forecast period (2025-2033). Technological advancements, such as the development of new materials and printing processes, are significantly impacting the industry. Increasing demand for customized products across various end-user sectors, coupled with the ability of AM to produce complex geometries efficiently, are key growth drivers. Consumer preferences are shifting towards sustainable and on-demand manufacturing solutions, further propelling the adoption of AM technologies. Market penetration varies significantly across sectors, with aerospace and automotive showing higher adoption rates compared to others. Competitive dynamics are intense, with players focusing on innovation, strategic partnerships, and geographical expansion.
Dominant Markets & Segments in Additive Manufacturing Industry
The Additive Manufacturing market demonstrates significant regional variation in growth and adoption. While data on precise market dominance is proprietary and varies based on the specific segment, North America and Europe currently hold a sizable market share, driven by strong technological advancements, established industrial infrastructure, and significant government investment in AM. Asia-Pacific is expected to exhibit rapid growth over the forecast period.
By Technology:
- Laser Sintering: Remains a dominant technology due to its ability to produce high-precision parts from various materials.
- Fused Deposition Modelling (FDM): Holds a significant market share, particularly in prototyping and low-volume production due to its relative affordability and ease of use.
- Stereo Lithography (SLA): Maintains a presence in specialized applications requiring high accuracy and surface finish.
By End User:
- Aerospace and Defense: This segment is a key driver of growth due to the need for lightweight, high-strength components and the demand for complex geometries.
- Automotive: The adoption of AM for tooling and the production of customized parts is rapidly increasing.
- Healthcare: The use of AM in producing personalized medical implants and prosthetics is showing significant potential.
By Material:
- Metals: The ability to produce high-strength metal components using AM is a significant market driver, especially in aerospace and automotive.
- Plastics: The wide range of plastic materials available and the versatility of AM processes make this a dominant segment.
Key Drivers:
- Strong government support through funding and regulatory policies.
- Advances in material science enabling new applications and broader use cases.
- Growing demand for mass customization across various sectors.
Additive Manufacturing Industry Product Innovations
Recent product developments focus on increasing speed, precision, and material diversity. Companies are introducing high-speed printing systems, advanced materials with improved mechanical properties, and software solutions that streamline design and production processes. These innovations expand the range of applications and cater to the growing demands for efficiency and customization, enhancing competitiveness within the industry.
Report Segmentation & Scope
This report segments the Additive Manufacturing market by technology (Stereo Lithography, Fused Deposition Modelling, Laser Sintering, Binder Jetting Printing, Other Technologies), end-user (Aerospace and Defense, Automotive, Healthcare, Industrial, Other End Users), and material (Plastic, Metals, Ceramics). Each segment's growth projections are based on detailed market size estimations, competitive landscape analysis, and an evaluation of prevailing industry trends. Specific growth rates and market sizes for each segment are detailed within the full report. Competitive dynamics within each segment are analyzed, highlighting key players and their market strategies.
Key Drivers of Additive Manufacturing Industry Growth
Several factors contribute to the growth of the Additive Manufacturing industry. Technological advancements, including the development of faster and more precise printing technologies, are crucial. The increasing demand for customized products across various industries is another key driver. Furthermore, supportive government policies and initiatives promote the adoption of AM technologies. Finally, the cost-effectiveness of AM compared to traditional manufacturing in certain applications is fueling growth.
Challenges in the Additive Manufacturing Industry Sector
The Additive Manufacturing industry faces challenges, including high initial investment costs for equipment, the relatively slow production speed compared to traditional manufacturing for mass production, and supply chain constraints for some specialized materials. Furthermore, regulatory hurdles and the need for skilled personnel represent barriers to wider adoption. These factors can affect profitability and market penetration, impacting overall industry growth.
Leading Players in the Additive Manufacturing Industry Market
- Mcor Technologies Ltd
- General Electric Company (GE Additive)
- Optomec Inc
- 3D Systems Corporation
- Exone Company
- SLM Solutions Group AG
- EOS GmbH
- Materialise NV
- Stratasys Ltd
- EnvisionTEC GmbH
Key Developments in Additive Manufacturing Industry Sector
- March 2023: Merz Dental partnered with Nexa 3D to expand the use of desktop 3D printing in dental applications across Germany.
- October 2022: GE Additive launched its new Series 3 binder jet platform for industrial-scale metal part production, having already manufactured over 140,000 components.
- July 2022: Toyota began producing and selling stock parts using HP Multi Jet Fusion 3D printing, optimizing designs and lead times.
Strategic Additive Manufacturing Industry Market Outlook
The Additive Manufacturing industry is poised for continued growth, driven by technological advancements, increasing demand for customization, and the expanding range of applications. Strategic opportunities exist in developing new materials, improving printing speeds, and expanding into new markets. Companies focusing on innovation, strategic partnerships, and efficient supply chain management are well-positioned to benefit from the industry's future growth potential. The market is expected to witness significant expansion across various sectors and geographic regions in the coming years.
Additive Manufacturing Industry Segmentation
-
1. Technology
- 1.1. Stereo Lithography
- 1.2. Fused Deposition Modelling
- 1.3. Laser Sintering
- 1.4. Binder Jetting Printing
- 1.5. Other Technologies
-
2. End User
- 2.1. Aerospace and Defense
- 2.2. Automotive
- 2.3. Healthcare
- 2.4. Industrial
- 2.5. Other End Users
-
3. Material
- 3.1. Plastic
- 3.2. Metals
- 3.3. Ceramics
Additive Manufacturing Industry Segmentation By Geography
-
1. North America
- 1.1. United States
- 1.2. Canada
-
2. Europe
- 2.1. United Kingdom
- 2.2. Germany
- 2.3. France
- 2.4. Rest of Europe
-
3. Asia Pacific
- 3.1. China
- 3.2. Japan
- 3.3. India
- 3.4. Rest of Asia Pacific
-
4. Latin America
- 4.1. Brazil
- 4.2. Mexico
- 4.3. Argentina
- 4.4. Rest of Latin America
- 5. Middle East
-
6. UAE
- 6.1. Saudi Arabia
- 6.2. Israel
- 6.3. South Africa
- 6.4. Rest of Middle East
Additive Manufacturing Industry REPORT HIGHLIGHTS
| Aspects | Details |
|---|---|
| Study Period | 2019-2033 |
| Base Year | 2024 |
| Estimated Year | 2025 |
| Forecast Period | 2025-2033 |
| Historical Period | 2019-2024 |
| Growth Rate | CAGR of 20.70% from 2019-2033 |
| Segmentation |
|
Table of Contents
- 1. Introduction
- 1.1. Research Scope
- 1.2. Market Segmentation
- 1.3. Research Methodology
- 1.4. Definitions and Assumptions
- 2. Executive Summary
- 2.1. Introduction
- 3. Market Dynamics
- 3.1. Introduction
- 3.2. Market Drivers
- 3.2.1. New and Improved Technologies to Drive Product Customization; Demand for Lightweight Construction in Automotive and Aerospace Industries
- 3.3. Market Restrains
- 3.3.1. Concerns over Intellectual Property Protection
- 3.4. Market Trends
- 3.4.1. Automotive to is expected Hold a Significant Share
- 4. Market Factor Analysis
- 4.1. Porters Five Forces
- 4.2. Supply/Value Chain
- 4.3. PESTEL analysis
- 4.4. Market Entropy
- 4.5. Patent/Trademark Analysis
- 5. Global Additive Manufacturing Industry Analysis, Insights and Forecast, 2019-2031
- 5.1. Market Analysis, Insights and Forecast - by Technology
- 5.1.1. Stereo Lithography
- 5.1.2. Fused Deposition Modelling
- 5.1.3. Laser Sintering
- 5.1.4. Binder Jetting Printing
- 5.1.5. Other Technologies
- 5.2. Market Analysis, Insights and Forecast - by End User
- 5.2.1. Aerospace and Defense
- 5.2.2. Automotive
- 5.2.3. Healthcare
- 5.2.4. Industrial
- 5.2.5. Other End Users
- 5.3. Market Analysis, Insights and Forecast - by Material
- 5.3.1. Plastic
- 5.3.2. Metals
- 5.3.3. Ceramics
- 5.4. Market Analysis, Insights and Forecast - by Region
- 5.4.1. North America
- 5.4.2. Europe
- 5.4.3. Asia Pacific
- 5.4.4. Latin America
- 5.4.5. Middle East
- 5.4.6. UAE
- 5.1. Market Analysis, Insights and Forecast - by Technology
- 6. North America Additive Manufacturing Industry Analysis, Insights and Forecast, 2019-2031
- 6.1. Market Analysis, Insights and Forecast - by Technology
- 6.1.1. Stereo Lithography
- 6.1.2. Fused Deposition Modelling
- 6.1.3. Laser Sintering
- 6.1.4. Binder Jetting Printing
- 6.1.5. Other Technologies
- 6.2. Market Analysis, Insights and Forecast - by End User
- 6.2.1. Aerospace and Defense
- 6.2.2. Automotive
- 6.2.3. Healthcare
- 6.2.4. Industrial
- 6.2.5. Other End Users
- 6.3. Market Analysis, Insights and Forecast - by Material
- 6.3.1. Plastic
- 6.3.2. Metals
- 6.3.3. Ceramics
- 6.1. Market Analysis, Insights and Forecast - by Technology
- 7. Europe Additive Manufacturing Industry Analysis, Insights and Forecast, 2019-2031
- 7.1. Market Analysis, Insights and Forecast - by Technology
- 7.1.1. Stereo Lithography
- 7.1.2. Fused Deposition Modelling
- 7.1.3. Laser Sintering
- 7.1.4. Binder Jetting Printing
- 7.1.5. Other Technologies
- 7.2. Market Analysis, Insights and Forecast - by End User
- 7.2.1. Aerospace and Defense
- 7.2.2. Automotive
- 7.2.3. Healthcare
- 7.2.4. Industrial
- 7.2.5. Other End Users
- 7.3. Market Analysis, Insights and Forecast - by Material
- 7.3.1. Plastic
- 7.3.2. Metals
- 7.3.3. Ceramics
- 7.1. Market Analysis, Insights and Forecast - by Technology
- 8. Asia Pacific Additive Manufacturing Industry Analysis, Insights and Forecast, 2019-2031
- 8.1. Market Analysis, Insights and Forecast - by Technology
- 8.1.1. Stereo Lithography
- 8.1.2. Fused Deposition Modelling
- 8.1.3. Laser Sintering
- 8.1.4. Binder Jetting Printing
- 8.1.5. Other Technologies
- 8.2. Market Analysis, Insights and Forecast - by End User
- 8.2.1. Aerospace and Defense
- 8.2.2. Automotive
- 8.2.3. Healthcare
- 8.2.4. Industrial
- 8.2.5. Other End Users
- 8.3. Market Analysis, Insights and Forecast - by Material
- 8.3.1. Plastic
- 8.3.2. Metals
- 8.3.3. Ceramics
- 8.1. Market Analysis, Insights and Forecast - by Technology
- 9. Latin America Additive Manufacturing Industry Analysis, Insights and Forecast, 2019-2031
- 9.1. Market Analysis, Insights and Forecast - by Technology
- 9.1.1. Stereo Lithography
- 9.1.2. Fused Deposition Modelling
- 9.1.3. Laser Sintering
- 9.1.4. Binder Jetting Printing
- 9.1.5. Other Technologies
- 9.2. Market Analysis, Insights and Forecast - by End User
- 9.2.1. Aerospace and Defense
- 9.2.2. Automotive
- 9.2.3. Healthcare
- 9.2.4. Industrial
- 9.2.5. Other End Users
- 9.3. Market Analysis, Insights and Forecast - by Material
- 9.3.1. Plastic
- 9.3.2. Metals
- 9.3.3. Ceramics
- 9.1. Market Analysis, Insights and Forecast - by Technology
- 10. Middle East Additive Manufacturing Industry Analysis, Insights and Forecast, 2019-2031
- 10.1. Market Analysis, Insights and Forecast - by Technology
- 10.1.1. Stereo Lithography
- 10.1.2. Fused Deposition Modelling
- 10.1.3. Laser Sintering
- 10.1.4. Binder Jetting Printing
- 10.1.5. Other Technologies
- 10.2. Market Analysis, Insights and Forecast - by End User
- 10.2.1. Aerospace and Defense
- 10.2.2. Automotive
- 10.2.3. Healthcare
- 10.2.4. Industrial
- 10.2.5. Other End Users
- 10.3. Market Analysis, Insights and Forecast - by Material
- 10.3.1. Plastic
- 10.3.2. Metals
- 10.3.3. Ceramics
- 10.1. Market Analysis, Insights and Forecast - by Technology
- 11. UAE Additive Manufacturing Industry Analysis, Insights and Forecast, 2019-2031
- 11.1. Market Analysis, Insights and Forecast - by Technology
- 11.1.1. Stereo Lithography
- 11.1.2. Fused Deposition Modelling
- 11.1.3. Laser Sintering
- 11.1.4. Binder Jetting Printing
- 11.1.5. Other Technologies
- 11.2. Market Analysis, Insights and Forecast - by End User
- 11.2.1. Aerospace and Defense
- 11.2.2. Automotive
- 11.2.3. Healthcare
- 11.2.4. Industrial
- 11.2.5. Other End Users
- 11.3. Market Analysis, Insights and Forecast - by Material
- 11.3.1. Plastic
- 11.3.2. Metals
- 11.3.3. Ceramics
- 11.1. Market Analysis, Insights and Forecast - by Technology
- 12. North America Additive Manufacturing Industry Analysis, Insights and Forecast, 2019-2031
- 12.1. Market Analysis, Insights and Forecast - By Country/Sub-region
- 12.1.1 United States
- 12.1.2 Canada
- 12.1.3 Mexico
- 13. Europe Additive Manufacturing Industry Analysis, Insights and Forecast, 2019-2031
- 13.1. Market Analysis, Insights and Forecast - By Country/Sub-region
- 13.1.1 Germany
- 13.1.2 United Kingdom
- 13.1.3 France
- 13.1.4 Spain
- 13.1.5 Italy
- 13.1.6 Spain
- 13.1.7 Belgium
- 13.1.8 Netherland
- 13.1.9 Nordics
- 13.1.10 Rest of Europe
- 14. Asia Pacific Additive Manufacturing Industry Analysis, Insights and Forecast, 2019-2031
- 14.1. Market Analysis, Insights and Forecast - By Country/Sub-region
- 14.1.1 China
- 14.1.2 Japan
- 14.1.3 India
- 14.1.4 South Korea
- 14.1.5 Southeast Asia
- 14.1.6 Australia
- 14.1.7 Indonesia
- 14.1.8 Phillipes
- 14.1.9 Singapore
- 14.1.10 Thailandc
- 14.1.11 Rest of Asia Pacific
- 15. South America Additive Manufacturing Industry Analysis, Insights and Forecast, 2019-2031
- 15.1. Market Analysis, Insights and Forecast - By Country/Sub-region
- 15.1.1 Brazil
- 15.1.2 Argentina
- 15.1.3 Peru
- 15.1.4 Chile
- 15.1.5 Colombia
- 15.1.6 Ecuador
- 15.1.7 Venezuela
- 15.1.8 Rest of South America
- 16. North America Additive Manufacturing Industry Analysis, Insights and Forecast, 2019-2031
- 16.1. Market Analysis, Insights and Forecast - By Country/Sub-region
- 16.1.1 United States
- 16.1.2 Canada
- 16.1.3 Mexico
- 17. MEA Additive Manufacturing Industry Analysis, Insights and Forecast, 2019-2031
- 17.1. Market Analysis, Insights and Forecast - By Country/Sub-region
- 17.1.1 United Arab Emirates
- 17.1.2 Saudi Arabia
- 17.1.3 South Africa
- 17.1.4 Rest of Middle East and Africa
- 18. Competitive Analysis
- 18.1. Global Market Share Analysis 2024
- 18.2. Company Profiles
- 18.2.1 Mcor Technologies Ltd
- 18.2.1.1. Overview
- 18.2.1.2. Products
- 18.2.1.3. SWOT Analysis
- 18.2.1.4. Recent Developments
- 18.2.1.5. Financials (Based on Availability)
- 18.2.2 General Electric Company (GE Additive)
- 18.2.2.1. Overview
- 18.2.2.2. Products
- 18.2.2.3. SWOT Analysis
- 18.2.2.4. Recent Developments
- 18.2.2.5. Financials (Based on Availability)
- 18.2.3 Optomec Inc
- 18.2.3.1. Overview
- 18.2.3.2. Products
- 18.2.3.3. SWOT Analysis
- 18.2.3.4. Recent Developments
- 18.2.3.5. Financials (Based on Availability)
- 18.2.4 3D Systems Corporation
- 18.2.4.1. Overview
- 18.2.4.2. Products
- 18.2.4.3. SWOT Analysis
- 18.2.4.4. Recent Developments
- 18.2.4.5. Financials (Based on Availability)
- 18.2.5 Exone Company
- 18.2.5.1. Overview
- 18.2.5.2. Products
- 18.2.5.3. SWOT Analysis
- 18.2.5.4. Recent Developments
- 18.2.5.5. Financials (Based on Availability)
- 18.2.6 SLM Solutions Group AG*List Not Exhaustive
- 18.2.6.1. Overview
- 18.2.6.2. Products
- 18.2.6.3. SWOT Analysis
- 18.2.6.4. Recent Developments
- 18.2.6.5. Financials (Based on Availability)
- 18.2.7 EOS GmbH
- 18.2.7.1. Overview
- 18.2.7.2. Products
- 18.2.7.3. SWOT Analysis
- 18.2.7.4. Recent Developments
- 18.2.7.5. Financials (Based on Availability)
- 18.2.8 Materialise NV
- 18.2.8.1. Overview
- 18.2.8.2. Products
- 18.2.8.3. SWOT Analysis
- 18.2.8.4. Recent Developments
- 18.2.8.5. Financials (Based on Availability)
- 18.2.9 Stratasys Ltd
- 18.2.9.1. Overview
- 18.2.9.2. Products
- 18.2.9.3. SWOT Analysis
- 18.2.9.4. Recent Developments
- 18.2.9.5. Financials (Based on Availability)
- 18.2.10 EnvisionTEC GmbH
- 18.2.10.1. Overview
- 18.2.10.2. Products
- 18.2.10.3. SWOT Analysis
- 18.2.10.4. Recent Developments
- 18.2.10.5. Financials (Based on Availability)
- 18.2.1 Mcor Technologies Ltd
List of Figures
- Figure 1: Global Additive Manufacturing Industry Revenue Breakdown (Million, %) by Region 2024 & 2032
- Figure 2: North America Additive Manufacturing Industry Revenue (Million), by Country 2024 & 2032
- Figure 3: North America Additive Manufacturing Industry Revenue Share (%), by Country 2024 & 2032
- Figure 4: Europe Additive Manufacturing Industry Revenue (Million), by Country 2024 & 2032
- Figure 5: Europe Additive Manufacturing Industry Revenue Share (%), by Country 2024 & 2032
- Figure 6: Asia Pacific Additive Manufacturing Industry Revenue (Million), by Country 2024 & 2032
- Figure 7: Asia Pacific Additive Manufacturing Industry Revenue Share (%), by Country 2024 & 2032
- Figure 8: South America Additive Manufacturing Industry Revenue (Million), by Country 2024 & 2032
- Figure 9: South America Additive Manufacturing Industry Revenue Share (%), by Country 2024 & 2032
- Figure 10: North America Additive Manufacturing Industry Revenue (Million), by Country 2024 & 2032
- Figure 11: North America Additive Manufacturing Industry Revenue Share (%), by Country 2024 & 2032
- Figure 12: MEA Additive Manufacturing Industry Revenue (Million), by Country 2024 & 2032
- Figure 13: MEA Additive Manufacturing Industry Revenue Share (%), by Country 2024 & 2032
- Figure 14: North America Additive Manufacturing Industry Revenue (Million), by Technology 2024 & 2032
- Figure 15: North America Additive Manufacturing Industry Revenue Share (%), by Technology 2024 & 2032
- Figure 16: North America Additive Manufacturing Industry Revenue (Million), by End User 2024 & 2032
- Figure 17: North America Additive Manufacturing Industry Revenue Share (%), by End User 2024 & 2032
- Figure 18: North America Additive Manufacturing Industry Revenue (Million), by Material 2024 & 2032
- Figure 19: North America Additive Manufacturing Industry Revenue Share (%), by Material 2024 & 2032
- Figure 20: North America Additive Manufacturing Industry Revenue (Million), by Country 2024 & 2032
- Figure 21: North America Additive Manufacturing Industry Revenue Share (%), by Country 2024 & 2032
- Figure 22: Europe Additive Manufacturing Industry Revenue (Million), by Technology 2024 & 2032
- Figure 23: Europe Additive Manufacturing Industry Revenue Share (%), by Technology 2024 & 2032
- Figure 24: Europe Additive Manufacturing Industry Revenue (Million), by End User 2024 & 2032
- Figure 25: Europe Additive Manufacturing Industry Revenue Share (%), by End User 2024 & 2032
- Figure 26: Europe Additive Manufacturing Industry Revenue (Million), by Material 2024 & 2032
- Figure 27: Europe Additive Manufacturing Industry Revenue Share (%), by Material 2024 & 2032
- Figure 28: Europe Additive Manufacturing Industry Revenue (Million), by Country 2024 & 2032
- Figure 29: Europe Additive Manufacturing Industry Revenue Share (%), by Country 2024 & 2032
- Figure 30: Asia Pacific Additive Manufacturing Industry Revenue (Million), by Technology 2024 & 2032
- Figure 31: Asia Pacific Additive Manufacturing Industry Revenue Share (%), by Technology 2024 & 2032
- Figure 32: Asia Pacific Additive Manufacturing Industry Revenue (Million), by End User 2024 & 2032
- Figure 33: Asia Pacific Additive Manufacturing Industry Revenue Share (%), by End User 2024 & 2032
- Figure 34: Asia Pacific Additive Manufacturing Industry Revenue (Million), by Material 2024 & 2032
- Figure 35: Asia Pacific Additive Manufacturing Industry Revenue Share (%), by Material 2024 & 2032
- Figure 36: Asia Pacific Additive Manufacturing Industry Revenue (Million), by Country 2024 & 2032
- Figure 37: Asia Pacific Additive Manufacturing Industry Revenue Share (%), by Country 2024 & 2032
- Figure 38: Latin America Additive Manufacturing Industry Revenue (Million), by Technology 2024 & 2032
- Figure 39: Latin America Additive Manufacturing Industry Revenue Share (%), by Technology 2024 & 2032
- Figure 40: Latin America Additive Manufacturing Industry Revenue (Million), by End User 2024 & 2032
- Figure 41: Latin America Additive Manufacturing Industry Revenue Share (%), by End User 2024 & 2032
- Figure 42: Latin America Additive Manufacturing Industry Revenue (Million), by Material 2024 & 2032
- Figure 43: Latin America Additive Manufacturing Industry Revenue Share (%), by Material 2024 & 2032
- Figure 44: Latin America Additive Manufacturing Industry Revenue (Million), by Country 2024 & 2032
- Figure 45: Latin America Additive Manufacturing Industry Revenue Share (%), by Country 2024 & 2032
- Figure 46: Middle East Additive Manufacturing Industry Revenue (Million), by Technology 2024 & 2032
- Figure 47: Middle East Additive Manufacturing Industry Revenue Share (%), by Technology 2024 & 2032
- Figure 48: Middle East Additive Manufacturing Industry Revenue (Million), by End User 2024 & 2032
- Figure 49: Middle East Additive Manufacturing Industry Revenue Share (%), by End User 2024 & 2032
- Figure 50: Middle East Additive Manufacturing Industry Revenue (Million), by Material 2024 & 2032
- Figure 51: Middle East Additive Manufacturing Industry Revenue Share (%), by Material 2024 & 2032
- Figure 52: Middle East Additive Manufacturing Industry Revenue (Million), by Country 2024 & 2032
- Figure 53: Middle East Additive Manufacturing Industry Revenue Share (%), by Country 2024 & 2032
- Figure 54: UAE Additive Manufacturing Industry Revenue (Million), by Technology 2024 & 2032
- Figure 55: UAE Additive Manufacturing Industry Revenue Share (%), by Technology 2024 & 2032
- Figure 56: UAE Additive Manufacturing Industry Revenue (Million), by End User 2024 & 2032
- Figure 57: UAE Additive Manufacturing Industry Revenue Share (%), by End User 2024 & 2032
- Figure 58: UAE Additive Manufacturing Industry Revenue (Million), by Material 2024 & 2032
- Figure 59: UAE Additive Manufacturing Industry Revenue Share (%), by Material 2024 & 2032
- Figure 60: UAE Additive Manufacturing Industry Revenue (Million), by Country 2024 & 2032
- Figure 61: UAE Additive Manufacturing Industry Revenue Share (%), by Country 2024 & 2032
List of Tables
- Table 1: Global Additive Manufacturing Industry Revenue Million Forecast, by Region 2019 & 2032
- Table 2: Global Additive Manufacturing Industry Revenue Million Forecast, by Technology 2019 & 2032
- Table 3: Global Additive Manufacturing Industry Revenue Million Forecast, by End User 2019 & 2032
- Table 4: Global Additive Manufacturing Industry Revenue Million Forecast, by Material 2019 & 2032
- Table 5: Global Additive Manufacturing Industry Revenue Million Forecast, by Region 2019 & 2032
- Table 6: Global Additive Manufacturing Industry Revenue Million Forecast, by Country 2019 & 2032
- Table 7: United States Additive Manufacturing Industry Revenue (Million) Forecast, by Application 2019 & 2032
- Table 8: Canada Additive Manufacturing Industry Revenue (Million) Forecast, by Application 2019 & 2032
- Table 9: Mexico Additive Manufacturing Industry Revenue (Million) Forecast, by Application 2019 & 2032
- Table 10: Global Additive Manufacturing Industry Revenue Million Forecast, by Country 2019 & 2032
- Table 11: Germany Additive Manufacturing Industry Revenue (Million) Forecast, by Application 2019 & 2032
- Table 12: United Kingdom Additive Manufacturing Industry Revenue (Million) Forecast, by Application 2019 & 2032
- Table 13: France Additive Manufacturing Industry Revenue (Million) Forecast, by Application 2019 & 2032
- Table 14: Spain Additive Manufacturing Industry Revenue (Million) Forecast, by Application 2019 & 2032
- Table 15: Italy Additive Manufacturing Industry Revenue (Million) Forecast, by Application 2019 & 2032
- Table 16: Spain Additive Manufacturing Industry Revenue (Million) Forecast, by Application 2019 & 2032
- Table 17: Belgium Additive Manufacturing Industry Revenue (Million) Forecast, by Application 2019 & 2032
- Table 18: Netherland Additive Manufacturing Industry Revenue (Million) Forecast, by Application 2019 & 2032
- Table 19: Nordics Additive Manufacturing Industry Revenue (Million) Forecast, by Application 2019 & 2032
- Table 20: Rest of Europe Additive Manufacturing Industry Revenue (Million) Forecast, by Application 2019 & 2032
- Table 21: Global Additive Manufacturing Industry Revenue Million Forecast, by Country 2019 & 2032
- Table 22: China Additive Manufacturing Industry Revenue (Million) Forecast, by Application 2019 & 2032
- Table 23: Japan Additive Manufacturing Industry Revenue (Million) Forecast, by Application 2019 & 2032
- Table 24: India Additive Manufacturing Industry Revenue (Million) Forecast, by Application 2019 & 2032
- Table 25: South Korea Additive Manufacturing Industry Revenue (Million) Forecast, by Application 2019 & 2032
- Table 26: Southeast Asia Additive Manufacturing Industry Revenue (Million) Forecast, by Application 2019 & 2032
- Table 27: Australia Additive Manufacturing Industry Revenue (Million) Forecast, by Application 2019 & 2032
- Table 28: Indonesia Additive Manufacturing Industry Revenue (Million) Forecast, by Application 2019 & 2032
- Table 29: Phillipes Additive Manufacturing Industry Revenue (Million) Forecast, by Application 2019 & 2032
- Table 30: Singapore Additive Manufacturing Industry Revenue (Million) Forecast, by Application 2019 & 2032
- Table 31: Thailandc Additive Manufacturing Industry Revenue (Million) Forecast, by Application 2019 & 2032
- Table 32: Rest of Asia Pacific Additive Manufacturing Industry Revenue (Million) Forecast, by Application 2019 & 2032
- Table 33: Global Additive Manufacturing Industry Revenue Million Forecast, by Country 2019 & 2032
- Table 34: Brazil Additive Manufacturing Industry Revenue (Million) Forecast, by Application 2019 & 2032
- Table 35: Argentina Additive Manufacturing Industry Revenue (Million) Forecast, by Application 2019 & 2032
- Table 36: Peru Additive Manufacturing Industry Revenue (Million) Forecast, by Application 2019 & 2032
- Table 37: Chile Additive Manufacturing Industry Revenue (Million) Forecast, by Application 2019 & 2032
- Table 38: Colombia Additive Manufacturing Industry Revenue (Million) Forecast, by Application 2019 & 2032
- Table 39: Ecuador Additive Manufacturing Industry Revenue (Million) Forecast, by Application 2019 & 2032
- Table 40: Venezuela Additive Manufacturing Industry Revenue (Million) Forecast, by Application 2019 & 2032
- Table 41: Rest of South America Additive Manufacturing Industry Revenue (Million) Forecast, by Application 2019 & 2032
- Table 42: Global Additive Manufacturing Industry Revenue Million Forecast, by Country 2019 & 2032
- Table 43: United States Additive Manufacturing Industry Revenue (Million) Forecast, by Application 2019 & 2032
- Table 44: Canada Additive Manufacturing Industry Revenue (Million) Forecast, by Application 2019 & 2032
- Table 45: Mexico Additive Manufacturing Industry Revenue (Million) Forecast, by Application 2019 & 2032
- Table 46: Global Additive Manufacturing Industry Revenue Million Forecast, by Country 2019 & 2032
- Table 47: United Arab Emirates Additive Manufacturing Industry Revenue (Million) Forecast, by Application 2019 & 2032
- Table 48: Saudi Arabia Additive Manufacturing Industry Revenue (Million) Forecast, by Application 2019 & 2032
- Table 49: South Africa Additive Manufacturing Industry Revenue (Million) Forecast, by Application 2019 & 2032
- Table 50: Rest of Middle East and Africa Additive Manufacturing Industry Revenue (Million) Forecast, by Application 2019 & 2032
- Table 51: Global Additive Manufacturing Industry Revenue Million Forecast, by Technology 2019 & 2032
- Table 52: Global Additive Manufacturing Industry Revenue Million Forecast, by End User 2019 & 2032
- Table 53: Global Additive Manufacturing Industry Revenue Million Forecast, by Material 2019 & 2032
- Table 54: Global Additive Manufacturing Industry Revenue Million Forecast, by Country 2019 & 2032
- Table 55: United States Additive Manufacturing Industry Revenue (Million) Forecast, by Application 2019 & 2032
- Table 56: Canada Additive Manufacturing Industry Revenue (Million) Forecast, by Application 2019 & 2032
- Table 57: Global Additive Manufacturing Industry Revenue Million Forecast, by Technology 2019 & 2032
- Table 58: Global Additive Manufacturing Industry Revenue Million Forecast, by End User 2019 & 2032
- Table 59: Global Additive Manufacturing Industry Revenue Million Forecast, by Material 2019 & 2032
- Table 60: Global Additive Manufacturing Industry Revenue Million Forecast, by Country 2019 & 2032
- Table 61: United Kingdom Additive Manufacturing Industry Revenue (Million) Forecast, by Application 2019 & 2032
- Table 62: Germany Additive Manufacturing Industry Revenue (Million) Forecast, by Application 2019 & 2032
- Table 63: France Additive Manufacturing Industry Revenue (Million) Forecast, by Application 2019 & 2032
- Table 64: Rest of Europe Additive Manufacturing Industry Revenue (Million) Forecast, by Application 2019 & 2032
- Table 65: Global Additive Manufacturing Industry Revenue Million Forecast, by Technology 2019 & 2032
- Table 66: Global Additive Manufacturing Industry Revenue Million Forecast, by End User 2019 & 2032
- Table 67: Global Additive Manufacturing Industry Revenue Million Forecast, by Material 2019 & 2032
- Table 68: Global Additive Manufacturing Industry Revenue Million Forecast, by Country 2019 & 2032
- Table 69: China Additive Manufacturing Industry Revenue (Million) Forecast, by Application 2019 & 2032
- Table 70: Japan Additive Manufacturing Industry Revenue (Million) Forecast, by Application 2019 & 2032
- Table 71: India Additive Manufacturing Industry Revenue (Million) Forecast, by Application 2019 & 2032
- Table 72: Rest of Asia Pacific Additive Manufacturing Industry Revenue (Million) Forecast, by Application 2019 & 2032
- Table 73: Global Additive Manufacturing Industry Revenue Million Forecast, by Technology 2019 & 2032
- Table 74: Global Additive Manufacturing Industry Revenue Million Forecast, by End User 2019 & 2032
- Table 75: Global Additive Manufacturing Industry Revenue Million Forecast, by Material 2019 & 2032
- Table 76: Global Additive Manufacturing Industry Revenue Million Forecast, by Country 2019 & 2032
- Table 77: Brazil Additive Manufacturing Industry Revenue (Million) Forecast, by Application 2019 & 2032
- Table 78: Mexico Additive Manufacturing Industry Revenue (Million) Forecast, by Application 2019 & 2032
- Table 79: Argentina Additive Manufacturing Industry Revenue (Million) Forecast, by Application 2019 & 2032
- Table 80: Rest of Latin America Additive Manufacturing Industry Revenue (Million) Forecast, by Application 2019 & 2032
- Table 81: Global Additive Manufacturing Industry Revenue Million Forecast, by Technology 2019 & 2032
- Table 82: Global Additive Manufacturing Industry Revenue Million Forecast, by End User 2019 & 2032
- Table 83: Global Additive Manufacturing Industry Revenue Million Forecast, by Material 2019 & 2032
- Table 84: Global Additive Manufacturing Industry Revenue Million Forecast, by Country 2019 & 2032
- Table 85: Global Additive Manufacturing Industry Revenue Million Forecast, by Technology 2019 & 2032
- Table 86: Global Additive Manufacturing Industry Revenue Million Forecast, by End User 2019 & 2032
- Table 87: Global Additive Manufacturing Industry Revenue Million Forecast, by Material 2019 & 2032
- Table 88: Global Additive Manufacturing Industry Revenue Million Forecast, by Country 2019 & 2032
- Table 89: Saudi Arabia Additive Manufacturing Industry Revenue (Million) Forecast, by Application 2019 & 2032
- Table 90: Israel Additive Manufacturing Industry Revenue (Million) Forecast, by Application 2019 & 2032
- Table 91: South Africa Additive Manufacturing Industry Revenue (Million) Forecast, by Application 2019 & 2032
- Table 92: Rest of Middle East Additive Manufacturing Industry Revenue (Million) Forecast, by Application 2019 & 2032
Frequently Asked Questions
1. What is the projected Compound Annual Growth Rate (CAGR) of the Additive Manufacturing Industry?
The projected CAGR is approximately 20.70%.
2. Which companies are prominent players in the Additive Manufacturing Industry?
Key companies in the market include Mcor Technologies Ltd, General Electric Company (GE Additive), Optomec Inc, 3D Systems Corporation, Exone Company, SLM Solutions Group AG*List Not Exhaustive, EOS GmbH, Materialise NV, Stratasys Ltd, EnvisionTEC GmbH.
3. What are the main segments of the Additive Manufacturing Industry?
The market segments include Technology, End User, Material.
4. Can you provide details about the market size?
The market size is estimated to be USD 78.93 Million as of 2022.
5. What are some drivers contributing to market growth?
New and Improved Technologies to Drive Product Customization; Demand for Lightweight Construction in Automotive and Aerospace Industries.
6. What are the notable trends driving market growth?
Automotive to is expected Hold a Significant Share.
7. Are there any restraints impacting market growth?
Concerns over Intellectual Property Protection.
8. Can you provide examples of recent developments in the market?
March 2023 - Merz Dental, a digital dentistry company, partnered with Nexa 3D, the polymer 3D printing leader. The partnership will support the consumers of Nexa 3D throughout Germany. The 3D printing platform is fast and accurate to increase professional and dental desktop 3D printing use. The desktop 3D printer serves a wide variety of engineering and dental applications, including orthodontic models, splints, and surgical guides
9. What pricing options are available for accessing the report?
Pricing options include single-user, multi-user, and enterprise licenses priced at USD 4750, USD 5250, and USD 8750 respectively.
10. Is the market size provided in terms of value or volume?
The market size is provided in terms of value, measured in Million.
11. Are there any specific market keywords associated with the report?
Yes, the market keyword associated with the report is "Additive Manufacturing Industry," which aids in identifying and referencing the specific market segment covered.
12. How do I determine which pricing option suits my needs best?
The pricing options vary based on user requirements and access needs. Individual users may opt for single-user licenses, while businesses requiring broader access may choose multi-user or enterprise licenses for cost-effective access to the report.
13. Are there any additional resources or data provided in the Additive Manufacturing Industry report?
While the report offers comprehensive insights, it's advisable to review the specific contents or supplementary materials provided to ascertain if additional resources or data are available.
14. How can I stay updated on further developments or reports in the Additive Manufacturing Industry?
To stay informed about further developments, trends, and reports in the Additive Manufacturing Industry, consider subscribing to industry newsletters, following relevant companies and organizations, or regularly checking reputable industry news sources and publications.
Methodology
Step 1 - Identification of Relevant Samples Size from Population Database


Step 2 - Approaches for Defining Global Market Size (Value, Volume* & Price*)

Note*: In applicable scenarios
Step 3 - Data Sources
Primary Research
- Web Analytics
- Survey Reports
- Research Institute
- Latest Research Reports
- Opinion Leaders
Secondary Research
- Annual Reports
- White Paper
- Latest Press Release
- Industry Association
- Paid Database
- Investor Presentations

Step 4 - Data Triangulation
Involves using different sources of information in order to increase the validity of a study
These sources are likely to be stakeholders in a program - participants, other researchers, program staff, other community members, and so on.
Then we put all data in single framework & apply various statistical tools to find out the dynamic on the market.
During the analysis stage, feedback from the stakeholder groups would be compared to determine areas of agreement as well as areas of divergence


