
Key Insights
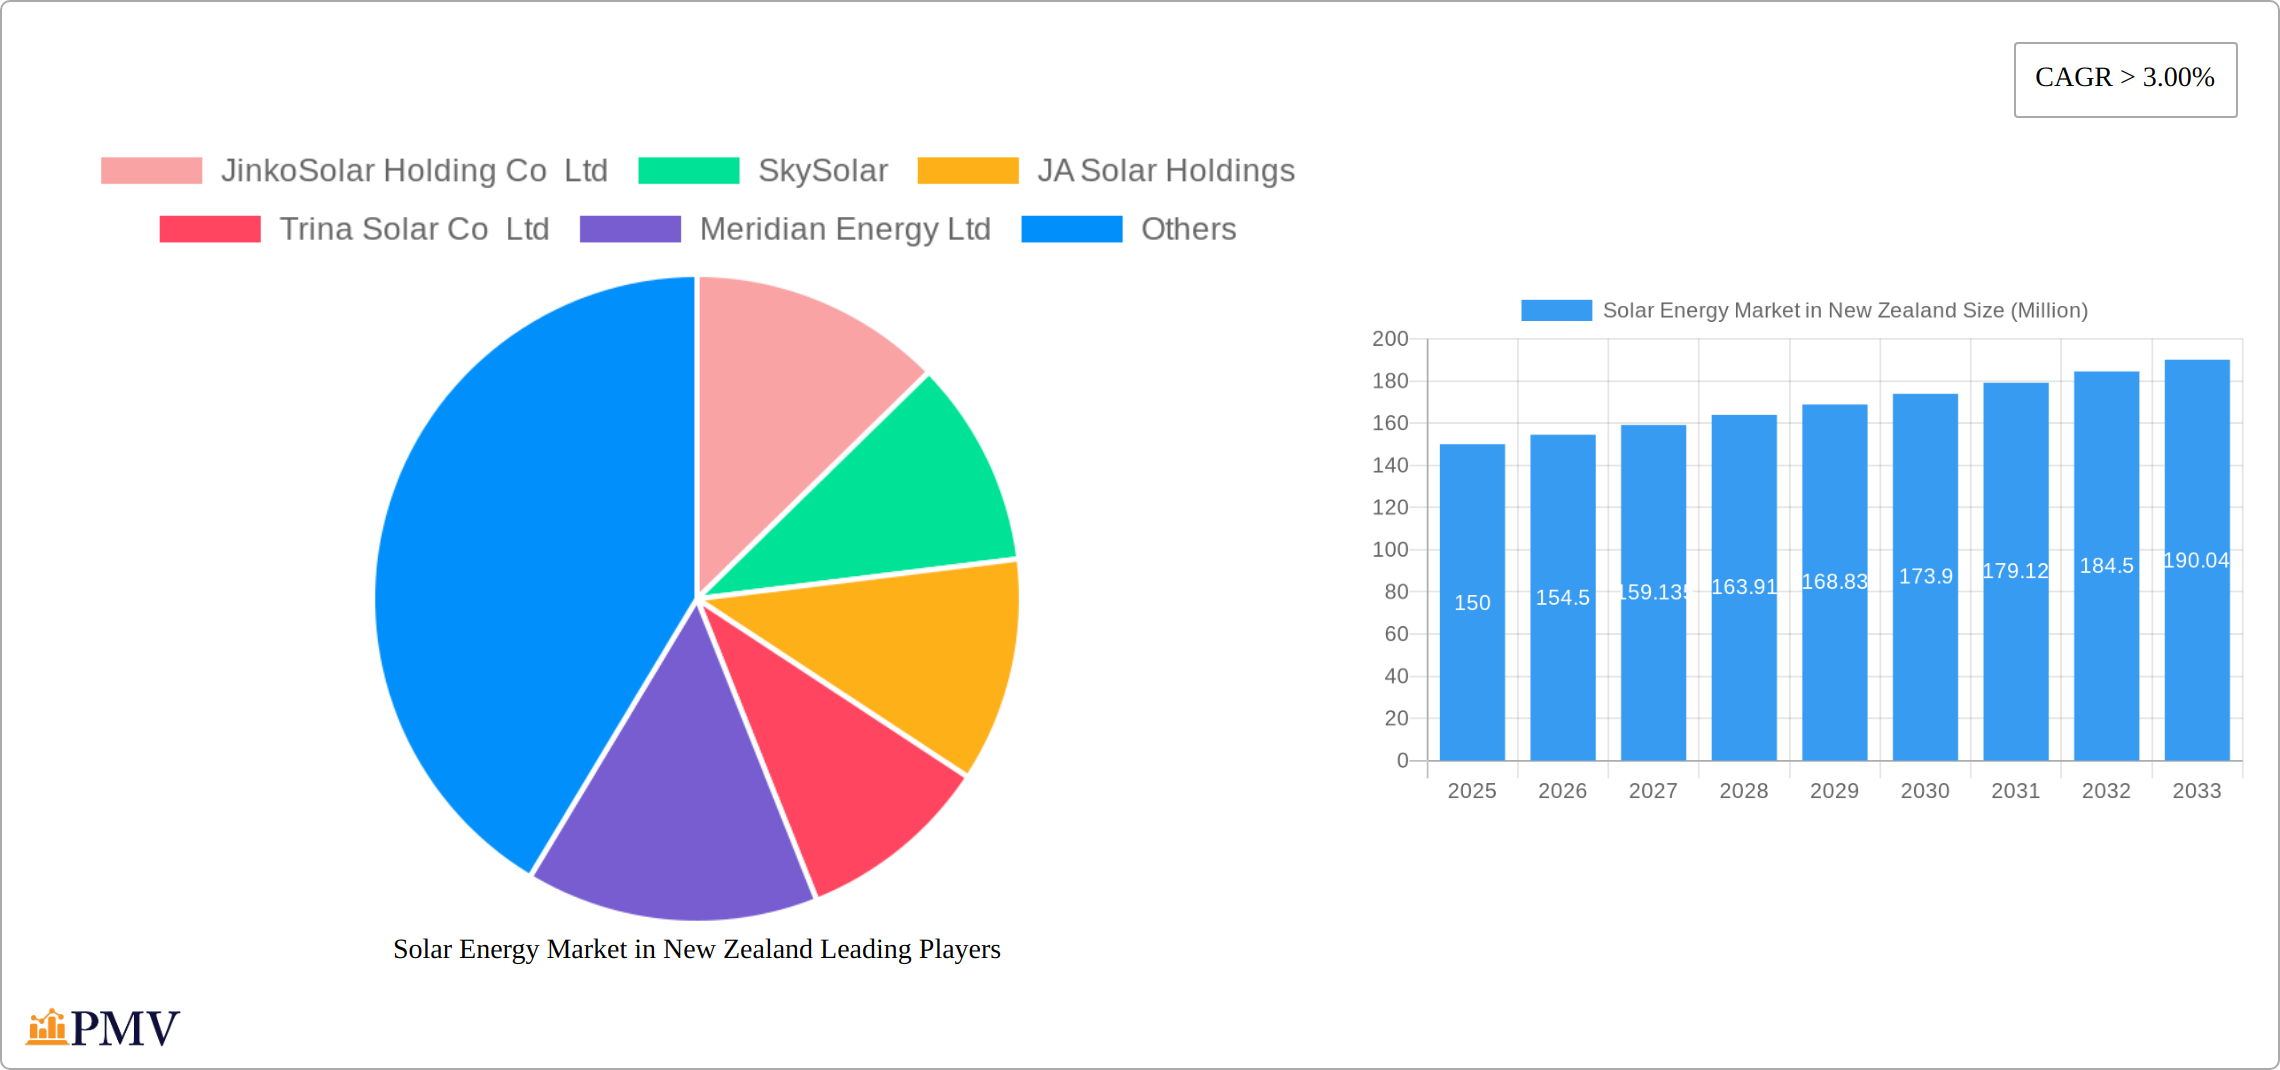
The New Zealand solar energy market is experiencing robust growth, driven by increasing electricity prices, government incentives promoting renewable energy adoption, and rising environmental awareness among consumers and businesses. The market, estimated at approximately $150 million USD in 2025, is projected to maintain a Compound Annual Growth Rate (CAGR) exceeding 3% through 2033. This growth is fueled by strong demand across residential, commercial and industrial (C&I), and utility sectors. Residential installations are leading the charge, boosted by decreasing solar panel costs and readily available financing options. The C&I sector is also experiencing significant expansion, with businesses increasingly investing in solar solutions to reduce operational costs and enhance their sustainability profiles. Government policies, including feed-in tariffs and tax breaks, are crucial in incentivizing solar adoption across all segments. While supply chain challenges and intermittent weather patterns represent some constraints, the overall outlook for the New Zealand solar energy market remains overwhelmingly positive. The presence of established players like JinkoSolar, JA Solar, and Trina Solar, alongside local companies like Meridian Energy and Sunergise International, indicates a competitive and dynamic market landscape.
The continued growth trajectory is expected to be shaped by technological advancements leading to improved efficiency and reduced costs of solar panels. Further government support and consumer awareness campaigns focused on long-term cost savings and environmental benefits will continue to drive market expansion. While competition among solar energy companies is intensifying, the overall market potential remains significant, suggesting promising opportunities for both existing and new players to capitalize on the increasing demand for renewable energy solutions in New Zealand. The diverse range of applications across residential, commercial, and utility sectors indicates a strong foundation for sustained and substantial growth in the coming years.
Solar Energy Market in New Zealand: A Comprehensive Report (2019-2033)
This in-depth report provides a comprehensive analysis of the New Zealand solar energy market, encompassing historical data (2019-2024), current estimates (2025), and future projections (2025-2033). The study covers key market segments, leading players, technological advancements, and emerging trends, offering valuable insights for investors, industry participants, and policymakers.
Keywords: New Zealand solar energy market, solar PV, renewable energy, residential solar, commercial solar, utility-scale solar, solar power, market size, market share, CAGR, industry trends, market analysis, New Zealand energy market, solar panel, solar installation, JinkoSolar, SkySolar, JA Solar, Trina Solar, Meridian Energy, New Zealand Solar Power, Sunergise, Lodestone Energy, ZEN Energy Systems, Aquila Capital, Lightsource BP, Contact Energy, Far North Solar Farm.
Solar Energy Market in New Zealand Market Structure & Competitive Dynamics
The New Zealand solar energy market showcases a moderately concentrated structure with several key players dominating distinct segments. This dynamic competitive landscape is fueled by continuous technological advancements and robust government support for renewable energy initiatives. While the regulatory framework is generally supportive, certain complexities remain. The primary source of product substitution stems from other renewable energy sources such as wind and hydro power. End-user trends reveal a significant shift towards renewable energy adoption, particularly within the residential and commercial sectors, driven by escalating electricity costs and growing environmental concerns. This transition is further accelerated by increasing consumer awareness of the long-term cost savings and environmental benefits associated with solar energy.
Leading companies like JinkoSolar Holding Co Ltd, Trina Solar Co Ltd, and JA Solar Holdings are anticipated to maintain substantial market share throughout the forecast period. However, smaller, specialized companies are steadily gaining traction by offering innovative solutions and tailored services to meet the specific needs of diverse customer segments. Mergers and acquisitions (M&A) activity is experiencing consistent growth, with recent transactions reflecting significant investments in large-scale solar projects. For instance, the xx Million USD investment by Aquila Capital in the Far North Solar Farm highlights the burgeoning interest of foreign investors in the New Zealand market. The cumulative value of M&A deals within the sector from 2019-2024 is estimated at xx Million USD, with projections indicating a rise to xx Million USD during the subsequent forecast period. This increased investment signifies a strong belief in the future growth and profitability of the New Zealand solar energy market.
Solar Energy Market in New Zealand Industry Trends & Insights
The New Zealand solar energy market is experiencing robust and sustained growth, propelled by a confluence of factors. The increasing emphasis on carbon emission reduction, coupled with the persistent rise in electricity prices, is significantly bolstering demand for solar energy solutions. Government incentives, including feed-in tariffs and tax breaks, play a crucial role in stimulating market expansion. Simultaneously, technological advancements in solar panel efficiency and energy storage technologies are making solar power increasingly cost-competitive with traditional energy sources. Consumer preferences are progressively shifting towards sustainable and environmentally friendly energy options, thereby accelerating the adoption of solar energy across both residential and commercial sectors. The market is projected to exhibit a Compound Annual Growth Rate (CAGR) of xx% throughout the forecast period (2025-2033), with market penetration anticipated to reach approximately xx% by 2033. The competitive landscape is becoming increasingly intense, with companies continuously striving to introduce innovative and cost-effective solutions to secure a larger market share. This competitive pressure is fostering innovation and driving down the overall cost of solar energy, making it increasingly accessible to a wider range of consumers.
Dominant Markets & Segments in Solar Energy Market in New Zealand
The residential sector currently holds the dominant position in the New Zealand solar energy market, driven by heightened awareness of environmental benefits and the availability of government incentives. However, the commercial and industrial (C&I) segment is poised for the most rapid growth throughout the forecast period.
- Residential: Key drivers include government subsidies, decreasing installation costs, and the escalating cost of electricity tariffs. The increasing affordability and accessibility of solar energy systems are also contributing to the sector's growth.
- Commercial & Industrial (C&I): This segment's growth is fueled by the potential for substantial cost savings on energy bills and the growing importance of corporate sustainability initiatives. Businesses are increasingly recognizing the financial and environmental benefits of adopting solar energy.
- Utility: This sector is witnessing significant investment in large-scale solar farms, supported by government policies promoting renewable energy and the active participation of major energy companies such as Meridian Energy Ltd. These large-scale projects contribute significantly to the national energy supply and reduce reliance on fossil fuels.
The North Island currently leads in solar energy adoption, benefiting from higher solar irradiance levels and a denser concentration of population and businesses. Nevertheless, the South Island is projected to experience substantial growth in the coming years, driven by escalating investments in large-scale solar projects and expanding government support for renewable energy in the region.
Solar Energy Market in New Zealand Product Innovations
Recent product innovations focus on improving solar panel efficiency, reducing installation costs, and enhancing energy storage capabilities. Advanced solar panel technologies, such as bifacial panels and Perovskite solar cells, are gaining traction, promising significant improvements in energy generation. The development of more efficient and affordable battery storage systems is also crucial for expanding the adoption of solar energy, particularly in residential and off-grid applications. These innovations are crucial for enhancing the competitiveness of solar energy compared to traditional energy sources and increasing its market fit in diverse applications.
Report Segmentation & Scope
This report segments the New Zealand solar energy market by end-user:
Residential: This segment encompasses solar installations in private homes and apartments. Growth is anticipated to remain steady, driven by rising consumer awareness and ongoing government incentives. Competition within this segment remains high, with numerous installers vying for market share. The market size in 2025 is estimated at xx Million USD.
Commercial & Industrial (C&I): This segment includes solar installations in businesses, factories, and other commercial buildings. It is expected to demonstrate robust growth due to the potential for significant cost savings and the increasing prioritization of corporate sustainability goals. The market size in 2025 is estimated at xx Million USD.
Utility-scale: This segment focuses on large-scale solar farms that supply electricity to the national grid. Significant growth is projected, bolstered by supportive government policies and substantial investments from both domestic and international players. The market size in 2025 is estimated at xx Million USD.
Key Drivers of Solar Energy Market in New Zealand Growth
Several factors are driving the growth of the New Zealand solar energy market:
- Government Support: Incentives and policies promoting renewable energy are significantly boosting adoption.
- Falling Costs: Technological advancements have made solar energy more affordable, increasing its appeal to consumers and businesses.
- Environmental Concerns: Growing awareness of climate change is pushing consumers and businesses towards sustainable energy solutions.
- Energy Security: Diversifying energy sources enhances energy security and reduces reliance on fossil fuels.
Challenges in the Solar Energy Market in New Zealand Sector
Despite the generally positive outlook, the New Zealand solar energy market faces certain challenges:
- Intermittency: Solar energy's intermittent nature necessitates the development and implementation of effective energy storage solutions to ensure a reliable and consistent energy supply. This requires further investment in battery technology and grid management strategies.
- Grid Integration: Integrating large-scale solar farms into the existing electricity grid can present complex technical challenges, requiring careful planning and investment in grid infrastructure upgrades.
- Land Availability: Securing suitable land for large-scale solar projects can be a limiting factor, particularly in densely populated areas. Careful consideration of land use and environmental impact is crucial.
- High Initial Investment Costs: The substantial upfront costs associated with solar installations can pose a barrier to entry for some consumers and businesses. Government incentives and financing options can help mitigate this challenge.
Leading Players in the Solar Energy Market in New Zealand Market
- JinkoSolar Holding Co Ltd
- SkySolar
- JA Solar Holdings
- Trina Solar Co Ltd
- Meridian Energy Ltd
- New Zealand Solar Power Ltd
- Sunergise International Limited
- Lodestone Energy Ltd
- ZEN Energy Systems New Zealand Limited
Key Developments in Solar Energy Market in New Zealand Sector
- May 2022: Far North Solar Farm (FNSF) partnered with Aquila Capital to develop a 1 GW portfolio of large-scale solar PV projects across New Zealand, signifying substantial investment in the utility-scale solar segment.
- April 2022: Contact Energy and Lightsource BP partnered to co-develop grid-scale solar farms, highlighting the increasing collaboration between energy companies and international investors in the New Zealand solar market.
Strategic Solar Energy Market in New Zealand Market Outlook
The future of the New Zealand solar energy market looks promising. Continued government support, falling technology costs, and increasing consumer awareness will drive significant growth over the next decade. Strategic opportunities exist in large-scale solar farm development, innovative energy storage solutions, and the integration of solar power into smart grids. The market is poised to become a significant contributor to New Zealand's renewable energy transition, offering substantial economic and environmental benefits.
Solar Energy Market in New Zealand Segmentation
-
1. End-User
- 1.1. Residential
- 1.2. Commercial and Industrial (C&I)
- 1.3. Utility
Solar Energy Market in New Zealand Segmentation By Geography
-
1. North America
- 1.1. United States
- 1.2. Canada
- 1.3. Mexico
-
2. South America
- 2.1. Brazil
- 2.2. Argentina
- 2.3. Rest of South America
-
3. Europe
- 3.1. United Kingdom
- 3.2. Germany
- 3.3. France
- 3.4. Italy
- 3.5. Spain
- 3.6. Russia
- 3.7. Benelux
- 3.8. Nordics
- 3.9. Rest of Europe
-
4. Middle East & Africa
- 4.1. Turkey
- 4.2. Israel
- 4.3. GCC
- 4.4. North Africa
- 4.5. South Africa
- 4.6. Rest of Middle East & Africa
-
5. Asia Pacific
- 5.1. China
- 5.2. India
- 5.3. Japan
- 5.4. South Korea
- 5.5. ASEAN
- 5.6. Oceania
- 5.7. Rest of Asia Pacific

Solar Energy Market in New Zealand REPORT HIGHLIGHTS
| Aspects | Details |
|---|---|
| Study Period | 2019-2033 |
| Base Year | 2024 |
| Estimated Year | 2025 |
| Forecast Period | 2025-2033 |
| Historical Period | 2019-2024 |
| Growth Rate | CAGR of > 3.00% from 2019-2033 |
| Segmentation |
|
Table of Contents
- 1. Introduction
- 1.1. Research Scope
- 1.2. Market Segmentation
- 1.3. Research Methodology
- 1.4. Definitions and Assumptions
- 2. Executive Summary
- 2.1. Introduction
- 3. Market Dynamics
- 3.1. Introduction
- 3.2. Market Drivers
- 3.2.1. 4.; Increasing Energy Demand4.; Upcoming and Ongoing Projects of Power Plants
- 3.3. Market Restrains
- 3.3.1. 4.; Complexity and Expensive Nature of Coal-fired and Natural-gas-fired Power Plants
- 3.4. Market Trends
- 3.4.1. Utility Sector to Witness a Significant Growth
- 4. Market Factor Analysis
- 4.1. Porters Five Forces
- 4.2. Supply/Value Chain
- 4.3. PESTEL analysis
- 4.4. Market Entropy
- 4.5. Patent/Trademark Analysis
- 5. Global Solar Energy Market in New Zealand Analysis, Insights and Forecast, 2019-2031
- 5.1. Market Analysis, Insights and Forecast - by End-User
- 5.1.1. Residential
- 5.1.2. Commercial and Industrial (C&I)
- 5.1.3. Utility
- 5.2. Market Analysis, Insights and Forecast - by Region
- 5.2.1. North America
- 5.2.2. South America
- 5.2.3. Europe
- 5.2.4. Middle East & Africa
- 5.2.5. Asia Pacific
- 5.1. Market Analysis, Insights and Forecast - by End-User
- 6. North America Solar Energy Market in New Zealand Analysis, Insights and Forecast, 2019-2031
- 6.1. Market Analysis, Insights and Forecast - by End-User
- 6.1.1. Residential
- 6.1.2. Commercial and Industrial (C&I)
- 6.1.3. Utility
- 6.1. Market Analysis, Insights and Forecast - by End-User
- 7. South America Solar Energy Market in New Zealand Analysis, Insights and Forecast, 2019-2031
- 7.1. Market Analysis, Insights and Forecast - by End-User
- 7.1.1. Residential
- 7.1.2. Commercial and Industrial (C&I)
- 7.1.3. Utility
- 7.1. Market Analysis, Insights and Forecast - by End-User
- 8. Europe Solar Energy Market in New Zealand Analysis, Insights and Forecast, 2019-2031
- 8.1. Market Analysis, Insights and Forecast - by End-User
- 8.1.1. Residential
- 8.1.2. Commercial and Industrial (C&I)
- 8.1.3. Utility
- 8.1. Market Analysis, Insights and Forecast - by End-User
- 9. Middle East & Africa Solar Energy Market in New Zealand Analysis, Insights and Forecast, 2019-2031
- 9.1. Market Analysis, Insights and Forecast - by End-User
- 9.1.1. Residential
- 9.1.2. Commercial and Industrial (C&I)
- 9.1.3. Utility
- 9.1. Market Analysis, Insights and Forecast - by End-User
- 10. Asia Pacific Solar Energy Market in New Zealand Analysis, Insights and Forecast, 2019-2031
- 10.1. Market Analysis, Insights and Forecast - by End-User
- 10.1.1. Residential
- 10.1.2. Commercial and Industrial (C&I)
- 10.1.3. Utility
- 10.1. Market Analysis, Insights and Forecast - by End-User
- 11. Competitive Analysis
- 11.1. Global Market Share Analysis 2024
- 11.2. Company Profiles
- 11.2.1 JinkoSolar Holding Co Ltd
- 11.2.1.1. Overview
- 11.2.1.2. Products
- 11.2.1.3. SWOT Analysis
- 11.2.1.4. Recent Developments
- 11.2.1.5. Financials (Based on Availability)
- 11.2.2 SkySolar
- 11.2.2.1. Overview
- 11.2.2.2. Products
- 11.2.2.3. SWOT Analysis
- 11.2.2.4. Recent Developments
- 11.2.2.5. Financials (Based on Availability)
- 11.2.3 JA Solar Holdings
- 11.2.3.1. Overview
- 11.2.3.2. Products
- 11.2.3.3. SWOT Analysis
- 11.2.3.4. Recent Developments
- 11.2.3.5. Financials (Based on Availability)
- 11.2.4 Trina Solar Co Ltd
- 11.2.4.1. Overview
- 11.2.4.2. Products
- 11.2.4.3. SWOT Analysis
- 11.2.4.4. Recent Developments
- 11.2.4.5. Financials (Based on Availability)
- 11.2.5 Meridian Energy Ltd
- 11.2.5.1. Overview
- 11.2.5.2. Products
- 11.2.5.3. SWOT Analysis
- 11.2.5.4. Recent Developments
- 11.2.5.5. Financials (Based on Availability)
- 11.2.6 New Zealand Solar Power Ltd
- 11.2.6.1. Overview
- 11.2.6.2. Products
- 11.2.6.3. SWOT Analysis
- 11.2.6.4. Recent Developments
- 11.2.6.5. Financials (Based on Availability)
- 11.2.7 Sunergise International Limited
- 11.2.7.1. Overview
- 11.2.7.2. Products
- 11.2.7.3. SWOT Analysis
- 11.2.7.4. Recent Developments
- 11.2.7.5. Financials (Based on Availability)
- 11.2.8 Lodestone Energy Ltd
- 11.2.8.1. Overview
- 11.2.8.2. Products
- 11.2.8.3. SWOT Analysis
- 11.2.8.4. Recent Developments
- 11.2.8.5. Financials (Based on Availability)
- 11.2.9 ZEN Energy Systems New Zealand Limited
- 11.2.9.1. Overview
- 11.2.9.2. Products
- 11.2.9.3. SWOT Analysis
- 11.2.9.4. Recent Developments
- 11.2.9.5. Financials (Based on Availability)
- 11.2.1 JinkoSolar Holding Co Ltd
List of Figures
- Figure 1: Global Solar Energy Market in New Zealand Revenue Breakdown (Million, %) by Region 2024 & 2032
- Figure 2: Global Solar Energy Market in New Zealand Volume Breakdown (Gigawatt, %) by Region 2024 & 2032
- Figure 3: New Zealand Solar Energy Market in New Zealand Revenue (Million), by Country 2024 & 2032
- Figure 4: New Zealand Solar Energy Market in New Zealand Volume (Gigawatt), by Country 2024 & 2032
- Figure 5: New Zealand Solar Energy Market in New Zealand Revenue Share (%), by Country 2024 & 2032
- Figure 6: New Zealand Solar Energy Market in New Zealand Volume Share (%), by Country 2024 & 2032
- Figure 7: North America Solar Energy Market in New Zealand Revenue (Million), by End-User 2024 & 2032
- Figure 8: North America Solar Energy Market in New Zealand Volume (Gigawatt), by End-User 2024 & 2032
- Figure 9: North America Solar Energy Market in New Zealand Revenue Share (%), by End-User 2024 & 2032
- Figure 10: North America Solar Energy Market in New Zealand Volume Share (%), by End-User 2024 & 2032
- Figure 11: North America Solar Energy Market in New Zealand Revenue (Million), by Country 2024 & 2032
- Figure 12: North America Solar Energy Market in New Zealand Volume (Gigawatt), by Country 2024 & 2032
- Figure 13: North America Solar Energy Market in New Zealand Revenue Share (%), by Country 2024 & 2032
- Figure 14: North America Solar Energy Market in New Zealand Volume Share (%), by Country 2024 & 2032
- Figure 15: South America Solar Energy Market in New Zealand Revenue (Million), by End-User 2024 & 2032
- Figure 16: South America Solar Energy Market in New Zealand Volume (Gigawatt), by End-User 2024 & 2032
- Figure 17: South America Solar Energy Market in New Zealand Revenue Share (%), by End-User 2024 & 2032
- Figure 18: South America Solar Energy Market in New Zealand Volume Share (%), by End-User 2024 & 2032
- Figure 19: South America Solar Energy Market in New Zealand Revenue (Million), by Country 2024 & 2032
- Figure 20: South America Solar Energy Market in New Zealand Volume (Gigawatt), by Country 2024 & 2032
- Figure 21: South America Solar Energy Market in New Zealand Revenue Share (%), by Country 2024 & 2032
- Figure 22: South America Solar Energy Market in New Zealand Volume Share (%), by Country 2024 & 2032
- Figure 23: Europe Solar Energy Market in New Zealand Revenue (Million), by End-User 2024 & 2032
- Figure 24: Europe Solar Energy Market in New Zealand Volume (Gigawatt), by End-User 2024 & 2032
- Figure 25: Europe Solar Energy Market in New Zealand Revenue Share (%), by End-User 2024 & 2032
- Figure 26: Europe Solar Energy Market in New Zealand Volume Share (%), by End-User 2024 & 2032
- Figure 27: Europe Solar Energy Market in New Zealand Revenue (Million), by Country 2024 & 2032
- Figure 28: Europe Solar Energy Market in New Zealand Volume (Gigawatt), by Country 2024 & 2032
- Figure 29: Europe Solar Energy Market in New Zealand Revenue Share (%), by Country 2024 & 2032
- Figure 30: Europe Solar Energy Market in New Zealand Volume Share (%), by Country 2024 & 2032
- Figure 31: Middle East & Africa Solar Energy Market in New Zealand Revenue (Million), by End-User 2024 & 2032
- Figure 32: Middle East & Africa Solar Energy Market in New Zealand Volume (Gigawatt), by End-User 2024 & 2032
- Figure 33: Middle East & Africa Solar Energy Market in New Zealand Revenue Share (%), by End-User 2024 & 2032
- Figure 34: Middle East & Africa Solar Energy Market in New Zealand Volume Share (%), by End-User 2024 & 2032
- Figure 35: Middle East & Africa Solar Energy Market in New Zealand Revenue (Million), by Country 2024 & 2032
- Figure 36: Middle East & Africa Solar Energy Market in New Zealand Volume (Gigawatt), by Country 2024 & 2032
- Figure 37: Middle East & Africa Solar Energy Market in New Zealand Revenue Share (%), by Country 2024 & 2032
- Figure 38: Middle East & Africa Solar Energy Market in New Zealand Volume Share (%), by Country 2024 & 2032
- Figure 39: Asia Pacific Solar Energy Market in New Zealand Revenue (Million), by End-User 2024 & 2032
- Figure 40: Asia Pacific Solar Energy Market in New Zealand Volume (Gigawatt), by End-User 2024 & 2032
- Figure 41: Asia Pacific Solar Energy Market in New Zealand Revenue Share (%), by End-User 2024 & 2032
- Figure 42: Asia Pacific Solar Energy Market in New Zealand Volume Share (%), by End-User 2024 & 2032
- Figure 43: Asia Pacific Solar Energy Market in New Zealand Revenue (Million), by Country 2024 & 2032
- Figure 44: Asia Pacific Solar Energy Market in New Zealand Volume (Gigawatt), by Country 2024 & 2032
- Figure 45: Asia Pacific Solar Energy Market in New Zealand Revenue Share (%), by Country 2024 & 2032
- Figure 46: Asia Pacific Solar Energy Market in New Zealand Volume Share (%), by Country 2024 & 2032
List of Tables
- Table 1: Global Solar Energy Market in New Zealand Revenue Million Forecast, by Region 2019 & 2032
- Table 2: Global Solar Energy Market in New Zealand Volume Gigawatt Forecast, by Region 2019 & 2032
- Table 3: Global Solar Energy Market in New Zealand Revenue Million Forecast, by End-User 2019 & 2032
- Table 4: Global Solar Energy Market in New Zealand Volume Gigawatt Forecast, by End-User 2019 & 2032
- Table 5: Global Solar Energy Market in New Zealand Revenue Million Forecast, by Region 2019 & 2032
- Table 6: Global Solar Energy Market in New Zealand Volume Gigawatt Forecast, by Region 2019 & 2032
- Table 7: Global Solar Energy Market in New Zealand Revenue Million Forecast, by Country 2019 & 2032
- Table 8: Global Solar Energy Market in New Zealand Volume Gigawatt Forecast, by Country 2019 & 2032
- Table 9: Global Solar Energy Market in New Zealand Revenue Million Forecast, by End-User 2019 & 2032
- Table 10: Global Solar Energy Market in New Zealand Volume Gigawatt Forecast, by End-User 2019 & 2032
- Table 11: Global Solar Energy Market in New Zealand Revenue Million Forecast, by Country 2019 & 2032
- Table 12: Global Solar Energy Market in New Zealand Volume Gigawatt Forecast, by Country 2019 & 2032
- Table 13: United States Solar Energy Market in New Zealand Revenue (Million) Forecast, by Application 2019 & 2032
- Table 14: United States Solar Energy Market in New Zealand Volume (Gigawatt) Forecast, by Application 2019 & 2032
- Table 15: Canada Solar Energy Market in New Zealand Revenue (Million) Forecast, by Application 2019 & 2032
- Table 16: Canada Solar Energy Market in New Zealand Volume (Gigawatt) Forecast, by Application 2019 & 2032
- Table 17: Mexico Solar Energy Market in New Zealand Revenue (Million) Forecast, by Application 2019 & 2032
- Table 18: Mexico Solar Energy Market in New Zealand Volume (Gigawatt) Forecast, by Application 2019 & 2032
- Table 19: Global Solar Energy Market in New Zealand Revenue Million Forecast, by End-User 2019 & 2032
- Table 20: Global Solar Energy Market in New Zealand Volume Gigawatt Forecast, by End-User 2019 & 2032
- Table 21: Global Solar Energy Market in New Zealand Revenue Million Forecast, by Country 2019 & 2032
- Table 22: Global Solar Energy Market in New Zealand Volume Gigawatt Forecast, by Country 2019 & 2032
- Table 23: Brazil Solar Energy Market in New Zealand Revenue (Million) Forecast, by Application 2019 & 2032
- Table 24: Brazil Solar Energy Market in New Zealand Volume (Gigawatt) Forecast, by Application 2019 & 2032
- Table 25: Argentina Solar Energy Market in New Zealand Revenue (Million) Forecast, by Application 2019 & 2032
- Table 26: Argentina Solar Energy Market in New Zealand Volume (Gigawatt) Forecast, by Application 2019 & 2032
- Table 27: Rest of South America Solar Energy Market in New Zealand Revenue (Million) Forecast, by Application 2019 & 2032
- Table 28: Rest of South America Solar Energy Market in New Zealand Volume (Gigawatt) Forecast, by Application 2019 & 2032
- Table 29: Global Solar Energy Market in New Zealand Revenue Million Forecast, by End-User 2019 & 2032
- Table 30: Global Solar Energy Market in New Zealand Volume Gigawatt Forecast, by End-User 2019 & 2032
- Table 31: Global Solar Energy Market in New Zealand Revenue Million Forecast, by Country 2019 & 2032
- Table 32: Global Solar Energy Market in New Zealand Volume Gigawatt Forecast, by Country 2019 & 2032
- Table 33: United Kingdom Solar Energy Market in New Zealand Revenue (Million) Forecast, by Application 2019 & 2032
- Table 34: United Kingdom Solar Energy Market in New Zealand Volume (Gigawatt) Forecast, by Application 2019 & 2032
- Table 35: Germany Solar Energy Market in New Zealand Revenue (Million) Forecast, by Application 2019 & 2032
- Table 36: Germany Solar Energy Market in New Zealand Volume (Gigawatt) Forecast, by Application 2019 & 2032
- Table 37: France Solar Energy Market in New Zealand Revenue (Million) Forecast, by Application 2019 & 2032
- Table 38: France Solar Energy Market in New Zealand Volume (Gigawatt) Forecast, by Application 2019 & 2032
- Table 39: Italy Solar Energy Market in New Zealand Revenue (Million) Forecast, by Application 2019 & 2032
- Table 40: Italy Solar Energy Market in New Zealand Volume (Gigawatt) Forecast, by Application 2019 & 2032
- Table 41: Spain Solar Energy Market in New Zealand Revenue (Million) Forecast, by Application 2019 & 2032
- Table 42: Spain Solar Energy Market in New Zealand Volume (Gigawatt) Forecast, by Application 2019 & 2032
- Table 43: Russia Solar Energy Market in New Zealand Revenue (Million) Forecast, by Application 2019 & 2032
- Table 44: Russia Solar Energy Market in New Zealand Volume (Gigawatt) Forecast, by Application 2019 & 2032
- Table 45: Benelux Solar Energy Market in New Zealand Revenue (Million) Forecast, by Application 2019 & 2032
- Table 46: Benelux Solar Energy Market in New Zealand Volume (Gigawatt) Forecast, by Application 2019 & 2032
- Table 47: Nordics Solar Energy Market in New Zealand Revenue (Million) Forecast, by Application 2019 & 2032
- Table 48: Nordics Solar Energy Market in New Zealand Volume (Gigawatt) Forecast, by Application 2019 & 2032
- Table 49: Rest of Europe Solar Energy Market in New Zealand Revenue (Million) Forecast, by Application 2019 & 2032
- Table 50: Rest of Europe Solar Energy Market in New Zealand Volume (Gigawatt) Forecast, by Application 2019 & 2032
- Table 51: Global Solar Energy Market in New Zealand Revenue Million Forecast, by End-User 2019 & 2032
- Table 52: Global Solar Energy Market in New Zealand Volume Gigawatt Forecast, by End-User 2019 & 2032
- Table 53: Global Solar Energy Market in New Zealand Revenue Million Forecast, by Country 2019 & 2032
- Table 54: Global Solar Energy Market in New Zealand Volume Gigawatt Forecast, by Country 2019 & 2032
- Table 55: Turkey Solar Energy Market in New Zealand Revenue (Million) Forecast, by Application 2019 & 2032
- Table 56: Turkey Solar Energy Market in New Zealand Volume (Gigawatt) Forecast, by Application 2019 & 2032
- Table 57: Israel Solar Energy Market in New Zealand Revenue (Million) Forecast, by Application 2019 & 2032
- Table 58: Israel Solar Energy Market in New Zealand Volume (Gigawatt) Forecast, by Application 2019 & 2032
- Table 59: GCC Solar Energy Market in New Zealand Revenue (Million) Forecast, by Application 2019 & 2032
- Table 60: GCC Solar Energy Market in New Zealand Volume (Gigawatt) Forecast, by Application 2019 & 2032
- Table 61: North Africa Solar Energy Market in New Zealand Revenue (Million) Forecast, by Application 2019 & 2032
- Table 62: North Africa Solar Energy Market in New Zealand Volume (Gigawatt) Forecast, by Application 2019 & 2032
- Table 63: South Africa Solar Energy Market in New Zealand Revenue (Million) Forecast, by Application 2019 & 2032
- Table 64: South Africa Solar Energy Market in New Zealand Volume (Gigawatt) Forecast, by Application 2019 & 2032
- Table 65: Rest of Middle East & Africa Solar Energy Market in New Zealand Revenue (Million) Forecast, by Application 2019 & 2032
- Table 66: Rest of Middle East & Africa Solar Energy Market in New Zealand Volume (Gigawatt) Forecast, by Application 2019 & 2032
- Table 67: Global Solar Energy Market in New Zealand Revenue Million Forecast, by End-User 2019 & 2032
- Table 68: Global Solar Energy Market in New Zealand Volume Gigawatt Forecast, by End-User 2019 & 2032
- Table 69: Global Solar Energy Market in New Zealand Revenue Million Forecast, by Country 2019 & 2032
- Table 70: Global Solar Energy Market in New Zealand Volume Gigawatt Forecast, by Country 2019 & 2032
- Table 71: China Solar Energy Market in New Zealand Revenue (Million) Forecast, by Application 2019 & 2032
- Table 72: China Solar Energy Market in New Zealand Volume (Gigawatt) Forecast, by Application 2019 & 2032
- Table 73: India Solar Energy Market in New Zealand Revenue (Million) Forecast, by Application 2019 & 2032
- Table 74: India Solar Energy Market in New Zealand Volume (Gigawatt) Forecast, by Application 2019 & 2032
- Table 75: Japan Solar Energy Market in New Zealand Revenue (Million) Forecast, by Application 2019 & 2032
- Table 76: Japan Solar Energy Market in New Zealand Volume (Gigawatt) Forecast, by Application 2019 & 2032
- Table 77: South Korea Solar Energy Market in New Zealand Revenue (Million) Forecast, by Application 2019 & 2032
- Table 78: South Korea Solar Energy Market in New Zealand Volume (Gigawatt) Forecast, by Application 2019 & 2032
- Table 79: ASEAN Solar Energy Market in New Zealand Revenue (Million) Forecast, by Application 2019 & 2032
- Table 80: ASEAN Solar Energy Market in New Zealand Volume (Gigawatt) Forecast, by Application 2019 & 2032
- Table 81: Oceania Solar Energy Market in New Zealand Revenue (Million) Forecast, by Application 2019 & 2032
- Table 82: Oceania Solar Energy Market in New Zealand Volume (Gigawatt) Forecast, by Application 2019 & 2032
- Table 83: Rest of Asia Pacific Solar Energy Market in New Zealand Revenue (Million) Forecast, by Application 2019 & 2032
- Table 84: Rest of Asia Pacific Solar Energy Market in New Zealand Volume (Gigawatt) Forecast, by Application 2019 & 2032
Frequently Asked Questions
1. What is the projected Compound Annual Growth Rate (CAGR) of the Solar Energy Market in New Zealand?
The projected CAGR is approximately > 3.00%.
2. Which companies are prominent players in the Solar Energy Market in New Zealand?
Key companies in the market include JinkoSolar Holding Co Ltd, SkySolar, JA Solar Holdings, Trina Solar Co Ltd, Meridian Energy Ltd, New Zealand Solar Power Ltd, Sunergise International Limited, Lodestone Energy Ltd, ZEN Energy Systems New Zealand Limited.
3. What are the main segments of the Solar Energy Market in New Zealand?
The market segments include End-User.
4. Can you provide details about the market size?
The market size is estimated to be USD XX Million as of 2022.
5. What are some drivers contributing to market growth?
4.; Increasing Energy Demand4.; Upcoming and Ongoing Projects of Power Plants.
6. What are the notable trends driving market growth?
Utility Sector to Witness a Significant Growth.
7. Are there any restraints impacting market growth?
4.; Complexity and Expensive Nature of Coal-fired and Natural-gas-fired Power Plants.
8. Can you provide examples of recent developments in the market?
May 2022: Auckland-based renewables developer Far North Solar Farm (FNSF) announced its partnership with German investment manager and asset development company Aquila Capital to develop an estimated USD 1 billion suite of large-scale solar PV projects across New Zealand's North and South islands. The company expected to commence construction on a 1 GW portfolio of large-scale solar PV projects across the North and South islands.
9. What pricing options are available for accessing the report?
Pricing options include single-user, multi-user, and enterprise licenses priced at USD 3800, USD 4500, and USD 5800 respectively.
10. Is the market size provided in terms of value or volume?
The market size is provided in terms of value, measured in Million and volume, measured in Gigawatt.
11. Are there any specific market keywords associated with the report?
Yes, the market keyword associated with the report is "Solar Energy Market in New Zealand," which aids in identifying and referencing the specific market segment covered.
12. How do I determine which pricing option suits my needs best?
The pricing options vary based on user requirements and access needs. Individual users may opt for single-user licenses, while businesses requiring broader access may choose multi-user or enterprise licenses for cost-effective access to the report.
13. Are there any additional resources or data provided in the Solar Energy Market in New Zealand report?
While the report offers comprehensive insights, it's advisable to review the specific contents or supplementary materials provided to ascertain if additional resources or data are available.
14. How can I stay updated on further developments or reports in the Solar Energy Market in New Zealand?
To stay informed about further developments, trends, and reports in the Solar Energy Market in New Zealand, consider subscribing to industry newsletters, following relevant companies and organizations, or regularly checking reputable industry news sources and publications.
Methodology
Step 1 - Identification of Relevant Samples Size from Population Database


Step 2 - Approaches for Defining Global Market Size (Value, Volume* & Price*)

Note*: In applicable scenarios
Step 3 - Data Sources
Primary Research
- Web Analytics
- Survey Reports
- Research Institute
- Latest Research Reports
- Opinion Leaders
Secondary Research
- Annual Reports
- White Paper
- Latest Press Release
- Industry Association
- Paid Database
- Investor Presentations

Step 4 - Data Triangulation
Involves using different sources of information in order to increase the validity of a study
These sources are likely to be stakeholders in a program - participants, other researchers, program staff, other community members, and so on.
Then we put all data in single framework & apply various statistical tools to find out the dynamic on the market.
During the analysis stage, feedback from the stakeholder groups would be compared to determine areas of agreement as well as areas of divergence


