
Key Insights
The global automotive spark plug market is a mature yet dynamic sector, projected to experience steady growth driven by the increasing vehicle population, particularly in developing economies. The market's size in 2025 is estimated at $5 billion, based on industry analyses of related components and considering a conservative CAGR of 4% for the forecast period (2025-2033). Key growth drivers include the rising demand for vehicles in emerging markets like India and Southeast Asia, coupled with stringent emission regulations globally. Technological advancements, such as the development of iridium and platinum spark plugs offering improved fuel efficiency and extended lifespan, further contribute to market expansion. However, the increasing adoption of electric and hybrid vehicles poses a significant restraint, potentially limiting the overall market growth in the long term. This is partially offset by the continued demand for spark plugs in gasoline-powered vehicles, particularly in regions where EV adoption remains slow. Major players like Bosch, Denso, and NGK Spark Plugs dominate the market, leveraging their established brand reputation and extensive distribution networks. The market is segmented by type (conventional, iridium, platinum), vehicle type (passenger cars, commercial vehicles), and region, offering diverse growth opportunities for both established and emerging players.
Competition within the automotive spark plug market is intense, characterized by a mix of established multinational corporations and regional players. Pricing strategies, technological innovation, and distribution capabilities are key competitive factors. The market will continue to witness consolidation through mergers and acquisitions, as companies strive to enhance their product portfolios and expand their global reach. Furthermore, the increasing focus on sustainable manufacturing practices and reducing the environmental impact of production processes is becoming increasingly important. Future growth will largely depend on the pace of electric vehicle adoption and the development of innovative spark plug technologies that enhance engine performance while addressing environmental concerns. The forecast period (2025-2033) anticipates continued, albeit moderated, market growth, driven by the sustained demand in regions with less rapid EV adoption and technological improvements in spark plug efficiency.
Automotive Spark Plugs Market Report: 2019-2033
This comprehensive report provides a detailed analysis of the global automotive spark plugs market, offering invaluable insights for stakeholders across the automotive industry. The study covers the period 2019-2033, with a focus on the forecast period 2025-2033, utilizing 2025 as the base and estimated year. The report projects a market valued at millions of units by 2033, driven by key trends and technological advancements.
Automotive Spark Plugs Market Structure & Competitive Dynamics
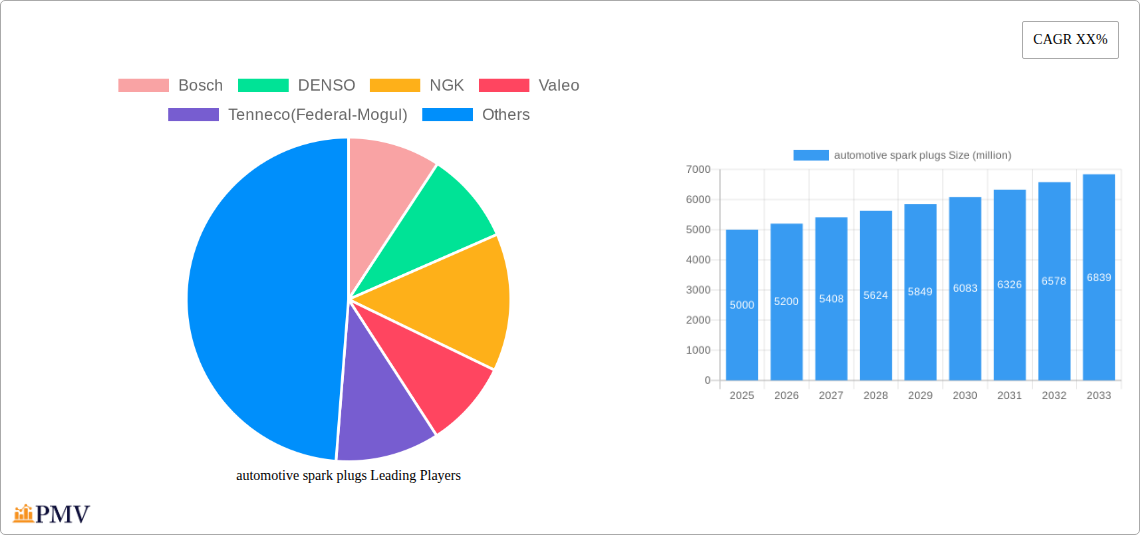
The global automotive spark plug market exhibits a moderately consolidated structure, with several key players commanding significant market share. Bosch, DENSO, NGK, and Valeo are prominent leaders, collectively holding an estimated xx% of the global market in 2025. Market concentration is influenced by factors such as economies of scale in manufacturing, established distribution networks, and strong brand recognition. Innovation ecosystems within the industry are characterized by continuous R&D investments focused on improving fuel efficiency, emissions reduction, and durability. Stringent emission regulations globally are driving the development of advanced spark plug technologies. Product substitutes, such as direct injection systems, pose a challenge to traditional spark plug markets, though the penetration rate remains relatively low at xx% in 2025. End-user trends favoring fuel-efficient vehicles and increasing demand for aftermarket replacements contribute to market growth. M&A activity in the sector has been moderate in recent years, with deal values totaling approximately $xx million between 2019 and 2024. Examples include [Insert specific M&A examples with deal values if available, otherwise state "Specific examples unavailable due to data limitations"]. This dynamic competitive landscape necessitates strategic partnerships and continuous innovation for sustained market presence.
Automotive Spark Plugs Industry Trends & Insights
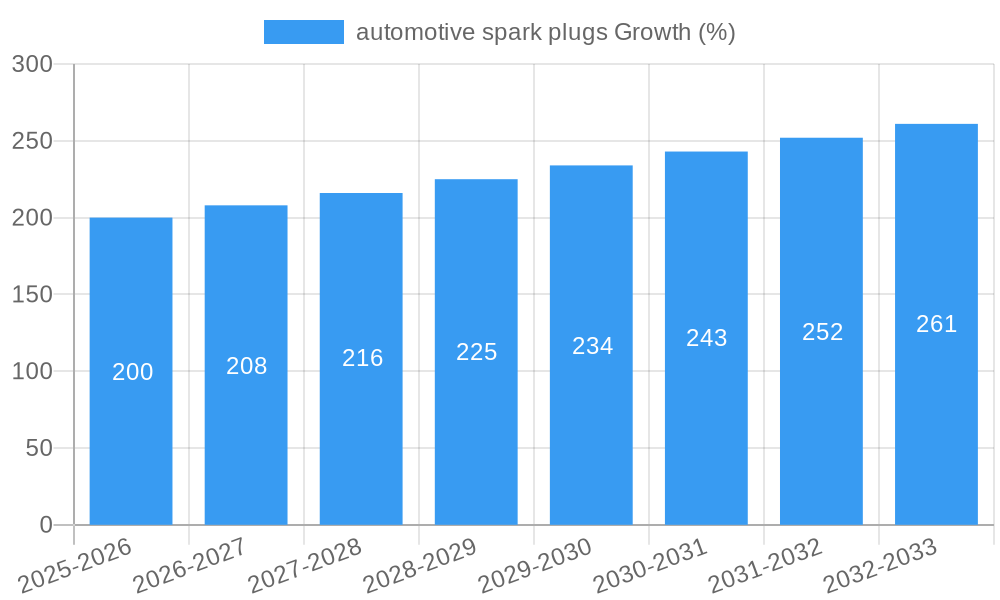
The automotive spark plug market is projected to experience a compound annual growth rate (CAGR) of xx% during the forecast period (2025-2033). This growth is primarily driven by the increasing global vehicle production, particularly in emerging economies. Rising disposable incomes and increased urbanization are fueling automotive sales in these regions, creating a significant demand for replacement spark plugs. Technological advancements, focusing on enhanced combustion efficiency and durability, are extending the lifespan of spark plugs, impacting the replacement market. However, the shift towards electric vehicles (EVs) and hybrid electric vehicles (HEVs) poses a significant long-term challenge to the traditional internal combustion engine (ICE) spark plug market. Market penetration of EVs and HEVs is expected to reach xx% by 2033, impacting the overall demand. Consumer preferences for high-performance vehicles and improved fuel economy are also driving demand for advanced spark plug technologies. Competitive dynamics are shaped by technological innovation, pricing strategies, and brand loyalty.
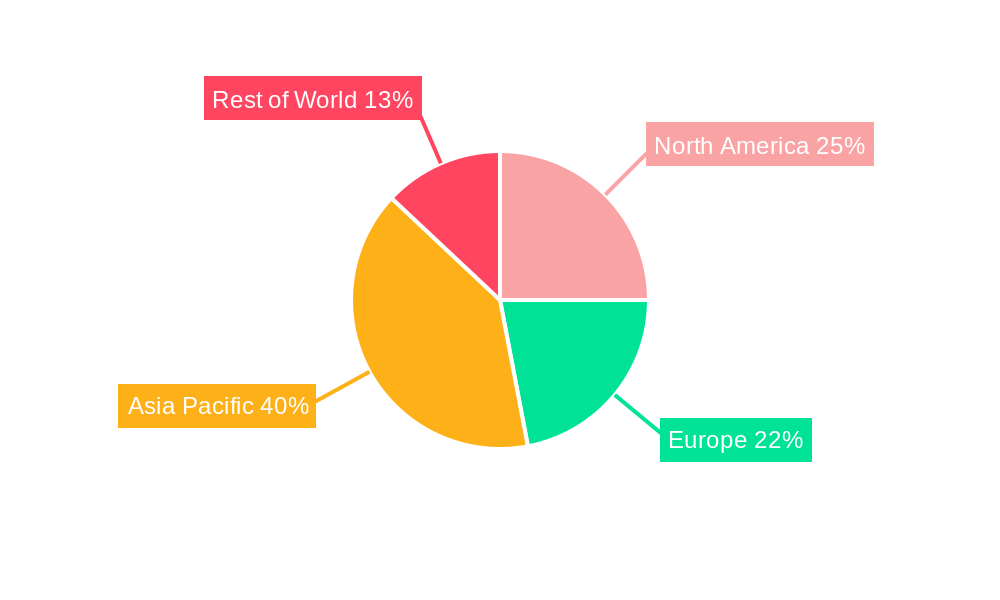
Dominant Markets & Segments in Automotive Spark Plugs
The Asia-Pacific region is currently the dominant market for automotive spark plugs, accounting for approximately xx% of global sales in 2025. This dominance is attributed to several key factors:
- High Vehicle Production: The region boasts the highest vehicle manufacturing output globally.
- Rapid Economic Growth: Rising disposable incomes are leading to increased car ownership.
- Favorable Government Policies: Supportive automotive industry policies and infrastructure investments drive demand.
While the Asia-Pacific region leads, North America and Europe also constitute significant markets, driven by robust aftermarket demand and the presence of major automotive manufacturers. The dominance is further segmented by vehicle type: passenger cars and light commercial vehicles account for the largest share, followed by heavy-duty vehicles. The aftermarket segment represents a significant portion of the total market, propelled by the need for replacement spark plugs due to wear and tear or performance issues.
Automotive Spark Plugs Product Innovations
Recent innovations in automotive spark plugs focus on improving fuel efficiency, reducing emissions, and enhancing durability. Iridium and platinum-tipped spark plugs are gaining popularity due to their superior performance and longevity. The integration of advanced materials and manufacturing techniques contributes to higher resistance to wear and tear. These innovations provide competitive advantages to manufacturers by meeting stringent emission regulations and catering to consumer demand for improved fuel efficiency and performance.
Report Segmentation & Scope
This report segments the automotive spark plugs market based on several key parameters:
- By Type: Standard spark plugs, Iridium spark plugs, Platinum spark plugs, other types. Each segment's growth projections and market size are analyzed, considering competitive dynamics and technological advancements.
- By Vehicle Type: Passenger cars, Light commercial vehicles, Heavy-duty vehicles. Market size and growth forecasts are detailed for each type, factoring in vehicle sales trends and specific application requirements.
- By Sales Channel: OEM, Aftermarket. Growth projections are detailed for each channel, highlighting competitive dynamics and distribution networks.
- By Geography: North America, Europe, Asia-Pacific, Rest of the World. Market size, growth rates, and key drivers are analyzed for each region.
Key Drivers of Automotive Spark Plugs Growth
The growth of the automotive spark plug market is primarily driven by a combination of factors:
- Rising Vehicle Production: The global automotive industry's steady growth drives demand for new vehicles, necessitating spark plugs.
- Growing Aftermarket Demand: The need for replacement spark plugs due to wear and tear in older vehicles fuels significant aftermarket sales.
- Technological Advancements: Innovations in spark plug technology leading to enhanced performance, durability, and fuel efficiency stimulate growth.
- Stringent Emission Regulations: Regulations mandating lower emissions drive the adoption of advanced spark plugs.
Challenges in the Automotive Spark Plugs Sector
The automotive spark plug market faces challenges including:
- Shift to EVs/HEVs: The increasing adoption of electric and hybrid vehicles reduces the demand for traditional spark plugs.
- Raw Material Price Fluctuations: Changes in the price of metals like platinum and iridium impact production costs and profitability.
- Intense Competition: The market is characterized by intense competition among established players and new entrants, leading to price pressure.
- Supply Chain Disruptions: Global supply chain disruptions can affect the availability of raw materials and components, influencing production and delivery timelines.
Leading Players in the Automotive Spark Plugs Market
- Bosch
- DENSO
- NGK
- Valeo
- Tenneco (Federal-Mogul)
- Autolite
- Magneti Marelli
- Eyquem
- Zhuzhou Torch Spark Plug
- Stitt
- E3
- Enerpulse
- LDH
- MSD
- ACDelco
Key Developments in Automotive Spark Plugs Sector
- 2022 Q4: Bosch launches a new line of iridium spark plugs with improved fuel efficiency.
- 2023 Q1: DENSO introduces a next-generation platinum spark plug with enhanced durability.
- 2023 Q3: NGK announces a strategic partnership to expand its distribution network in emerging markets. [Insert further developments with year and month if available]
Strategic Automotive Spark Plugs Market Outlook
The automotive spark plug market is poised for continued growth, albeit at a moderated pace due to the rising adoption of EVs and HEVs. Strategic opportunities exist in the development of advanced spark plug technologies for improved fuel efficiency and emissions reduction. Focusing on emerging markets and expanding aftermarket sales channels will be key to maintaining market share. The development of innovative solutions that address the challenges posed by the transition towards electric mobility will be critical for long-term success in this sector.
automotive spark plugs Segmentation
-
1. Application
- 1.1. Passenger Cars
- 1.2. Light Commercial Vehicles
- 1.3. Heavy Commercial Vehicles
-
2. Types
- 2.1. 原装火花塞
- 2.2. 后装火花塞
automotive spark plugs Segmentation By Geography
-
1. North America
- 1.1. United States
- 1.2. Canada
- 1.3. Mexico
-
2. South America
- 2.1. Brazil
- 2.2. Argentina
- 2.3. Rest of South America
-
3. Europe
- 3.1. United Kingdom
- 3.2. Germany
- 3.3. France
- 3.4. Italy
- 3.5. Spain
- 3.6. Russia
- 3.7. Benelux
- 3.8. Nordics
- 3.9. Rest of Europe
-
4. Middle East & Africa
- 4.1. Turkey
- 4.2. Israel
- 4.3. GCC
- 4.4. North Africa
- 4.5. South Africa
- 4.6. Rest of Middle East & Africa
-
5. Asia Pacific
- 5.1. China
- 5.2. India
- 5.3. Japan
- 5.4. South Korea
- 5.5. ASEAN
- 5.6. Oceania
- 5.7. Rest of Asia Pacific
automotive spark plugs REPORT HIGHLIGHTS
| Aspects | Details |
|---|---|
| Study Period | 2019-2033 |
| Base Year | 2024 |
| Estimated Year | 2025 |
| Forecast Period | 2025-2033 |
| Historical Period | 2019-2024 |
| Growth Rate | CAGR of XX% from 2019-2033 |
| Segmentation |
|
Table of Contents
- 1. Introduction
- 1.1. Research Scope
- 1.2. Market Segmentation
- 1.3. Research Methodology
- 1.4. Definitions and Assumptions
- 2. Executive Summary
- 2.1. Introduction
- 3. Market Dynamics
- 3.1. Introduction
- 3.2. Market Drivers
- 3.3. Market Restrains
- 3.4. Market Trends
- 4. Market Factor Analysis
- 4.1. Porters Five Forces
- 4.2. Supply/Value Chain
- 4.3. PESTEL analysis
- 4.4. Market Entropy
- 4.5. Patent/Trademark Analysis
- 5. Global automotive spark plugs Analysis, Insights and Forecast, 2019-2031
- 5.1. Market Analysis, Insights and Forecast - by Application
- 5.1.1. Passenger Cars
- 5.1.2. Light Commercial Vehicles
- 5.1.3. Heavy Commercial Vehicles
- 5.2. Market Analysis, Insights and Forecast - by Types
- 5.2.1. 原装火花塞
- 5.2.2. 后装火花塞
- 5.3. Market Analysis, Insights and Forecast - by Region
- 5.3.1. North America
- 5.3.2. South America
- 5.3.3. Europe
- 5.3.4. Middle East & Africa
- 5.3.5. Asia Pacific
- 5.1. Market Analysis, Insights and Forecast - by Application
- 6. North America automotive spark plugs Analysis, Insights and Forecast, 2019-2031
- 6.1. Market Analysis, Insights and Forecast - by Application
- 6.1.1. Passenger Cars
- 6.1.2. Light Commercial Vehicles
- 6.1.3. Heavy Commercial Vehicles
- 6.2. Market Analysis, Insights and Forecast - by Types
- 6.2.1. 原装火花塞
- 6.2.2. 后装火花塞
- 6.1. Market Analysis, Insights and Forecast - by Application
- 7. South America automotive spark plugs Analysis, Insights and Forecast, 2019-2031
- 7.1. Market Analysis, Insights and Forecast - by Application
- 7.1.1. Passenger Cars
- 7.1.2. Light Commercial Vehicles
- 7.1.3. Heavy Commercial Vehicles
- 7.2. Market Analysis, Insights and Forecast - by Types
- 7.2.1. 原装火花塞
- 7.2.2. 后装火花塞
- 7.1. Market Analysis, Insights and Forecast - by Application
- 8. Europe automotive spark plugs Analysis, Insights and Forecast, 2019-2031
- 8.1. Market Analysis, Insights and Forecast - by Application
- 8.1.1. Passenger Cars
- 8.1.2. Light Commercial Vehicles
- 8.1.3. Heavy Commercial Vehicles
- 8.2. Market Analysis, Insights and Forecast - by Types
- 8.2.1. 原装火花塞
- 8.2.2. 后装火花塞
- 8.1. Market Analysis, Insights and Forecast - by Application
- 9. Middle East & Africa automotive spark plugs Analysis, Insights and Forecast, 2019-2031
- 9.1. Market Analysis, Insights and Forecast - by Application
- 9.1.1. Passenger Cars
- 9.1.2. Light Commercial Vehicles
- 9.1.3. Heavy Commercial Vehicles
- 9.2. Market Analysis, Insights and Forecast - by Types
- 9.2.1. 原装火花塞
- 9.2.2. 后装火花塞
- 9.1. Market Analysis, Insights and Forecast - by Application
- 10. Asia Pacific automotive spark plugs Analysis, Insights and Forecast, 2019-2031
- 10.1. Market Analysis, Insights and Forecast - by Application
- 10.1.1. Passenger Cars
- 10.1.2. Light Commercial Vehicles
- 10.1.3. Heavy Commercial Vehicles
- 10.2. Market Analysis, Insights and Forecast - by Types
- 10.2.1. 原装火花塞
- 10.2.2. 后装火花塞
- 10.1. Market Analysis, Insights and Forecast - by Application
- 11. Competitive Analysis
- 11.1. Global Market Share Analysis 2024
- 11.2. Company Profiles
- 11.2.1 Bosch
- 11.2.1.1. Overview
- 11.2.1.2. Products
- 11.2.1.3. SWOT Analysis
- 11.2.1.4. Recent Developments
- 11.2.1.5. Financials (Based on Availability)
- 11.2.2 DENSO
- 11.2.2.1. Overview
- 11.2.2.2. Products
- 11.2.2.3. SWOT Analysis
- 11.2.2.4. Recent Developments
- 11.2.2.5. Financials (Based on Availability)
- 11.2.3 NGK
- 11.2.3.1. Overview
- 11.2.3.2. Products
- 11.2.3.3. SWOT Analysis
- 11.2.3.4. Recent Developments
- 11.2.3.5. Financials (Based on Availability)
- 11.2.4 Valeo
- 11.2.4.1. Overview
- 11.2.4.2. Products
- 11.2.4.3. SWOT Analysis
- 11.2.4.4. Recent Developments
- 11.2.4.5. Financials (Based on Availability)
- 11.2.5 Tenneco(Federal-Mogul)
- 11.2.5.1. Overview
- 11.2.5.2. Products
- 11.2.5.3. SWOT Analysis
- 11.2.5.4. Recent Developments
- 11.2.5.5. Financials (Based on Availability)
- 11.2.6 Autolite
- 11.2.6.1. Overview
- 11.2.6.2. Products
- 11.2.6.3. SWOT Analysis
- 11.2.6.4. Recent Developments
- 11.2.6.5. Financials (Based on Availability)
- 11.2.7 Magneti Marelli
- 11.2.7.1. Overview
- 11.2.7.2. Products
- 11.2.7.3. SWOT Analysis
- 11.2.7.4. Recent Developments
- 11.2.7.5. Financials (Based on Availability)
- 11.2.8 Eyquem
- 11.2.8.1. Overview
- 11.2.8.2. Products
- 11.2.8.3. SWOT Analysis
- 11.2.8.4. Recent Developments
- 11.2.8.5. Financials (Based on Availability)
- 11.2.9 Zhuzhou Torch Spark Plug
- 11.2.9.1. Overview
- 11.2.9.2. Products
- 11.2.9.3. SWOT Analysis
- 11.2.9.4. Recent Developments
- 11.2.9.5. Financials (Based on Availability)
- 11.2.10 Stitt
- 11.2.10.1. Overview
- 11.2.10.2. Products
- 11.2.10.3. SWOT Analysis
- 11.2.10.4. Recent Developments
- 11.2.10.5. Financials (Based on Availability)
- 11.2.11 E3
- 11.2.11.1. Overview
- 11.2.11.2. Products
- 11.2.11.3. SWOT Analysis
- 11.2.11.4. Recent Developments
- 11.2.11.5. Financials (Based on Availability)
- 11.2.12 Enerpulse
- 11.2.12.1. Overview
- 11.2.12.2. Products
- 11.2.12.3. SWOT Analysis
- 11.2.12.4. Recent Developments
- 11.2.12.5. Financials (Based on Availability)
- 11.2.13 LDH
- 11.2.13.1. Overview
- 11.2.13.2. Products
- 11.2.13.3. SWOT Analysis
- 11.2.13.4. Recent Developments
- 11.2.13.5. Financials (Based on Availability)
- 11.2.14 MSD
- 11.2.14.1. Overview
- 11.2.14.2. Products
- 11.2.14.3. SWOT Analysis
- 11.2.14.4. Recent Developments
- 11.2.14.5. Financials (Based on Availability)
- 11.2.15 ACDelco
- 11.2.15.1. Overview
- 11.2.15.2. Products
- 11.2.15.3. SWOT Analysis
- 11.2.15.4. Recent Developments
- 11.2.15.5. Financials (Based on Availability)
- 11.2.1 Bosch
List of Figures
- Figure 1: Global automotive spark plugs Revenue Breakdown (million, %) by Region 2024 & 2032
- Figure 2: Global automotive spark plugs Volume Breakdown (K, %) by Region 2024 & 2032
- Figure 3: North America automotive spark plugs Revenue (million), by Application 2024 & 2032
- Figure 4: North America automotive spark plugs Volume (K), by Application 2024 & 2032
- Figure 5: North America automotive spark plugs Revenue Share (%), by Application 2024 & 2032
- Figure 6: North America automotive spark plugs Volume Share (%), by Application 2024 & 2032
- Figure 7: North America automotive spark plugs Revenue (million), by Types 2024 & 2032
- Figure 8: North America automotive spark plugs Volume (K), by Types 2024 & 2032
- Figure 9: North America automotive spark plugs Revenue Share (%), by Types 2024 & 2032
- Figure 10: North America automotive spark plugs Volume Share (%), by Types 2024 & 2032
- Figure 11: North America automotive spark plugs Revenue (million), by Country 2024 & 2032
- Figure 12: North America automotive spark plugs Volume (K), by Country 2024 & 2032
- Figure 13: North America automotive spark plugs Revenue Share (%), by Country 2024 & 2032
- Figure 14: North America automotive spark plugs Volume Share (%), by Country 2024 & 2032
- Figure 15: South America automotive spark plugs Revenue (million), by Application 2024 & 2032
- Figure 16: South America automotive spark plugs Volume (K), by Application 2024 & 2032
- Figure 17: South America automotive spark plugs Revenue Share (%), by Application 2024 & 2032
- Figure 18: South America automotive spark plugs Volume Share (%), by Application 2024 & 2032
- Figure 19: South America automotive spark plugs Revenue (million), by Types 2024 & 2032
- Figure 20: South America automotive spark plugs Volume (K), by Types 2024 & 2032
- Figure 21: South America automotive spark plugs Revenue Share (%), by Types 2024 & 2032
- Figure 22: South America automotive spark plugs Volume Share (%), by Types 2024 & 2032
- Figure 23: South America automotive spark plugs Revenue (million), by Country 2024 & 2032
- Figure 24: South America automotive spark plugs Volume (K), by Country 2024 & 2032
- Figure 25: South America automotive spark plugs Revenue Share (%), by Country 2024 & 2032
- Figure 26: South America automotive spark plugs Volume Share (%), by Country 2024 & 2032
- Figure 27: Europe automotive spark plugs Revenue (million), by Application 2024 & 2032
- Figure 28: Europe automotive spark plugs Volume (K), by Application 2024 & 2032
- Figure 29: Europe automotive spark plugs Revenue Share (%), by Application 2024 & 2032
- Figure 30: Europe automotive spark plugs Volume Share (%), by Application 2024 & 2032
- Figure 31: Europe automotive spark plugs Revenue (million), by Types 2024 & 2032
- Figure 32: Europe automotive spark plugs Volume (K), by Types 2024 & 2032
- Figure 33: Europe automotive spark plugs Revenue Share (%), by Types 2024 & 2032
- Figure 34: Europe automotive spark plugs Volume Share (%), by Types 2024 & 2032
- Figure 35: Europe automotive spark plugs Revenue (million), by Country 2024 & 2032
- Figure 36: Europe automotive spark plugs Volume (K), by Country 2024 & 2032
- Figure 37: Europe automotive spark plugs Revenue Share (%), by Country 2024 & 2032
- Figure 38: Europe automotive spark plugs Volume Share (%), by Country 2024 & 2032
- Figure 39: Middle East & Africa automotive spark plugs Revenue (million), by Application 2024 & 2032
- Figure 40: Middle East & Africa automotive spark plugs Volume (K), by Application 2024 & 2032
- Figure 41: Middle East & Africa automotive spark plugs Revenue Share (%), by Application 2024 & 2032
- Figure 42: Middle East & Africa automotive spark plugs Volume Share (%), by Application 2024 & 2032
- Figure 43: Middle East & Africa automotive spark plugs Revenue (million), by Types 2024 & 2032
- Figure 44: Middle East & Africa automotive spark plugs Volume (K), by Types 2024 & 2032
- Figure 45: Middle East & Africa automotive spark plugs Revenue Share (%), by Types 2024 & 2032
- Figure 46: Middle East & Africa automotive spark plugs Volume Share (%), by Types 2024 & 2032
- Figure 47: Middle East & Africa automotive spark plugs Revenue (million), by Country 2024 & 2032
- Figure 48: Middle East & Africa automotive spark plugs Volume (K), by Country 2024 & 2032
- Figure 49: Middle East & Africa automotive spark plugs Revenue Share (%), by Country 2024 & 2032
- Figure 50: Middle East & Africa automotive spark plugs Volume Share (%), by Country 2024 & 2032
- Figure 51: Asia Pacific automotive spark plugs Revenue (million), by Application 2024 & 2032
- Figure 52: Asia Pacific automotive spark plugs Volume (K), by Application 2024 & 2032
- Figure 53: Asia Pacific automotive spark plugs Revenue Share (%), by Application 2024 & 2032
- Figure 54: Asia Pacific automotive spark plugs Volume Share (%), by Application 2024 & 2032
- Figure 55: Asia Pacific automotive spark plugs Revenue (million), by Types 2024 & 2032
- Figure 56: Asia Pacific automotive spark plugs Volume (K), by Types 2024 & 2032
- Figure 57: Asia Pacific automotive spark plugs Revenue Share (%), by Types 2024 & 2032
- Figure 58: Asia Pacific automotive spark plugs Volume Share (%), by Types 2024 & 2032
- Figure 59: Asia Pacific automotive spark plugs Revenue (million), by Country 2024 & 2032
- Figure 60: Asia Pacific automotive spark plugs Volume (K), by Country 2024 & 2032
- Figure 61: Asia Pacific automotive spark plugs Revenue Share (%), by Country 2024 & 2032
- Figure 62: Asia Pacific automotive spark plugs Volume Share (%), by Country 2024 & 2032
List of Tables
- Table 1: Global automotive spark plugs Revenue million Forecast, by Region 2019 & 2032
- Table 2: Global automotive spark plugs Volume K Forecast, by Region 2019 & 2032
- Table 3: Global automotive spark plugs Revenue million Forecast, by Application 2019 & 2032
- Table 4: Global automotive spark plugs Volume K Forecast, by Application 2019 & 2032
- Table 5: Global automotive spark plugs Revenue million Forecast, by Types 2019 & 2032
- Table 6: Global automotive spark plugs Volume K Forecast, by Types 2019 & 2032
- Table 7: Global automotive spark plugs Revenue million Forecast, by Region 2019 & 2032
- Table 8: Global automotive spark plugs Volume K Forecast, by Region 2019 & 2032
- Table 9: Global automotive spark plugs Revenue million Forecast, by Application 2019 & 2032
- Table 10: Global automotive spark plugs Volume K Forecast, by Application 2019 & 2032
- Table 11: Global automotive spark plugs Revenue million Forecast, by Types 2019 & 2032
- Table 12: Global automotive spark plugs Volume K Forecast, by Types 2019 & 2032
- Table 13: Global automotive spark plugs Revenue million Forecast, by Country 2019 & 2032
- Table 14: Global automotive spark plugs Volume K Forecast, by Country 2019 & 2032
- Table 15: United States automotive spark plugs Revenue (million) Forecast, by Application 2019 & 2032
- Table 16: United States automotive spark plugs Volume (K) Forecast, by Application 2019 & 2032
- Table 17: Canada automotive spark plugs Revenue (million) Forecast, by Application 2019 & 2032
- Table 18: Canada automotive spark plugs Volume (K) Forecast, by Application 2019 & 2032
- Table 19: Mexico automotive spark plugs Revenue (million) Forecast, by Application 2019 & 2032
- Table 20: Mexico automotive spark plugs Volume (K) Forecast, by Application 2019 & 2032
- Table 21: Global automotive spark plugs Revenue million Forecast, by Application 2019 & 2032
- Table 22: Global automotive spark plugs Volume K Forecast, by Application 2019 & 2032
- Table 23: Global automotive spark plugs Revenue million Forecast, by Types 2019 & 2032
- Table 24: Global automotive spark plugs Volume K Forecast, by Types 2019 & 2032
- Table 25: Global automotive spark plugs Revenue million Forecast, by Country 2019 & 2032
- Table 26: Global automotive spark plugs Volume K Forecast, by Country 2019 & 2032
- Table 27: Brazil automotive spark plugs Revenue (million) Forecast, by Application 2019 & 2032
- Table 28: Brazil automotive spark plugs Volume (K) Forecast, by Application 2019 & 2032
- Table 29: Argentina automotive spark plugs Revenue (million) Forecast, by Application 2019 & 2032
- Table 30: Argentina automotive spark plugs Volume (K) Forecast, by Application 2019 & 2032
- Table 31: Rest of South America automotive spark plugs Revenue (million) Forecast, by Application 2019 & 2032
- Table 32: Rest of South America automotive spark plugs Volume (K) Forecast, by Application 2019 & 2032
- Table 33: Global automotive spark plugs Revenue million Forecast, by Application 2019 & 2032
- Table 34: Global automotive spark plugs Volume K Forecast, by Application 2019 & 2032
- Table 35: Global automotive spark plugs Revenue million Forecast, by Types 2019 & 2032
- Table 36: Global automotive spark plugs Volume K Forecast, by Types 2019 & 2032
- Table 37: Global automotive spark plugs Revenue million Forecast, by Country 2019 & 2032
- Table 38: Global automotive spark plugs Volume K Forecast, by Country 2019 & 2032
- Table 39: United Kingdom automotive spark plugs Revenue (million) Forecast, by Application 2019 & 2032
- Table 40: United Kingdom automotive spark plugs Volume (K) Forecast, by Application 2019 & 2032
- Table 41: Germany automotive spark plugs Revenue (million) Forecast, by Application 2019 & 2032
- Table 42: Germany automotive spark plugs Volume (K) Forecast, by Application 2019 & 2032
- Table 43: France automotive spark plugs Revenue (million) Forecast, by Application 2019 & 2032
- Table 44: France automotive spark plugs Volume (K) Forecast, by Application 2019 & 2032
- Table 45: Italy automotive spark plugs Revenue (million) Forecast, by Application 2019 & 2032
- Table 46: Italy automotive spark plugs Volume (K) Forecast, by Application 2019 & 2032
- Table 47: Spain automotive spark plugs Revenue (million) Forecast, by Application 2019 & 2032
- Table 48: Spain automotive spark plugs Volume (K) Forecast, by Application 2019 & 2032
- Table 49: Russia automotive spark plugs Revenue (million) Forecast, by Application 2019 & 2032
- Table 50: Russia automotive spark plugs Volume (K) Forecast, by Application 2019 & 2032
- Table 51: Benelux automotive spark plugs Revenue (million) Forecast, by Application 2019 & 2032
- Table 52: Benelux automotive spark plugs Volume (K) Forecast, by Application 2019 & 2032
- Table 53: Nordics automotive spark plugs Revenue (million) Forecast, by Application 2019 & 2032
- Table 54: Nordics automotive spark plugs Volume (K) Forecast, by Application 2019 & 2032
- Table 55: Rest of Europe automotive spark plugs Revenue (million) Forecast, by Application 2019 & 2032
- Table 56: Rest of Europe automotive spark plugs Volume (K) Forecast, by Application 2019 & 2032
- Table 57: Global automotive spark plugs Revenue million Forecast, by Application 2019 & 2032
- Table 58: Global automotive spark plugs Volume K Forecast, by Application 2019 & 2032
- Table 59: Global automotive spark plugs Revenue million Forecast, by Types 2019 & 2032
- Table 60: Global automotive spark plugs Volume K Forecast, by Types 2019 & 2032
- Table 61: Global automotive spark plugs Revenue million Forecast, by Country 2019 & 2032
- Table 62: Global automotive spark plugs Volume K Forecast, by Country 2019 & 2032
- Table 63: Turkey automotive spark plugs Revenue (million) Forecast, by Application 2019 & 2032
- Table 64: Turkey automotive spark plugs Volume (K) Forecast, by Application 2019 & 2032
- Table 65: Israel automotive spark plugs Revenue (million) Forecast, by Application 2019 & 2032
- Table 66: Israel automotive spark plugs Volume (K) Forecast, by Application 2019 & 2032
- Table 67: GCC automotive spark plugs Revenue (million) Forecast, by Application 2019 & 2032
- Table 68: GCC automotive spark plugs Volume (K) Forecast, by Application 2019 & 2032
- Table 69: North Africa automotive spark plugs Revenue (million) Forecast, by Application 2019 & 2032
- Table 70: North Africa automotive spark plugs Volume (K) Forecast, by Application 2019 & 2032
- Table 71: South Africa automotive spark plugs Revenue (million) Forecast, by Application 2019 & 2032
- Table 72: South Africa automotive spark plugs Volume (K) Forecast, by Application 2019 & 2032
- Table 73: Rest of Middle East & Africa automotive spark plugs Revenue (million) Forecast, by Application 2019 & 2032
- Table 74: Rest of Middle East & Africa automotive spark plugs Volume (K) Forecast, by Application 2019 & 2032
- Table 75: Global automotive spark plugs Revenue million Forecast, by Application 2019 & 2032
- Table 76: Global automotive spark plugs Volume K Forecast, by Application 2019 & 2032
- Table 77: Global automotive spark plugs Revenue million Forecast, by Types 2019 & 2032
- Table 78: Global automotive spark plugs Volume K Forecast, by Types 2019 & 2032
- Table 79: Global automotive spark plugs Revenue million Forecast, by Country 2019 & 2032
- Table 80: Global automotive spark plugs Volume K Forecast, by Country 2019 & 2032
- Table 81: China automotive spark plugs Revenue (million) Forecast, by Application 2019 & 2032
- Table 82: China automotive spark plugs Volume (K) Forecast, by Application 2019 & 2032
- Table 83: India automotive spark plugs Revenue (million) Forecast, by Application 2019 & 2032
- Table 84: India automotive spark plugs Volume (K) Forecast, by Application 2019 & 2032
- Table 85: Japan automotive spark plugs Revenue (million) Forecast, by Application 2019 & 2032
- Table 86: Japan automotive spark plugs Volume (K) Forecast, by Application 2019 & 2032
- Table 87: South Korea automotive spark plugs Revenue (million) Forecast, by Application 2019 & 2032
- Table 88: South Korea automotive spark plugs Volume (K) Forecast, by Application 2019 & 2032
- Table 89: ASEAN automotive spark plugs Revenue (million) Forecast, by Application 2019 & 2032
- Table 90: ASEAN automotive spark plugs Volume (K) Forecast, by Application 2019 & 2032
- Table 91: Oceania automotive spark plugs Revenue (million) Forecast, by Application 2019 & 2032
- Table 92: Oceania automotive spark plugs Volume (K) Forecast, by Application 2019 & 2032
- Table 93: Rest of Asia Pacific automotive spark plugs Revenue (million) Forecast, by Application 2019 & 2032
- Table 94: Rest of Asia Pacific automotive spark plugs Volume (K) Forecast, by Application 2019 & 2032
Frequently Asked Questions
1. What is the projected Compound Annual Growth Rate (CAGR) of the automotive spark plugs?
The projected CAGR is approximately XX%.
2. Which companies are prominent players in the automotive spark plugs?
Key companies in the market include Bosch, DENSO, NGK, Valeo, Tenneco(Federal-Mogul), Autolite, Magneti Marelli, Eyquem, Zhuzhou Torch Spark Plug, Stitt, E3, Enerpulse, LDH, MSD, ACDelco.
3. What are the main segments of the automotive spark plugs?
The market segments include Application, Types.
4. Can you provide details about the market size?
The market size is estimated to be USD XXX million as of 2022.
5. What are some drivers contributing to market growth?
N/A
6. What are the notable trends driving market growth?
N/A
7. Are there any restraints impacting market growth?
N/A
8. Can you provide examples of recent developments in the market?
N/A
9. What pricing options are available for accessing the report?
Pricing options include single-user, multi-user, and enterprise licenses priced at USD 4350.00, USD 6525.00, and USD 8700.00 respectively.
10. Is the market size provided in terms of value or volume?
The market size is provided in terms of value, measured in million and volume, measured in K.
11. Are there any specific market keywords associated with the report?
Yes, the market keyword associated with the report is "automotive spark plugs," which aids in identifying and referencing the specific market segment covered.
12. How do I determine which pricing option suits my needs best?
The pricing options vary based on user requirements and access needs. Individual users may opt for single-user licenses, while businesses requiring broader access may choose multi-user or enterprise licenses for cost-effective access to the report.
13. Are there any additional resources or data provided in the automotive spark plugs report?
While the report offers comprehensive insights, it's advisable to review the specific contents or supplementary materials provided to ascertain if additional resources or data are available.
14. How can I stay updated on further developments or reports in the automotive spark plugs?
To stay informed about further developments, trends, and reports in the automotive spark plugs, consider subscribing to industry newsletters, following relevant companies and organizations, or regularly checking reputable industry news sources and publications.
Methodology
Step 1 - Identification of Relevant Samples Size from Population Database


Step 2 - Approaches for Defining Global Market Size (Value, Volume* & Price*)

Note*: In applicable scenarios
Step 3 - Data Sources
Primary Research
- Web Analytics
- Survey Reports
- Research Institute
- Latest Research Reports
- Opinion Leaders
Secondary Research
- Annual Reports
- White Paper
- Latest Press Release
- Industry Association
- Paid Database
- Investor Presentations

Step 4 - Data Triangulation
Involves using different sources of information in order to increase the validity of a study
These sources are likely to be stakeholders in a program - participants, other researchers, program staff, other community members, and so on.
Then we put all data in single framework & apply various statistical tools to find out the dynamic on the market.
During the analysis stage, feedback from the stakeholder groups would be compared to determine areas of agreement as well as areas of divergence


