
Key Insights
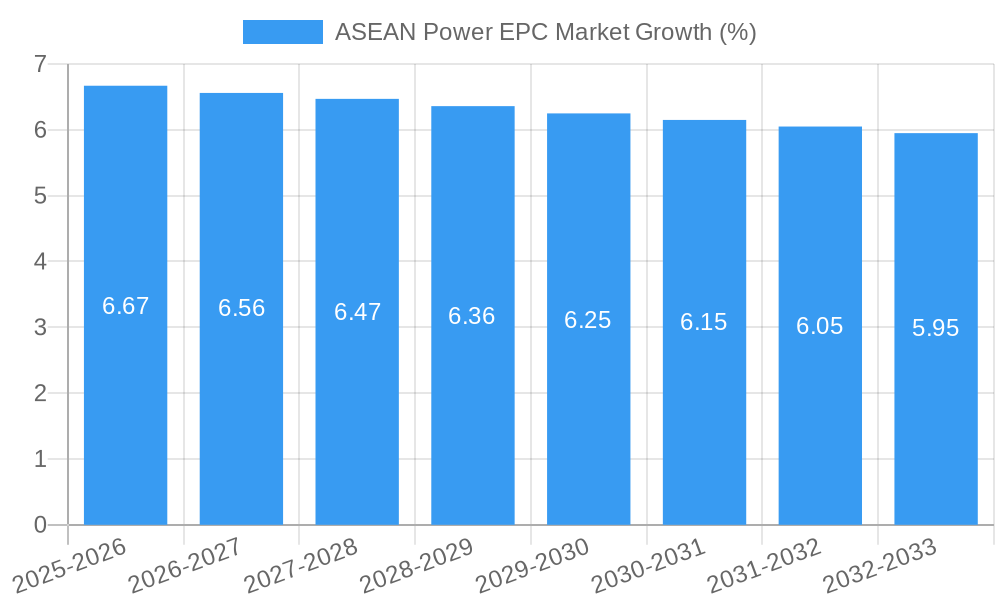
The ASEAN Power EPC (Engineering, Procurement, and Construction) market is experiencing robust growth, driven by increasing energy demand fueled by rapid economic development and industrialization across the region. A CAGR exceeding 6% from 2019-2024 suggests a significant market expansion. Key drivers include government initiatives promoting renewable energy sources like solar and wind power, alongside continued investment in conventional thermal power plants to meet the rising electricity needs. Furthermore, large-scale infrastructure projects and supportive regulatory frameworks are further bolstering market expansion. The market segmentation reveals a diverse landscape, with conventional thermal power still holding a substantial share, but renewables experiencing significant growth. Nuclear power, while a smaller segment, contributes to the overall market size and presents opportunities for specialized EPC contractors. Major players such as Hyundai Engineering, JGC Holdings, and Sumitomo Corporation are actively competing in this dynamic market, leveraging their expertise and global presence to secure projects. Within ASEAN, countries like Indonesia, Singapore, Thailand, and Vietnam represent major growth hubs due to their significant energy demands and ongoing infrastructure development plans.
The ASEAN Power EPC market’s future outlook remains positive. The continued focus on sustainable development goals, coupled with increasing private sector investments, will fuel further expansion. Growth will be particularly pronounced in renewable energy EPC projects, driven by falling costs of solar and wind technologies, and government incentives. However, challenges such as securing financing for large-scale projects, navigating complex regulatory environments, and managing supply chain disruptions will require strategic planning and adaptation from EPC companies. Effective risk management and the adoption of innovative technologies will be crucial for success in this competitive and evolving market. The increasing emphasis on grid modernization and smart grid technologies will present additional opportunities for EPC companies specializing in these areas.

ASEAN Power EPC Market: A Comprehensive Report (2019-2033)
This in-depth report provides a comprehensive analysis of the ASEAN Power Engineering, Procurement, and Construction (EPC) market from 2019 to 2033, offering invaluable insights for industry stakeholders. With a focus on key market trends, competitive dynamics, and future growth prospects, this report is an essential resource for businesses seeking to navigate this dynamic sector. The report covers a study period from 2019-2033, with a base year of 2025 and a forecast period spanning 2025-2033. The historical period analyzed is 2019-2024. Market values are expressed in Millions.
ASEAN Power EPC Market Structure & Competitive Dynamics
The ASEAN Power EPC market exhibits a moderately concentrated structure, with several major players vying for dominance. Market share is influenced by factors including technological expertise, project execution capabilities, financial strength, and established relationships with key clients. The market's innovation ecosystem is robust, driven by advancements in renewable energy technologies and digitalization efforts. Regulatory frameworks vary across ASEAN nations, impacting project approvals and investment decisions. Product substitutes, particularly in the renewable energy space, are becoming increasingly competitive. End-user trends are shifting towards sustainable energy sources, prompting a surge in renewable energy EPC projects. Mergers and acquisitions (M&A) play a significant role in shaping market dynamics, with deal values in the range of xx Million to xx Million observed in recent years.
- Market Concentration: Moderately concentrated, with top 5 players holding approximately xx% market share (2024).
- M&A Activity: Significant M&A activity observed, with a total deal value of approximately xx Million in the last 5 years.
- Regulatory Landscape: Varies significantly across ASEAN nations, impacting project timelines and investment attractiveness.
- Innovation: Strong focus on technological advancements in renewable energy and digital solutions for project management.
ASEAN Power EPC Market Industry Trends & Insights
The ASEAN Power EPC market is experiencing robust growth, fueled by increasing energy demand, infrastructure development initiatives, and government support for renewable energy. The Compound Annual Growth Rate (CAGR) is projected to be xx% during the forecast period (2025-2033). Technological disruptions, particularly in solar and wind energy, are driving down costs and increasing market penetration. Consumer preferences are shifting towards cleaner and more sustainable energy sources, further bolstering the demand for renewable energy EPC projects. Competitive dynamics are intense, with companies focusing on differentiation through technological innovation, cost optimization, and project execution expertise. Market penetration of renewable energy EPC projects is expected to reach xx% by 2033.
Dominant Markets & Segments in ASEAN Power EPC Market
Indonesia and Vietnam are currently the leading markets in the ASEAN Power EPC sector, experiencing significant growth fueled by robust economic expansion, increasing energy demand, and supportive government policies. The Renewables Power segment is the fastest-growing sector, driven by ambitious government targets for renewable energy integration and the continuous decrease in technology costs. This surge in renewable energy adoption is further propelled by rising concerns about climate change and the need for sustainable energy solutions.
- Key Regions: Southeast Asia, specifically focusing on Indonesia, Vietnam, the Philippines, and increasingly, Thailand and Malaysia.
- Leading Countries: Indonesia and Vietnam are currently dominant, with the Philippines showing strong potential for future growth.
- Fastest-Growing Segment: Renewables Power, encompassing solar, wind, hydro, and geothermal energy projects, largely due to decreasing costs and supportive government policies, including feed-in tariffs and renewable portfolio standards (RPS).
- Other Significant Segments: While renewables dominate growth, the traditional fossil fuel power sector continues to play a role, particularly in meeting baseload demand. However, even within this sector, there's a trend toward more efficient and cleaner technologies.
Key Drivers for Growth in Indonesia and Vietnam (and other key markets):
- Rapid Economic Growth: The robust economic expansion in these nations necessitates increased energy production to fuel industrialization and urbanization.
- Significant Infrastructure Development: Massive investments in power infrastructure projects are underway, creating numerous opportunities for EPC contractors.
- Government Support for Renewable Energy: Supportive policies, including tax incentives, subsidies, and streamlined permitting processes, are actively promoting renewable energy adoption.
- Growing Energy Security Concerns: Nations are increasingly focusing on diversifying their energy sources to reduce reliance on imported fossil fuels and enhance energy independence.
ASEAN Power EPC Market Product Innovations
Recent innovations focus on enhancing efficiency, reducing costs, and improving sustainability across different power generation segments. Advancements in smart grid technologies, digital twins for project management, and modular construction methods are transforming project execution. The market is seeing a rapid adoption of these technologies to improve operational efficiency and reduce the environmental impact of power generation.
Report Segmentation & Scope
This report segments the ASEAN Power EPC market based on power source:
Conventional Thermal Power: This segment includes projects related to coal, gas, and oil-fired power plants. The market size for this segment is expected to grow at a CAGR of xx% during the forecast period, although it faces increasing pressure from renewable energy sources. Competitive dynamics are characterized by established players competing on cost and efficiency.
Renewables Power: This is the fastest-growing segment, driven by increasing government support and decreasing technology costs. It encompasses solar, wind, hydro, and biomass power projects. The market size is expected to grow at a CAGR of xx% during the forecast period. Competitive dynamics are characterized by a mix of established EPC players and new entrants specializing in renewable technologies.
Nuclear Power: This segment is relatively small but holds potential for future growth. The market size is expected to grow at a CAGR of xx% during the forecast period, subject to regulatory approvals and public acceptance. Competitive dynamics are limited due to high barriers to entry.
Key Drivers of ASEAN Power EPC Market Growth
Several key factors drive growth in the ASEAN Power EPC market:
- Increasing Energy Demand: Rapid economic growth and rising population lead to increased energy consumption.
- Government Initiatives: Strong government support for renewable energy and infrastructure development.
- Technological Advancements: Cost reductions and efficiency improvements in renewable energy technologies.
Challenges in the ASEAN Power EPC Market Sector
The ASEAN Power EPC market faces several challenges:
- Regulatory Hurdles: Complex regulatory frameworks and approval processes can delay project implementation.
- Supply Chain Disruptions: Global supply chain uncertainties can impact project costs and timelines.
- Competition: Intense competition among EPC companies puts pressure on margins.
Leading Players in the ASEAN Power EPC Market
- Hyundai Engineering Co Ltd
- JGC Holdings Corporation
- Sumitomo Corporation
- Trung Nam Group
- Toshiba Corporation
- Doosan Heavy Industries & Construction Co Ltd
- Indika Energy
- Kawasaki Heavy Industries Ltd
- IHI Corporation
- Mitsubishi Heavy Industries Ltd
Key Developments in ASEAN Power EPC Market Sector
- December 2021: Solar Philippines Nueva Ecija Corporation (SPNEC) commences construction of a 500 MW solar PV facility in the Philippines.
- October 2021: Mitsubishi Power commissions a 500 MW natural gas turbine in Indonesia's Muara Karang Power Plant.
- March 2022: San Miguel Corp. plans to build two gas-fired power stations in the central Philippines, totaling 600 MW.
Strategic ASEAN Power EPC Market Outlook
The ASEAN Power EPC market is poised for continued growth, driven by sustained energy demand, government policies supporting renewable energy, and ongoing technological advancements. Strategic opportunities exist for companies focusing on renewable energy EPC, digitalization of project management, and capacity expansion in key markets. Companies with strong execution capabilities, financial strength, and innovative technological solutions are well-positioned to capture significant market share in the coming years.
ASEAN Power EPC Market Segmentation
-
1. Source
- 1.1. Conventional Thermal Power
- 1.2. Renewables Power
- 1.3. Nuclear Power
-
2. Geography
- 2.1. Indonesia
- 2.2. Thailand
- 2.3. Malaysia
- 2.4. Vietnam
- 2.5. Philippines
- 2.6. Rest of the ASEAN Countries
ASEAN Power EPC Market Segmentation By Geography
- 1. Indonesia
- 2. Thailand
- 3. Malaysia
- 4. Vietnam
- 5. Philippines
- 6. Rest of the ASEAN Countries

ASEAN Power EPC Market REPORT HIGHLIGHTS
| Aspects | Details |
|---|---|
| Study Period | 2019-2033 |
| Base Year | 2024 |
| Estimated Year | 2025 |
| Forecast Period | 2025-2033 |
| Historical Period | 2019-2024 |
| Growth Rate | CAGR of > 6.00% from 2019-2033 |
| Segmentation |
|
Table of Contents
- 1. Introduction
- 1.1. Research Scope
- 1.2. Market Segmentation
- 1.3. Research Methodology
- 1.4. Definitions and Assumptions
- 2. Executive Summary
- 2.1. Introduction
- 3. Market Dynamics
- 3.1. Introduction
- 3.2. Market Drivers
- 3.2.1. 4.; Uninterrupted and Reliable Power Supply and Heavy Deployment of DG (diesel generator) Set4.; Improvement in Technology of Diesel Generator
- 3.3. Market Restrains
- 3.3.1. 4.; The Growing Trend of Renewable Power Generation
- 3.4. Market Trends
- 3.4.1. Renewables Power Source to Witness Significant Growth
- 4. Market Factor Analysis
- 4.1. Porters Five Forces
- 4.2. Supply/Value Chain
- 4.3. PESTEL analysis
- 4.4. Market Entropy
- 4.5. Patent/Trademark Analysis
- 5. Global ASEAN Power EPC Market Analysis, Insights and Forecast, 2019-2031
- 5.1. Market Analysis, Insights and Forecast - by Source
- 5.1.1. Conventional Thermal Power
- 5.1.2. Renewables Power
- 5.1.3. Nuclear Power
- 5.2. Market Analysis, Insights and Forecast - by Geography
- 5.2.1. Indonesia
- 5.2.2. Thailand
- 5.2.3. Malaysia
- 5.2.4. Vietnam
- 5.2.5. Philippines
- 5.2.6. Rest of the ASEAN Countries
- 5.3. Market Analysis, Insights and Forecast - by Region
- 5.3.1. Indonesia
- 5.3.2. Thailand
- 5.3.3. Malaysia
- 5.3.4. Vietnam
- 5.3.5. Philippines
- 5.3.6. Rest of the ASEAN Countries
- 5.1. Market Analysis, Insights and Forecast - by Source
- 6. Indonesia ASEAN Power EPC Market Analysis, Insights and Forecast, 2019-2031
- 6.1. Market Analysis, Insights and Forecast - by Source
- 6.1.1. Conventional Thermal Power
- 6.1.2. Renewables Power
- 6.1.3. Nuclear Power
- 6.2. Market Analysis, Insights and Forecast - by Geography
- 6.2.1. Indonesia
- 6.2.2. Thailand
- 6.2.3. Malaysia
- 6.2.4. Vietnam
- 6.2.5. Philippines
- 6.2.6. Rest of the ASEAN Countries
- 6.1. Market Analysis, Insights and Forecast - by Source
- 7. Thailand ASEAN Power EPC Market Analysis, Insights and Forecast, 2019-2031
- 7.1. Market Analysis, Insights and Forecast - by Source
- 7.1.1. Conventional Thermal Power
- 7.1.2. Renewables Power
- 7.1.3. Nuclear Power
- 7.2. Market Analysis, Insights and Forecast - by Geography
- 7.2.1. Indonesia
- 7.2.2. Thailand
- 7.2.3. Malaysia
- 7.2.4. Vietnam
- 7.2.5. Philippines
- 7.2.6. Rest of the ASEAN Countries
- 7.1. Market Analysis, Insights and Forecast - by Source
- 8. Malaysia ASEAN Power EPC Market Analysis, Insights and Forecast, 2019-2031
- 8.1. Market Analysis, Insights and Forecast - by Source
- 8.1.1. Conventional Thermal Power
- 8.1.2. Renewables Power
- 8.1.3. Nuclear Power
- 8.2. Market Analysis, Insights and Forecast - by Geography
- 8.2.1. Indonesia
- 8.2.2. Thailand
- 8.2.3. Malaysia
- 8.2.4. Vietnam
- 8.2.5. Philippines
- 8.2.6. Rest of the ASEAN Countries
- 8.1. Market Analysis, Insights and Forecast - by Source
- 9. Vietnam ASEAN Power EPC Market Analysis, Insights and Forecast, 2019-2031
- 9.1. Market Analysis, Insights and Forecast - by Source
- 9.1.1. Conventional Thermal Power
- 9.1.2. Renewables Power
- 9.1.3. Nuclear Power
- 9.2. Market Analysis, Insights and Forecast - by Geography
- 9.2.1. Indonesia
- 9.2.2. Thailand
- 9.2.3. Malaysia
- 9.2.4. Vietnam
- 9.2.5. Philippines
- 9.2.6. Rest of the ASEAN Countries
- 9.1. Market Analysis, Insights and Forecast - by Source
- 10. Philippines ASEAN Power EPC Market Analysis, Insights and Forecast, 2019-2031
- 10.1. Market Analysis, Insights and Forecast - by Source
- 10.1.1. Conventional Thermal Power
- 10.1.2. Renewables Power
- 10.1.3. Nuclear Power
- 10.2. Market Analysis, Insights and Forecast - by Geography
- 10.2.1. Indonesia
- 10.2.2. Thailand
- 10.2.3. Malaysia
- 10.2.4. Vietnam
- 10.2.5. Philippines
- 10.2.6. Rest of the ASEAN Countries
- 10.1. Market Analysis, Insights and Forecast - by Source
- 11. Rest of the ASEAN Countries ASEAN Power EPC Market Analysis, Insights and Forecast, 2019-2031
- 11.1. Market Analysis, Insights and Forecast - by Source
- 11.1.1. Conventional Thermal Power
- 11.1.2. Renewables Power
- 11.1.3. Nuclear Power
- 11.2. Market Analysis, Insights and Forecast - by Geography
- 11.2.1. Indonesia
- 11.2.2. Thailand
- 11.2.3. Malaysia
- 11.2.4. Vietnam
- 11.2.5. Philippines
- 11.2.6. Rest of the ASEAN Countries
- 11.1. Market Analysis, Insights and Forecast - by Source
- 12. North America ASEAN Power EPC Market Analysis, Insights and Forecast, 2019-2031
- 12.1. Market Analysis, Insights and Forecast - By Country/Sub-region
- 12.1.1 United States
- 12.1.2 Canada
- 12.1.3 Mexico
- 13. Europe ASEAN Power EPC Market Analysis, Insights and Forecast, 2019-2031
- 13.1. Market Analysis, Insights and Forecast - By Country/Sub-region
- 13.1.1 Germany
- 13.1.2 United Kingdom
- 13.1.3 France
- 13.1.4 Spain
- 13.1.5 Italy
- 13.1.6 Spain
- 13.1.7 Belgium
- 13.1.8 Netherland
- 13.1.9 Nordics
- 13.1.10 Rest of Europe
- 14. Asia Pacific ASEAN Power EPC Market Analysis, Insights and Forecast, 2019-2031
- 14.1. Market Analysis, Insights and Forecast - By Country/Sub-region
- 14.1.1 China
- 14.1.2 Japan
- 14.1.3 India
- 14.1.4 South Korea
- 14.1.5 Southeast Asia
- 14.1.6 Australia
- 14.1.7 Indonesia
- 14.1.8 Phillipes
- 14.1.9 Singapore
- 14.1.10 Thailandc
- 14.1.11 Rest of Asia Pacific
- 15. South America ASEAN Power EPC Market Analysis, Insights and Forecast, 2019-2031
- 15.1. Market Analysis, Insights and Forecast - By Country/Sub-region
- 15.1.1 Brazil
- 15.1.2 Argentina
- 15.1.3 Peru
- 15.1.4 Chile
- 15.1.5 Colombia
- 15.1.6 Ecuador
- 15.1.7 Venezuela
- 15.1.8 Rest of South America
- 16. MEA ASEAN Power EPC Market Analysis, Insights and Forecast, 2019-2031
- 16.1. Market Analysis, Insights and Forecast - By Country/Sub-region
- 16.1.1 United Arab Emirates
- 16.1.2 Saudi Arabia
- 16.1.3 South Africa
- 16.1.4 Rest of Middle East and Africa
- 17. Competitive Analysis
- 17.1. Global Market Share Analysis 2024
- 17.2. Company Profiles
- 17.2.1 Hyundai Engineering Co Ltd
- 17.2.1.1. Overview
- 17.2.1.2. Products
- 17.2.1.3. SWOT Analysis
- 17.2.1.4. Recent Developments
- 17.2.1.5. Financials (Based on Availability)
- 17.2.2 JGC Holdings Corporation
- 17.2.2.1. Overview
- 17.2.2.2. Products
- 17.2.2.3. SWOT Analysis
- 17.2.2.4. Recent Developments
- 17.2.2.5. Financials (Based on Availability)
- 17.2.3 Sumitomo Corporation
- 17.2.3.1. Overview
- 17.2.3.2. Products
- 17.2.3.3. SWOT Analysis
- 17.2.3.4. Recent Developments
- 17.2.3.5. Financials (Based on Availability)
- 17.2.4 Trung Nam Group
- 17.2.4.1. Overview
- 17.2.4.2. Products
- 17.2.4.3. SWOT Analysis
- 17.2.4.4. Recent Developments
- 17.2.4.5. Financials (Based on Availability)
- 17.2.5 Toshiba Corporation
- 17.2.5.1. Overview
- 17.2.5.2. Products
- 17.2.5.3. SWOT Analysis
- 17.2.5.4. Recent Developments
- 17.2.5.5. Financials (Based on Availability)
- 17.2.6 Doosan Heavy Industries & Construction Co Ltd
- 17.2.6.1. Overview
- 17.2.6.2. Products
- 17.2.6.3. SWOT Analysis
- 17.2.6.4. Recent Developments
- 17.2.6.5. Financials (Based on Availability)
- 17.2.7 Indika Energy
- 17.2.7.1. Overview
- 17.2.7.2. Products
- 17.2.7.3. SWOT Analysis
- 17.2.7.4. Recent Developments
- 17.2.7.5. Financials (Based on Availability)
- 17.2.8 Kawasaki Heavy Industries Ltd
- 17.2.8.1. Overview
- 17.2.8.2. Products
- 17.2.8.3. SWOT Analysis
- 17.2.8.4. Recent Developments
- 17.2.8.5. Financials (Based on Availability)
- 17.2.9 IHI Corporation
- 17.2.9.1. Overview
- 17.2.9.2. Products
- 17.2.9.3. SWOT Analysis
- 17.2.9.4. Recent Developments
- 17.2.9.5. Financials (Based on Availability)
- 17.2.10 Mitsubishi Heavy Industries Ltd
- 17.2.10.1. Overview
- 17.2.10.2. Products
- 17.2.10.3. SWOT Analysis
- 17.2.10.4. Recent Developments
- 17.2.10.5. Financials (Based on Availability)
- 17.2.1 Hyundai Engineering Co Ltd
List of Figures
- Figure 1: Global ASEAN Power EPC Market Revenue Breakdown (Million, %) by Region 2024 & 2032
- Figure 2: North America ASEAN Power EPC Market Revenue (Million), by Country 2024 & 2032
- Figure 3: North America ASEAN Power EPC Market Revenue Share (%), by Country 2024 & 2032
- Figure 4: Europe ASEAN Power EPC Market Revenue (Million), by Country 2024 & 2032
- Figure 5: Europe ASEAN Power EPC Market Revenue Share (%), by Country 2024 & 2032
- Figure 6: Asia Pacific ASEAN Power EPC Market Revenue (Million), by Country 2024 & 2032
- Figure 7: Asia Pacific ASEAN Power EPC Market Revenue Share (%), by Country 2024 & 2032
- Figure 8: South America ASEAN Power EPC Market Revenue (Million), by Country 2024 & 2032
- Figure 9: South America ASEAN Power EPC Market Revenue Share (%), by Country 2024 & 2032
- Figure 10: MEA ASEAN Power EPC Market Revenue (Million), by Country 2024 & 2032
- Figure 11: MEA ASEAN Power EPC Market Revenue Share (%), by Country 2024 & 2032
- Figure 12: Indonesia ASEAN Power EPC Market Revenue (Million), by Source 2024 & 2032
- Figure 13: Indonesia ASEAN Power EPC Market Revenue Share (%), by Source 2024 & 2032
- Figure 14: Indonesia ASEAN Power EPC Market Revenue (Million), by Geography 2024 & 2032
- Figure 15: Indonesia ASEAN Power EPC Market Revenue Share (%), by Geography 2024 & 2032
- Figure 16: Indonesia ASEAN Power EPC Market Revenue (Million), by Country 2024 & 2032
- Figure 17: Indonesia ASEAN Power EPC Market Revenue Share (%), by Country 2024 & 2032
- Figure 18: Thailand ASEAN Power EPC Market Revenue (Million), by Source 2024 & 2032
- Figure 19: Thailand ASEAN Power EPC Market Revenue Share (%), by Source 2024 & 2032
- Figure 20: Thailand ASEAN Power EPC Market Revenue (Million), by Geography 2024 & 2032
- Figure 21: Thailand ASEAN Power EPC Market Revenue Share (%), by Geography 2024 & 2032
- Figure 22: Thailand ASEAN Power EPC Market Revenue (Million), by Country 2024 & 2032
- Figure 23: Thailand ASEAN Power EPC Market Revenue Share (%), by Country 2024 & 2032
- Figure 24: Malaysia ASEAN Power EPC Market Revenue (Million), by Source 2024 & 2032
- Figure 25: Malaysia ASEAN Power EPC Market Revenue Share (%), by Source 2024 & 2032
- Figure 26: Malaysia ASEAN Power EPC Market Revenue (Million), by Geography 2024 & 2032
- Figure 27: Malaysia ASEAN Power EPC Market Revenue Share (%), by Geography 2024 & 2032
- Figure 28: Malaysia ASEAN Power EPC Market Revenue (Million), by Country 2024 & 2032
- Figure 29: Malaysia ASEAN Power EPC Market Revenue Share (%), by Country 2024 & 2032
- Figure 30: Vietnam ASEAN Power EPC Market Revenue (Million), by Source 2024 & 2032
- Figure 31: Vietnam ASEAN Power EPC Market Revenue Share (%), by Source 2024 & 2032
- Figure 32: Vietnam ASEAN Power EPC Market Revenue (Million), by Geography 2024 & 2032
- Figure 33: Vietnam ASEAN Power EPC Market Revenue Share (%), by Geography 2024 & 2032
- Figure 34: Vietnam ASEAN Power EPC Market Revenue (Million), by Country 2024 & 2032
- Figure 35: Vietnam ASEAN Power EPC Market Revenue Share (%), by Country 2024 & 2032
- Figure 36: Philippines ASEAN Power EPC Market Revenue (Million), by Source 2024 & 2032
- Figure 37: Philippines ASEAN Power EPC Market Revenue Share (%), by Source 2024 & 2032
- Figure 38: Philippines ASEAN Power EPC Market Revenue (Million), by Geography 2024 & 2032
- Figure 39: Philippines ASEAN Power EPC Market Revenue Share (%), by Geography 2024 & 2032
- Figure 40: Philippines ASEAN Power EPC Market Revenue (Million), by Country 2024 & 2032
- Figure 41: Philippines ASEAN Power EPC Market Revenue Share (%), by Country 2024 & 2032
- Figure 42: Rest of the ASEAN Countries ASEAN Power EPC Market Revenue (Million), by Source 2024 & 2032
- Figure 43: Rest of the ASEAN Countries ASEAN Power EPC Market Revenue Share (%), by Source 2024 & 2032
- Figure 44: Rest of the ASEAN Countries ASEAN Power EPC Market Revenue (Million), by Geography 2024 & 2032
- Figure 45: Rest of the ASEAN Countries ASEAN Power EPC Market Revenue Share (%), by Geography 2024 & 2032
- Figure 46: Rest of the ASEAN Countries ASEAN Power EPC Market Revenue (Million), by Country 2024 & 2032
- Figure 47: Rest of the ASEAN Countries ASEAN Power EPC Market Revenue Share (%), by Country 2024 & 2032
List of Tables
- Table 1: Global ASEAN Power EPC Market Revenue Million Forecast, by Region 2019 & 2032
- Table 2: Global ASEAN Power EPC Market Revenue Million Forecast, by Source 2019 & 2032
- Table 3: Global ASEAN Power EPC Market Revenue Million Forecast, by Geography 2019 & 2032
- Table 4: Global ASEAN Power EPC Market Revenue Million Forecast, by Region 2019 & 2032
- Table 5: Global ASEAN Power EPC Market Revenue Million Forecast, by Country 2019 & 2032
- Table 6: United States ASEAN Power EPC Market Revenue (Million) Forecast, by Application 2019 & 2032
- Table 7: Canada ASEAN Power EPC Market Revenue (Million) Forecast, by Application 2019 & 2032
- Table 8: Mexico ASEAN Power EPC Market Revenue (Million) Forecast, by Application 2019 & 2032
- Table 9: Global ASEAN Power EPC Market Revenue Million Forecast, by Country 2019 & 2032
- Table 10: Germany ASEAN Power EPC Market Revenue (Million) Forecast, by Application 2019 & 2032
- Table 11: United Kingdom ASEAN Power EPC Market Revenue (Million) Forecast, by Application 2019 & 2032
- Table 12: France ASEAN Power EPC Market Revenue (Million) Forecast, by Application 2019 & 2032
- Table 13: Spain ASEAN Power EPC Market Revenue (Million) Forecast, by Application 2019 & 2032
- Table 14: Italy ASEAN Power EPC Market Revenue (Million) Forecast, by Application 2019 & 2032
- Table 15: Spain ASEAN Power EPC Market Revenue (Million) Forecast, by Application 2019 & 2032
- Table 16: Belgium ASEAN Power EPC Market Revenue (Million) Forecast, by Application 2019 & 2032
- Table 17: Netherland ASEAN Power EPC Market Revenue (Million) Forecast, by Application 2019 & 2032
- Table 18: Nordics ASEAN Power EPC Market Revenue (Million) Forecast, by Application 2019 & 2032
- Table 19: Rest of Europe ASEAN Power EPC Market Revenue (Million) Forecast, by Application 2019 & 2032
- Table 20: Global ASEAN Power EPC Market Revenue Million Forecast, by Country 2019 & 2032
- Table 21: China ASEAN Power EPC Market Revenue (Million) Forecast, by Application 2019 & 2032
- Table 22: Japan ASEAN Power EPC Market Revenue (Million) Forecast, by Application 2019 & 2032
- Table 23: India ASEAN Power EPC Market Revenue (Million) Forecast, by Application 2019 & 2032
- Table 24: South Korea ASEAN Power EPC Market Revenue (Million) Forecast, by Application 2019 & 2032
- Table 25: Southeast Asia ASEAN Power EPC Market Revenue (Million) Forecast, by Application 2019 & 2032
- Table 26: Australia ASEAN Power EPC Market Revenue (Million) Forecast, by Application 2019 & 2032
- Table 27: Indonesia ASEAN Power EPC Market Revenue (Million) Forecast, by Application 2019 & 2032
- Table 28: Phillipes ASEAN Power EPC Market Revenue (Million) Forecast, by Application 2019 & 2032
- Table 29: Singapore ASEAN Power EPC Market Revenue (Million) Forecast, by Application 2019 & 2032
- Table 30: Thailandc ASEAN Power EPC Market Revenue (Million) Forecast, by Application 2019 & 2032
- Table 31: Rest of Asia Pacific ASEAN Power EPC Market Revenue (Million) Forecast, by Application 2019 & 2032
- Table 32: Global ASEAN Power EPC Market Revenue Million Forecast, by Country 2019 & 2032
- Table 33: Brazil ASEAN Power EPC Market Revenue (Million) Forecast, by Application 2019 & 2032
- Table 34: Argentina ASEAN Power EPC Market Revenue (Million) Forecast, by Application 2019 & 2032
- Table 35: Peru ASEAN Power EPC Market Revenue (Million) Forecast, by Application 2019 & 2032
- Table 36: Chile ASEAN Power EPC Market Revenue (Million) Forecast, by Application 2019 & 2032
- Table 37: Colombia ASEAN Power EPC Market Revenue (Million) Forecast, by Application 2019 & 2032
- Table 38: Ecuador ASEAN Power EPC Market Revenue (Million) Forecast, by Application 2019 & 2032
- Table 39: Venezuela ASEAN Power EPC Market Revenue (Million) Forecast, by Application 2019 & 2032
- Table 40: Rest of South America ASEAN Power EPC Market Revenue (Million) Forecast, by Application 2019 & 2032
- Table 41: Global ASEAN Power EPC Market Revenue Million Forecast, by Country 2019 & 2032
- Table 42: United Arab Emirates ASEAN Power EPC Market Revenue (Million) Forecast, by Application 2019 & 2032
- Table 43: Saudi Arabia ASEAN Power EPC Market Revenue (Million) Forecast, by Application 2019 & 2032
- Table 44: South Africa ASEAN Power EPC Market Revenue (Million) Forecast, by Application 2019 & 2032
- Table 45: Rest of Middle East and Africa ASEAN Power EPC Market Revenue (Million) Forecast, by Application 2019 & 2032
- Table 46: Global ASEAN Power EPC Market Revenue Million Forecast, by Source 2019 & 2032
- Table 47: Global ASEAN Power EPC Market Revenue Million Forecast, by Geography 2019 & 2032
- Table 48: Global ASEAN Power EPC Market Revenue Million Forecast, by Country 2019 & 2032
- Table 49: Global ASEAN Power EPC Market Revenue Million Forecast, by Source 2019 & 2032
- Table 50: Global ASEAN Power EPC Market Revenue Million Forecast, by Geography 2019 & 2032
- Table 51: Global ASEAN Power EPC Market Revenue Million Forecast, by Country 2019 & 2032
- Table 52: Global ASEAN Power EPC Market Revenue Million Forecast, by Source 2019 & 2032
- Table 53: Global ASEAN Power EPC Market Revenue Million Forecast, by Geography 2019 & 2032
- Table 54: Global ASEAN Power EPC Market Revenue Million Forecast, by Country 2019 & 2032
- Table 55: Global ASEAN Power EPC Market Revenue Million Forecast, by Source 2019 & 2032
- Table 56: Global ASEAN Power EPC Market Revenue Million Forecast, by Geography 2019 & 2032
- Table 57: Global ASEAN Power EPC Market Revenue Million Forecast, by Country 2019 & 2032
- Table 58: Global ASEAN Power EPC Market Revenue Million Forecast, by Source 2019 & 2032
- Table 59: Global ASEAN Power EPC Market Revenue Million Forecast, by Geography 2019 & 2032
- Table 60: Global ASEAN Power EPC Market Revenue Million Forecast, by Country 2019 & 2032
- Table 61: Global ASEAN Power EPC Market Revenue Million Forecast, by Source 2019 & 2032
- Table 62: Global ASEAN Power EPC Market Revenue Million Forecast, by Geography 2019 & 2032
- Table 63: Global ASEAN Power EPC Market Revenue Million Forecast, by Country 2019 & 2032
Frequently Asked Questions
1. What is the projected Compound Annual Growth Rate (CAGR) of the ASEAN Power EPC Market?
The projected CAGR is approximately > 6.00%.
2. Which companies are prominent players in the ASEAN Power EPC Market?
Key companies in the market include Hyundai Engineering Co Ltd, JGC Holdings Corporation, Sumitomo Corporation, Trung Nam Group, Toshiba Corporation, Doosan Heavy Industries & Construction Co Ltd, Indika Energy, Kawasaki Heavy Industries Ltd, IHI Corporation, Mitsubishi Heavy Industries Ltd.
3. What are the main segments of the ASEAN Power EPC Market?
The market segments include Source, Geography.
4. Can you provide details about the market size?
The market size is estimated to be USD XX Million as of 2022.
5. What are some drivers contributing to market growth?
4.; Uninterrupted and Reliable Power Supply and Heavy Deployment of DG (diesel generator) Set4.; Improvement in Technology of Diesel Generator.
6. What are the notable trends driving market growth?
Renewables Power Source to Witness Significant Growth.
7. Are there any restraints impacting market growth?
4.; The Growing Trend of Renewable Power Generation.
8. Can you provide examples of recent developments in the market?
In December 2021, Solar Philippines Nueva Ecija Corporation (SPNEC), a major project developer based in the Philippines, started constructing the first 50 MW unit of a 500 MW solar PV facility. The first 50 MW is planned to be commissioned by the end of 2022 and the rest of the project by 2023.
9. What pricing options are available for accessing the report?
Pricing options include single-user, multi-user, and enterprise licenses priced at USD 4750, USD 5250, and USD 8750 respectively.
10. Is the market size provided in terms of value or volume?
The market size is provided in terms of value, measured in Million.
11. Are there any specific market keywords associated with the report?
Yes, the market keyword associated with the report is "ASEAN Power EPC Market," which aids in identifying and referencing the specific market segment covered.
12. How do I determine which pricing option suits my needs best?
The pricing options vary based on user requirements and access needs. Individual users may opt for single-user licenses, while businesses requiring broader access may choose multi-user or enterprise licenses for cost-effective access to the report.
13. Are there any additional resources or data provided in the ASEAN Power EPC Market report?
While the report offers comprehensive insights, it's advisable to review the specific contents or supplementary materials provided to ascertain if additional resources or data are available.
14. How can I stay updated on further developments or reports in the ASEAN Power EPC Market?
To stay informed about further developments, trends, and reports in the ASEAN Power EPC Market, consider subscribing to industry newsletters, following relevant companies and organizations, or regularly checking reputable industry news sources and publications.
Methodology
Step 1 - Identification of Relevant Samples Size from Population Database


Step 2 - Approaches for Defining Global Market Size (Value, Volume* & Price*)

Note*: In applicable scenarios
Step 3 - Data Sources
Primary Research
- Web Analytics
- Survey Reports
- Research Institute
- Latest Research Reports
- Opinion Leaders
Secondary Research
- Annual Reports
- White Paper
- Latest Press Release
- Industry Association
- Paid Database
- Investor Presentations

Step 4 - Data Triangulation
Involves using different sources of information in order to increase the validity of a study
These sources are likely to be stakeholders in a program - participants, other researchers, program staff, other community members, and so on.
Then we put all data in single framework & apply various statistical tools to find out the dynamic on the market.
During the analysis stage, feedback from the stakeholder groups would be compared to determine areas of agreement as well as areas of divergence


